On: 11 July 2011, At: 02:29 Publisher: Taylor & Francis
Informa Ltd Registered in England and Wales Registered Number: 1072954 Registered office: Mortimer House, 37-41 Mortimer Street, London W1T 3JH, UK
Enterprise Information Systems
Publication details, including instructions for authors and subscription information:http://www.tandfonline.com/loi/teis20
Generating event logs from
non-process-aware systems enabling
business process mining
Ricardo Pérez-Castillo a , Barbara Weber b , Jakob Pinggera b , Stefan Zugal b , Ignacio García-Rodríguez de Guzmán a & Mario Piattini a
a
Alarcos Research Group, University of Castilla-La Mancha, Paseo de la Universidad 4, 13071, Ciudad Real, Spain
b
Quality Engineering, University of Innsbruck, Technikerstraße 21a, 6020, Innsbruck, Austria
Available online: 13 Jun 2011
To cite this article: Ricardo Pérez-Castillo, Barbara Weber, Jakob Pinggera, Stefan Zugal, Ignacio García-Rodríguez de Guzmán & Mario Piattini (2011): Generating event logs from non-process-aware systems enabling business process mining, Enterprise Information Systems, 5:3, 301-335
To link to this article: http://dx.doi.org/10.1080/17517575.2011.587545
PLEASE SCROLL DOWN FOR ARTICLE
Full terms and conditions of use: http://www.tandfonline.com/page/terms-and-conditions
This article may be used for research, teaching and private study purposes. Any substantial or systematic reproduction, re-distribution, re-selling, loan, sub-licensing, systematic supply or distribution in any form to anyone is expressly forbidden.
The publisher does not give any warranty express or implied or make any representation that the contents will be complete or accurate or up to date. The accuracy of any
instructions, formulae and drug doses should be independently verified with primary sources. The publisher shall not be liable for any loss, actions, claims, proceedings, demand or costs or damages whatsoever or howsoever caused arising directly or indirectly in connection with or arising out of the use of this material.
Generating event logs from non-process-aware systems enabling business
process mining
Ricardo Pe´rez-Castilloa*, Barbara Weberb, Jakob Pinggerab, Stefan Zugalb, Ignacio Garcı´a-Rodrı´guez de Guzma´naand Mario Piattinia a
Alarcos Research Group, University of Castilla-La Mancha, Paseo de la Universidad 4, 13071 Ciudad Real, Spain;bQuality Engineering, University of Innsbruck, Technikerstraße 21a, 6020
Innsbruck, Austria
(Received 10 February 2011; final version received 8 May 2011)
As information systems age they become legacy information systems (LISs), embedding business knowledge not present in other artefacts. LISs must be modernised when their maintainability falls below acceptable limits but the embedded business knowledge is valuable information that must be preserved to align the modernised versions of LISs with organisations’ real-world business processes. Business process mining permits the discovery and preservation of all meaningful embedded business knowledge by using event logs, which represent the business activities executed by an information system. Event logs can be easily obtained through the execution of process-aware information systems (PAISs). However, several non-process-aware information systems also implicitly support organisations’ business processes. This article presents a technique for obtaining event logs from traditional information systems (without any in-built logging functionality) by statically analysing and modifying LISs. The technique allows the modified systems to dynamically record event logs. The approach is validated with a case study involving a healthcare information system used in Austrian hospitals, which shows the technique obtains event logs that effectively and efficiently enable the discovery of embedded business processes. This implies the techniques provided within the process mining field, which are based on event logs, may also be applied to traditional information systems.
Keywords: process mining; event log; dynamic analysis; modernisation; legacy system
1. Introduction
Business processes have become a key asset in organisations, since they allow them to follow their daily performance and to address technological and organisational changes and consequently improve their competitiveness (Castellanos et al. 2009). Enterprise information systems automate most of the business processes of an organisation (Weske 2007) but uncontrolled maintenance causes them to age and become legacy information systems (LISs) (Ulrich 2002), e.g. owing to code written long ago becoming technologically obsolete. LISs significantly resist modification and evolution, failing to meet new and constantly changing business requirements
*Corresponding author. Email: [email protected] Vol. 5, No. 3, August 2011, 301–335
ISSN 1751-7575 print/ISSN 1751-7583 online Ó2011 Taylor & Francis
DOI: 10.1080/17517575.2011.587545 http://www.informaworld.com
(Paradauskas et al. 2006). Their continuous evolution implies that their maintain-ability eventually falls below acceptable limits, meaning that they have to be modernised (Mens 2008), which may be done, for instance, by re-implementing them using another, better platform or an enhanced design, while the business knowledge embedded in them is preserved (Ulrich and Newcomb 2010). It is very important to take up the challenge of preservation of embedded knowledge for two main reasons: (i) it is not present in any other artefact, and (ii) it must be considered when aligning the improved system with the organisation’s current business processes (Heuvel 2006).
Since a company’s information system is usually the main repository of its business knowledge (Mens 2008), its modernisation requires an in-depth under-standing of how it currently supports the organisation’s business processes. This problem motivates the use of process mining, which has become a powerful tool for understanding what is really going on in an organisation by observing the information systems (van der Aalst and Weijters 2005). It seeks to extract business process knowledge from process execution logs known asevent logs, which contain information about the start and completion of activities and the resources executed by the processes (Castellanoset al. 2009), and are the input for the majority of the process mining techniques and algorithms. There are several techniques in the field of process mining for recovering business processes from three different perspectives (van der Aalst and Weijters 2005): (i) the process perspective, focusing on the control flow between business activities; (ii) the organisational perspective, describing the organisational structure; and (iii) the case perspective, focusing on the characterisa-tion of each execucharacterisa-tion of the process, also known as process instances.
Currently, process mining techniques and algorithms focus on event logs obtained from process-aware information systems (PAISs) (Dumaset al. 2005), e.g. process management systems such as enterprise resource planning (ERP) or customer relationship management (CRM) systems, whose nature (in particular their process-awareness) facilitates the direct registration of events throughout process execution. Indeed, most process-mining techniques and tools are developed for information systems of this kind (Castellanoset al. 2009), and the event logs are represented in a common format used by the majority of process-mining tools known as MXML (Mining XML) (van der Aalstet al. 2009). In addition to PAISs, a vast number of traditional (non-process-aware) information systems (most of which have become LISs) also support the business processes of an organisation, and could thus benefit from process mining.
However, such non-process-aware information systems impose five key challenges for obtaining meaningful event logs for feasible use with process-mining techniques: (i) business process definitions are implicitly described in legacy code, so it is not obvious which events should be recorded in the event log; (ii) there is often different granularity between callable units (invocable pieces of source code like methods, function, procedures, etc.) of an information system and activities of a business process; (iii) legacy code not only contains business activities, but also technical aspects that have to be eliminated when mining a business process; (iv) since traditional systems do not explicitly define business processes, their starts and ends have to be established; (v) finally, absence of process-awareness means that it is not obvious how business activities should be correlated in each case.
This article proposes a technique for obtaining process event logs from traditional (non-process-aware) information systems addressing these challenges
on the basis of both static and dynamic analyses of the systems’ source code to simulate the event log registration mechanism of a PAIS. Firstly, the static analysis syntactically analyses the source code and injects pieces of it in a non-invasive way in specific parts of the LIS. Secondly, the dynamic analysis of the modified source code makes it possible to create an event log file in MXML format during system execution. The proposed technique is further supported by specific information that must be provided by business experts and systems analysts familiar with the system. Its main advantage is the analysis of the legacy source code from a dynamic point of view (Cornelissen et al. 2009), which means that it only considers valuable information gathered during system execution. Its novelty is the possibility of obtaining event logs from traditional LISs that were not designed to create them. Its feasibility is demonstrated with a case study involving a healthcare information system, whose results show that the event logs obtained are of good quality.
The remainder of this article is organised as follows. Section 2 discusses related studies. Section 3 presents an example used in subsequent sections to illustrate the challenges and the solution proposed. Section 4 explains the main challenges for obtaining event logs from traditional information systems. Section 5 presents the technique proposed to tackle them. Section 6 provides a case study of a healthcare system to validate the proposal. Finally, Section 7 provides a conclusion and discusses future work.
2. Related work
There are several studies in the literature that address the problem of preserving the embedded business knowledge in software modernisation processes in traditional (non-process-aware) information systems. Some are based on static analysis of source code like Zou and Hung (2006), who developed a framework to recover workflows from LISs. This framework statically analyses the source code and applies a set of heuristic rules to discover business knowledge from source code. Similarly, Pe´rez-Castilloet al. (2009) propose MARBLE, an architecture-driven modernisation (ADM) framework that uses the knowledge discovery metamodel (KDM) standard to obtain business processes by statically analysing legacy source code. In addition to source code, other works consider additional legacy software artefacts. For example, Paradauskas and Laurikaitis (2006) present a framework to recover business knowledge through the inspection of the data stored in databases. Ghose et al. (2007), in turn, propose a set of text-based queries in source code and documentation for extracting business knowledge. Motahari Nezhadet al. (2008) proposeProcess Spaceship, a static analysis-based technique to discover process views from process related data sources (e.g. web service logs). This approach addresses the event correlation challenge using correlation conditions defined as binary predicates over the event contents by business experts. Motahari et al. (2007) propose a similar approach that uses web service logs to deal with the event correlation challenge. However, this approach uses graph theory techniques instead of information provided by business experts.
All these studies rely solely on static analysis as a reverse engineering technique to extract business knowledge. However, they have the major disadvantage that run-time information is not taken into account. Therefore, other solutions have been suggested based on dynamic analysis, which has been applied for a wide set of topics in the literature (Cornelissenet al. 2009), for instance a feature location technique
(Eisenbarth et al. 2003), which gathers the information from a set of scenarios invoking the features. Other authors (Di Francescomarino et al. 2009) consider graphical user interfaces of web applications to discover business processes. In addition, Caiet al. (2009) propose an approach combining requirement reacquisition with dynamic and static analysis techniques. Firstly, a set of use cases is recovered by means of interviewing the system’s users. Secondly, the system is dynamically traced according to these use cases. Finally, the traces obtained at run-time are statically analysed to recover business processes.
All these works based on dynamic analysis share a major limitation, since they always propose specific solutions focusing on a sole mining algorithm to discover specific business knowledge and use specific or proprietary formats to represent the processes or the intermediate information. As a consequence, these approaches cannot be reused in several mining scenarios since they consist ofad hocsolutions. In this regard, other approaches focus on obtaining event logs as an intermediate step. Event logs depict the sequence of business process activities executed and are then used in several well-known process mining algorithms to discover the embedded business knowledge. For instance, Gu¨nther and van der Aalst (2007) provide a generic import framework for obtaining event logs from different kinds of PAIS. It deals with some interesting challenges, some of them similar to those in this article, but they are related to PAISs rather than LISs. In addition, Ingvaldsen and Gulla (2008) focus on ERP systems to obtain event logs from the SAP’s transaction data logs.
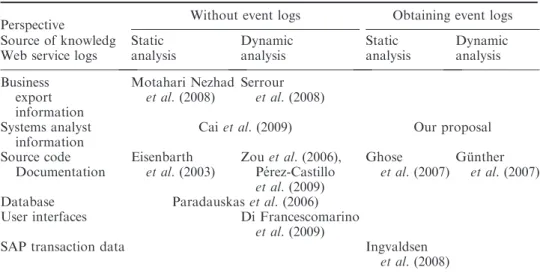
All these proposals have been suggested for use with PAISs, although traditional LISs have not been treated so far using the event log approach. Thus in contrast to these studies, our solution proposes a technique based on dynamic analysis (combined with static analysis) to obtain MXML event logs from traditional LISs that is not restricted to a specific process-mining algorithm. Table 1 shows a comparison between the different business process recovery techniques in the literature and our proposal. To compare all the techniques each proposal is framed
Table 1. Comparison of other business process recovery proposals with ours.
Perspective Without event logs Obtaining event logs Source of knowledg
Web service logs
Static analysis Dynamic analysis Static analysis Dynamic analysis Business export information Motahari Nezhad et al.(2008) Serrour et al.(2008) Systems analyst information
Caiet al.(2009) Our proposal
Source code Documentation Eisenbarth et al.(2003) Zouet al.(2006), Pe´rez-Castillo et al.(2009) Ghose et al.(2007) Gu¨nther et al.(2007) Database Paradauskaset al.(2006)
User interfaces Di Francescomarino
et al.(2009)
SAP transaction data Ingvaldsen
et al.(2008)
in the matrix of Table 1. The rows of the matrix represent all the different sources of knowledge (or software artefacts), and the columns specify the system perspective (static or dynamic) considered for extracting business knowledge.
In addition to all the effort regarding business process mining techniques and algorithms, there is work about the usage of process mining techniques in other areas apart from the business process management field. These approaches assume the presence of event logs and they are not concerned with obtaining event logs from systems without in-built logging functionality. For example, Funket al. (2010) use process mining techniques to analyse data about product usage and user experience. Rozinatet al. (2009) investigate the applicability of process mining to less structured processes. Trkmanet al. (2010) employ business process mining techniques to improve the supply chain in companies. Hofstra (2009) uses process mining techniques to get insights into the actual user behaviour and improve consequently the usability of software products. Gu¨ntheret al. (2010) use process mining techniques to analyse the test process of ASML, which is the world’s leading manufacturer of chip-making equipment and a key supplier to the semi-conductor industry.
3. A demonstrative example
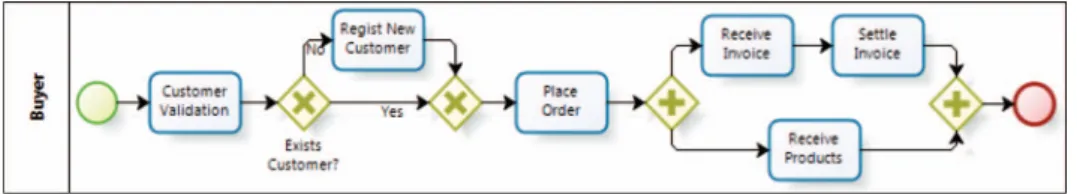
This section introduces an example to illustrate all the challenges in Section 4 and to explain the working of the technique presented in Section 5. The example considers a small business process as the object of study, and aJavaapplication implementing it. Figure 1 shows the source business process, which is based on the product order process described byWeske(Weske 2007). This process allows registered customers to place orders. In parallel, customers receive the products and the invoice.
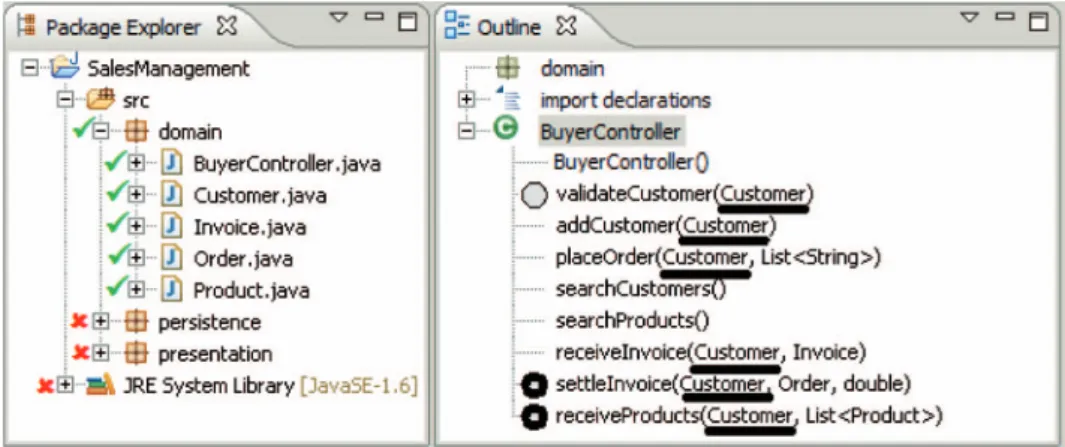
Figure 2 shows the structure of the small application developed to support the business process illustrated in Figure 1. The application follows the traditional decomposition into three layers (Eckerson 1995): (i) the domain layer supports all the business entities and controllers; (ii) the persistence layer handles data access; and (iii) the presentation layer deals with the user interfaces (see Figure 2, left). The BuyerController class contains most of the logic of the application (see Figure 2, right), i.e. it provides the methods supporting the activities of the source business process. Figure 2 includes additional symbols over the screenshot to aid the explanation of the process-aware challenges and technique proposed in following sections.
4. Process-awareness challenges
This section shows the main challenges for obtaining event logs from traditional information systems: lack of process-awareness, granularity, elimination of technical code, process scope and process instance scope.
Figure 1. The original business process for ordering products.
4.1. Challenge 1 – lack of process-awareness
Ascertaining which activities are executed is the first major challenge to registering the events of a traditional (non-process-aware) information system, owing to the different natures of traditional information systems and PAISs. While PAISs manage processes consisting of a sequence of activities or tasks with a common business goal using explicit process descriptions (Weske 2007) (see Figure 3A), traditional systems are a set of methods, functions or procedures (callable units in general) where processes are only implicitly described and thus blurred. Traditional systems can be seen as a graph where nodes represent the callable units, and arcs represent their invocation (see Figure 3B). The call graph thus represents the control flow of a traditional system according to the domain logic implemented.
To address this challenge, Zou and Hung (2006) propose the ‘a callable unit/a business activity’ approach which considers each callable unit of a traditional information system as a candidate business activity in a process mining context. Zou and Hung’s approach provides a good starting point, but is of a heuristic nature, and therefore ignores several major challenges concerning the inherent nature of source code such as the different granularity of callable units and business activities (cf.
Figure 2. Structure of the legacy Java application.
Figure 3. Comparison between PAISs and traditional LIS.
Section 4.2) and the mixture of business-related callable units and technical callable units typical of LISs (cf. Section 4.3).
4.2. Challenge 2 – granularity
The different granularity of business activities and callable units in LISs constitutes another important challenge. According to the approach proposed by Zou and Hung (2006), each callable unit in a traditional LIS is considered as an activity to be registered in an event log. However, traditional systems typically contain thousands of callable units, some of which are large ones supporting the main business functionalities of the system (case i), while many are very small and do not directly support any business activity (case ii). In some situations, a set of small callable units together supports a business activity (case iii).
Cases (i) and (ii) could be addressed by considering only coarse-grained callable units as business activities and discarding fine-grained ones, but, unfortunately, the dividing line between coarse- and fine-grained callable units is unknown. However, different solutions may be implemented to rule out fine-grained callable units, such as source code metrics (e.g. lines of source code metric or the cyclomatic complexity metric) (Rozman et al. 1991). This solution is easy to implement, but has the disadvantage of high computational costs when the event log file is written during run-time over a long period. Alternatively, heuristic-based solutions can offer a good alternative with minimal computational costs. For instance, all setter and getter methods of the classes representing business entities likeCustomer or Product(see Figure 2) only read or write object fields and can thus be considered fine-grained units (case ii). To avoid mined business processes getting bloated with unnecessary details, the fine-grained callable units are not considered as activities in the event log. For case (iii), another heuristic can be defined to cluster some fine-grained callable units into a business activity. For instance, if all the settermethods of the Customer entity (see Figure 2) are executed consecutively for the same Customer object, all those executed callable units can be considered as a unique business activity named, for instance, ‘create Customer’, dealing with creating new customers. As a consequence, those fine-grained callable units will not be discarded (despite the previous heuristic for cases (i) and (ii)), but a new business activity is created from all those fine-grained units executed in succession.
4.3. Challenge 3 – discarding technical code
Another important challenge is caused by the fact that LISs typically contain several callable units that cannot be considered business activities, but are of a technical nature. Callable units can be divided into two groups: (i) theproblem domaingroup, which contains the callable units related to the business entities and functionalities of the system to solve the specific problem (i.e. those implementing the business processes of the organisation) and (ii) the solution domain group, containing the callable units related to the technical nature of the platform or programming language used and aiding the callable units of the previous group. Since callable units belonging to the solution domain do not constitute business activities, they should not be considered in the event log.
However,how can we know whether or not a callable unit belongs to the solution domain? As a first approximation, callable units in charge of auxiliary or technical
functions unrelated to any use case of the system (e.g. callable units belonging to the presentationorpersistencelayer in the example) can be ruled out. However, owing to the delocalisation and interleaving problems (Ratiu 2009) the problem and solution domain groups are not always discrete sets as each can contain units of the other. In the example, the methods searchCustomers and searchProducts in the class BuyerController (see Figure 2) mix problem and solution code, since they also contain code related to database access. Consequently, in many cases the only possible solution is for systems analysts to provide the information as to whether a callable unit belongs to the problem or solution domain.
4.4. Challenge 4 – process scope
Another important challenge is to establish the scope of a business process (i.e. to identify where a process instance starts and ends). While the start and end points of a business process are explicitly defined in PAISs (see Figure 3A), traditional information systems lack any explicit information about the processes supported (see Figure 3B).
Unfortunately, the information as to where a process starts and ends cannot be automatically derived from the source code. In the example illustrated in Section 3, there is not enough information to determine what methods comprise the start and end points of the business processes supported, human interaction being necessary. On the one hand, business experts know the business processes of the organisation as well as their start and end activities. On the other hand, systems analysts know what callable units in the source code support the start and end activities.
4.5. Challenge 5 – process instance scope
The lack of process-awareness in traditional information systems poses another fundamental challenge for a business process is typically not only executed in isolation, but multiple instances are executed concurrently. If a particular business activity is executed (i.e. a callable unit is invoked), this particular event has to be correctly linked to one of the running process instances. Let us consider the original business process of the example (see Figure 1). The Java application supporting it could execute the sequence ‘Customer Validation’ (Customer 1), ‘Customer Validation’ (Customer 2), ‘Place Order’ (Customer 1) and ‘Place Order’(Customer 2) for two different customers. To obtain meaningful event logs, the activities executed by the information system must be correctly linked to either Customer 1 or Customer 2 (i.e. the customer information in this example uniquely identifies a process instance).
Correlating an activity with a data set that uniquely identifies the process instance it belongs to (e.g. the customer name) poses significant challenges. In particular, the objects to be used for uniquely identifying a process instance (i.e. what the correlation data is) must be established. If correlation objects have been identified, their location in each callable unit within the legacy source code has to be determined. The correlation data set can be explicitly defined by selecting the appropriate argument or variable in each particular callable unit. In addition, the correlation data set can be implicitly defined by choosing a classifier or data type in the source code (e.g. the Customer class in the example), so each occurrence of the selected classifier in a callable unit (e.g. a particular Customer object) is used as
correlation data. In both cases, definition of the correlation data set requires the input of business experts who know what the correlation data set is, as well as the input of systems analysts who know the location of those correlation data.
Another related problem is that the correlation data might be lost during run-time, since some callable units may not instantiate or use any object of the classifier selected as the correlation data set (e.g. searchCustomers or searchProducts in the example). For this reason, traceability mechanisms throughout callable units should be implemented to have the correlation data available at any point of the source code during system execution.
5. The solution proposed
This article proposes a technique to obtain event logs from non-process-aware systems addressing the challenges discussed above. Our proposal presents the guidelines of a generic technique, although the supporting tool,Event Traces Injector (ETI), is specially designed for object-oriented systems.
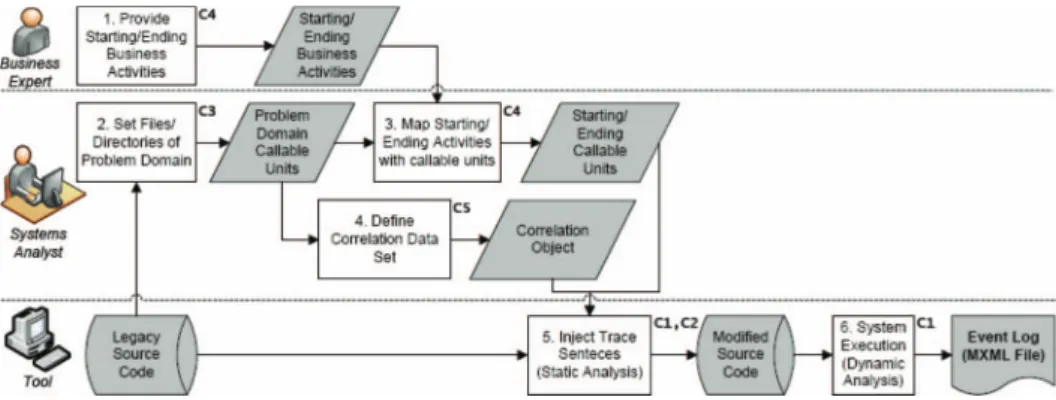
The technique is based on static analysis of source code combined with a dynamic analysis.Static analysisexamines the source code in a static way, and instruments the source code by injecting code for generating specific events during its execution (cf. Section 5.1). After static analysis, the source code isdynamically analysedin run-time by means of the injected statements (cf. Section 5.2). Figure 4 gives an overview of the technique, the tasks carried out and the artefacts obtained (shown in grey).
5.1. Static analysis to instrument source code
The static analysis is the key stage of the technique proposed to instrument legacy source code. Source code instrumentation means that additional statements are injected into the original source code to record events during system execution. As traditional information systems lack process-awareness, this task poses several challenges (as introduced in Section 4). While challenges C1 and C2 can be addressed in a fully automated manner (Tasks 5 and 6 in Figure 4), challenges C3, C4 and C5 require input from the business expert and/or the systems analyst (Tasks 1–4 in Figure 4).
In Task 1, business experts identify the start and end business activities of the business processes under investigation. This information is necessary to deal with the
Figure 4. The overall process carried out by means of the proposed technique.
challenge of process scope (Challenge C4). In parallel, in Task 2, systems analysts examine the legacy source code and filter directories, files or sets of callable units that support business activities, (i.e. they select the callable units belonging to the problem domain). This information is necessary to reduce potential noise in the event log due to technical source code (Challenge C3). Task 3 is the mapping between start/end business activities and the callable units supporting them, which is again supported by the systems analysts (Challenge C4).
In Task 4, systems analysts establish the correlation data set that uniquely identifies a process instance (Challenge C5), selecting for this purpose a classifier (or an object kind in general for any object-oriented language). Each object instance of that classifier will be used as the correlation data set in all the callable units that use it or have it as a parameter. This information is then used during run-time when the dynamic analysis writes the event log to correlate the activities executed with the appropriate process instance. Unfortunately, some callable units could not have a correlation object in their scope, since the correlation data may not be available in some intermediate or auxiliary callable units. In order to solve this problem, the technique implements a solution based on the heuristic principle of locality. This solution includes callable units, whenever the correlation data are empty, in the same process instance as the last callable unit executed. This solution is implemented during the final dynamic analysis in run-time (cf. Section 5.2).
Figure 2 shows the information provided by the systems analysts for mining the ‘order product’ process illustrated in Section 3. The files or directories (Java files and packages in ETI, the supporting tool) that do not contain technical source code, and therefore belong to the problem domain, are marked with a tick (Task 2). The methods that support start or end activities are marked with circles, thin lines indicating start activities and thick ones end activities (Tasks 1, 3). The callable units ‘validateCustomer’ and ‘receiveProducts’ were respectively mapped with the start and end activities of the process ‘Ordering Products’ described in Figure 1. The Customer class is used as correlation data set, because it allows for uniquely identifying process instances for that particular application (Task 4). Figure 2 shows some underlined parameters (Customer objects) that represent the correlation information to be used in the callable unit.
After that, Task 5 consists of the syntactic analysis of the source code. The parser analyses the original source code and injects statements as required to enable event log generation. This analysis can be automated following the algorithm presented in Figure 5. During static analysis, the source code is broken down into callable units (Challenge 1), the algorithm only modifying the units belonging to the problem domain subgroup (see line 4 of Figure 5) selected by the systems analyst in Task 3. In addition, fine-grained callable units (e.g. setter, getter, constructor, toString and equals callable units) are automatically discarded (Challenge C2). Finally, one statement is injected at the beginning and one at the end of each of the callable units filtered (see lines 12 and 13 of Figure 5).
The injected statements will invoke the WriteEventfunction at runtime, which writes the respective event into the event log (cf. Section 5.2). The injected statements (see lines 12 and 13 of Figure 5) have the following parameters:
. The name of the callable unit being executed.
. The name of the respective process, which is only known if the callable unit was mapped with one or more start or end activities.
. The correlation data defined for the callable unit, whenever the unit contains or uses an object of the classifier selected as the correlation object.
. The kind of the event, which automatically represents a start event for the first statement and an end event for the last one
. Whether the callable unit was defined by experts as a start activity
. Whether the callable unit was previously mapped with an end business activity . The log variable, the path where the event log will be registered, which is
provided by systems analysts.
Continuing the example described in Section 3, Figure 6 shows the method addCustomerafter the injection of the statements. According to the algorithm (see Figure 5) statement S1 is added directly after the method signature. The body of the source method is then added without any changes and finally statement S2 is added after the body to the method.
5.2. Dynamic analysis for obtaining event logs
After static analysis, the instrumented source code can be released to production again. The new code makes it possible to write event log files according to the MXML (Mining XML) format (Gu¨nther and van der Aalst 2007), which is used by the process mining toolProM(van der Aalstet al. 2009).
Figure 6. The Java method ‘addCustomer’ modified with the injected statements. Figure 5. Algorithm to inject traces by means of static analysis.
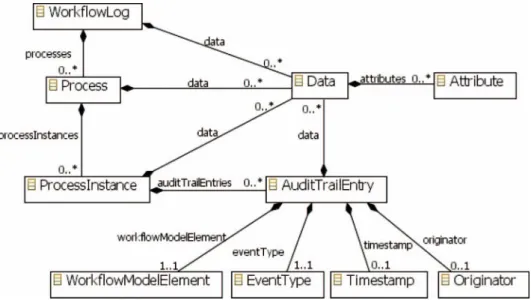
The MXML format represents an event log as a set of Process elements that contain several ProcessInstance elements, which each have a sequence of AuditTrailEntry elements (see Figure 7). Each AuditTrailEntry element represents an event and consists of four main elements:
. TheWorkflowModelElementthat represents the executed activity.
. TheEventType showing whether the activity is being executed (start) or had been completed (complete)
. TheOriginatoridentifying the user who started or completed the activity. . The Timestamp recording the date and time of the event.
In addition, all these elements can have aDataelement that consists of a set of Attributesincluding related information.
When the control flow of the modified information system reaches an injected statement, a new event is added to the event log. The events are written by means of theWriteEvent function (see Figure 8), which is the function invoked through the injected statements, and has the parameters mentioned in the algorithm to inject statements (see Figure 5), which are established during static analysis, although the correlation data, for instance, are only known at run-time.
To add a new entry to the log file, the function starts searching for the appropriate process in the event log where the event must be written (see line 2 of Figure 8). If the process is null, then a new one is created. After that, theWriteEvent function examines the correlation data to determine which process instance the event has to be added to (see lines 3–5 of Figure 8). If the correlation data are empty, then the algorithm takes the correlation data of the previously executed callable unit to add the event to the correct process instance (see lines 6–9 of Figure 8). This solution is based on simple heuristics based on the principle of locality and allows for correlating events and process instances when no correlation data is available for the respective event. However, in order to add the event to a process instance, the
Figure 7. MXML metamodel to represent event logs.
WriteEvent function searches for the right one taking the correlation data into account (see lines 10 and 11 of Figure 8). If the expression does not find a process instance for the correlation data (i.e. because the event belongs to a start activity), the function creates a new process instance for the correlation data.
Finally, when the WriteEvent function has determined the correct process instance (InstanceToAppendin Figure 8), it adds the event to that particular instance (see lines 12–21 of Figure 8). The event, represented as anAuditTrailEntryelement (see Figure 7) is created in the event log model using: (i) the name of the executed callable unit that represents the WorkflowModelElement; (ii) the event type that is also a parameter of this function; (iii) the user logged into the operating system that executed the callable unit (or the user of the session if the system is a web application), which represents theoriginatorelement; and finally (iv) the system date and time when the callable unit was executed to represent thetimestamp element.
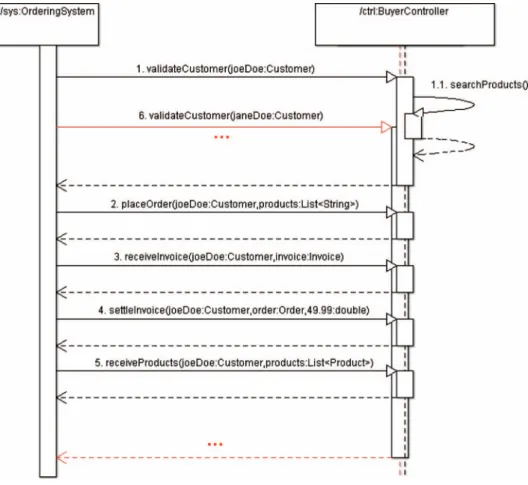
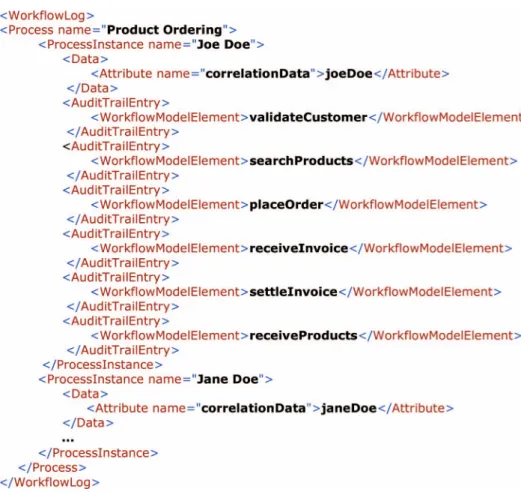
To illustrate how the dynamic analysis stage works, Figure 9 shows a sequence diagram according to the example introduced in Section 3, while Figure 10 shows (omitting some details) a piece of the MXML event log obtained from the execution of the scenario presented in Figure 9.
In the example, when the callable unit ‘validateCustomer’ (message 1 in Figure 9) is invoked with the new object named ‘joeDoe’, a new process instance is created to record the event related to the start activity of the process. The new process instance is specially created to register the order of customer Joe Doe. After a respective process instance has been created, the callable unit ‘searchProducts’ is executed (message 1.1 in Figure 9). This callable unit does not have any Customer object available in its scope, so the correlation data to link the respective event to the correct process instance is missing in this case. According to the proposed heuristic-based solution, the event related to this callable unit would be recorded in the process instance related to Joe Doe, since the last used correlation data is ‘joeDoe’ from message 1. The following callable unit executions (messages 2–5 in Figure 9) are also included in the process instance related to Joe Doe. If, however, another Figure 8. Algorithm to write an event in the event log.
customer (e.g. Jane Doe) makes an order at the same time (see message 6 in Figure 9), the events created from those callable unit executions would be collected in parallel in a different process instance taking into account the Customer object for Jane Doe as correlation data.
5.3. Final evaluation of the example
The event log progressively obtained during the instrumented system execution is used to recover business processes. Let us imagine that the following finite set of transactions is executed with the instrumented application, which involves the registered customer John Doe, as well as two unregistered customers:Jane DoeandFoo.
After the execution of those transactions, the resulting event log is analysed using ProM(van der Aalstet al. 2009) to check whether the result obtained is aligned with the original business process. The log obtained contains 1 process with 6 process (1) Jane Doe buys pdt1 and pdt2 (2) John Doe buys pdt1
(3) Jane Doe buys pdt3 and pdt4 (4) Foo buys pdt2, pdt3 and pdt4
(5) John Doe buys pdt4 (6) Foo buys pdt1
Figure 9. A sequence diagram of the product ordering application.
instances. It has 78 events altogether and between 12 and 16 events per process instance. Examination of the event log reveals that each process instance is related to a specific transaction executed in the application. In the next step, the genetic mining plug-in ofProM(Medeiroset al. 2007) is used for process discovery. Figure 11 shows the business process discovered using the genetic algorithm with a configuration consisting of (i) a population size of 100 and using 1000 generations in the genetic algorithm. The business process discovered has a fitness value of 0.94 in a range between 0 and 1.
The comparison between the original and the discovered business processes shows some deviations (compare Figure 1 and Figure 11). The first difference is
Figure 10. An MXML event log obtained from a particular scenario of execution.
Figure 11. The business process discovered using the genetic algorithm ofProM.
related to the activity names, i.e. the names in the process discovered are inherited from the source code and therefore differ from the labels used in the original business process. Another important difference is that in the discovered business process, activity ‘searchProducts’ (which is not present in the original process) occurs after activity ‘validateCustomer’. This deviation results from a technical method that was not filtered out by the systems analyst during static analysis. Finally, the parallel branches at the end of the process are not mined correctly (i.e. activities ‘receiveInvoice’, ‘receiveProducts’ and ‘settleInvoice’ are carried out sequentially, instead of concurrently). This deviation is due to the fact that the operations are always executed in the same order through the application that supports the original business process. Despite these deviations, the process obtained gives a good starting point for understanding the underlying business process. In addition, the technique proposed can be applied iteratively, i.e. business experts and systems analysts can refine the information provided in order to obtain better event logs representing the business process more accurately.
5.4. Coverage of the event log
During system execution, certain coverage must be ensured in order to get an event log that considers at least an appropriate number of execution paths. The proposal considers the function coverage, which is commonly used in software testing (Ammann and Offutt 2008), among other research fields. This criterion counts the instrumented callable units reached or invoked during system execution and is considered for the proposal instead of others like sentence coverage, decision coverage or condition coverage, as the callable unit is the analysis unit considered according to the ‘a callable unit/a business activity’principle.
This criterion only assesses the quality of the process of obtaining the event log, i.e. the completeness of the event log regarding all the candidate activities to be added. If systems analysts provide the wrong filtering concerning the instrumented callable units (and therefore, the wrong filtering regarding the set of candidate activities to be added), then the business processes retrieved from the log might be inaccurate even if the event log covers a certain percentage of instrumented callable units.
Besides the coverage criterion, the limit to be used in each case must be established. For instance, a coverage value of 0.9 means that at least 90% of all instrumented callable units were invoked during system execution. On one hand, the coverage limit can be established at the beginning by business experts and systems analysts. On the other hand, the execution time can be previously fixed, and the coverage obtained after that time at the end of the dynamic analysis stage can be used as a significance value of the event log obtained.
Ideally, the coverage limit is a value close to 100%. However, it is unrealistic to assume that 100% coverage can be reached in practice, at least within a reasonable period of time, since coverage evolution is usually characterised by an asymptotic curve. At the beginning, when the event log is empty and no callable unit has been executed, function coverage value quickly grows. At the end, when many callable units have already been executed, the coverage percentage increases more gradually. Even after the instrumented system is executed for a long time, a coverage value of 100% cannot be guaranteed, for a legacy system might contain unreachable code (i.e. dead code) or features rarely or never executed. For this reason, our proposal
considers a coverage limit of 60%, evaluated by considering only the instrumented callable units (not the total units). This percentage can be reached in a moderate time and provides a good estimation of how complete the event log is.
As a result of the dynamic analysis stage, event logs are obtained which can be used as the input for different process-mining algorithms. The business processes obtained using the event log obtained provide a good starting point to understand the source business process. If the results obtained do not provide sufficient quality, a new iteration of code instrumentation and dynamic analysis may be performed. Both business experts and systems analysts can refine the information provided for code instrumentation in the next iteration. As a consequence, the event log obtained during dynamic analysis might be better than the one previously obtained. In addition, experts of both kinds might stop the iterations when a sufficiently high coverage has been reached.
6. Case study
To validate the proposed technique a case study involving CHES (Meraner et al. 2009), a healthcare information system, was carried out following the formal protocol for planning, conducting and reporting case studies proposed by Brereton et al. (2008), thus improving the rigor and validity of the study. The following sections present in detail the main stages defined in the formal protocol: background, design, case selection, case study procedure, data collection, analysis and interpretation and validity evaluation.
ETI has been specially developed to semi-automatically support the code instrumentation in the static analysis stage. Additionally, the event logs obtained by means of the execution of the instrumented system are then dynamically analysed usingProM(van der Aalstet al. 2009). Both tools support the execution of the case study.
6.1. Background
Firstly, previous research on the topic must be identified. Related work presented in Section 2 discusses other approaches for recovering business processes from LISs and compares them with our approach (see Table 1). Our approach focuses particularly on traditional (non-process-aware) information systems and is based on static and dynamic analysis of the source code to obtain events logs. Therefore, the object of study is the technique proposed to obtain event logs from non-process-aware information systems, and thepurpose of this studyis the evaluation of specific properties of the proposed technique regarding its effectiveness and efficiency. Taking into account the object and purpose of the study, two main research questions are defined (see Table 2).
On the one hand,MQ1 checks whether the technique can obtain event logs to address the challenges presented, and whether the event logs obtained allow process-mining tools to effectively discover business processes.MQ1determines whether the business processes are accurately recovered from the event log, i.e. if the business processes discovered represent the business behaviour of the organisation that owns the LIS. Table 2 shows two additional research questions derived from MQ1. The first, AQ1, determines whether the business processes discovered include all the elements required in the real-world business processes, while the second one,AQ2,
checks whether the processes mined from the event log obtained contain any elements that do not belong to the organisation’s business processes. WhileAQ1is related to the completeness of the business process models,AQ2is more related to their specificity.
On the other hand, MQ2concerns the efficiency of the technique proposed for use with any information system regardless of its size.MQ2is also divided into two additional questions: AQ3 assesses the time spent on the injection of the special sentences in the source code of the LIS andAQ4concerns the performance penalty induced by the injected statements.
6.2. Design
The study follows the embedded case study design according to the classification proposed byYin(Yin 2003), whereby the case study consists of a single case (i.e. it focuses on a single LIS) but considers several analysis units within the case. The analysis units in this study are the different business processes supported by CHES. Therefore, the study consists in applying the technique proposed to obtain an event log, which is then mined to discover the set of business processes that is in turn analysed to answer the research questions in Table 2. For this purpose, some measures are established to answer the questions quantitatively (see Table 3).
To evaluate the effectiveness of the proposed method through questionMQ1, the study proposes using two measures: recall and precision, commonly used in information retrieval scenarios (Raghavanet al. 1989), which we have adapted for
Table 2. Case study research questions.
Id Research question
MQ1 Can the proposed technique obtain event logs from legacy information systems to effectively mine business processes?
AQ1 Can the technique obtain event logs discovering all the elements of the embedded business processes?
AQ2 Can the technique obtain event logs without discovering any elements not belonging to the business processes?
MQ2 Can the proposed technique be efficiently used with any LIS? AQ3 How much time is spent on obtaining event logs from a LIS?
AQ4 How much time is spent on discovering business processes from event logs?
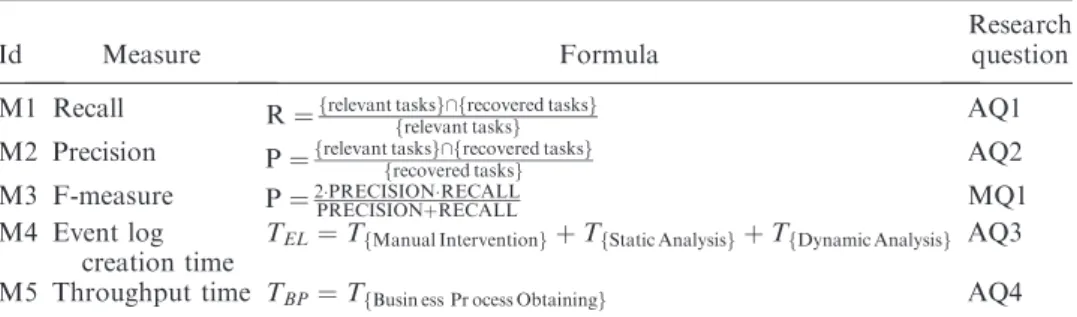
Table 3. Case study measures.
Id Measure Formula
Research question M1 Recall R¼frelevant tasksg\frecovered tasksg
frelevant tasksg AQ1
M2 Precision P¼frelevant tasksg\frecovered tasksg
frecovered tasksg AQ2
M3 F-measure P¼2PRECISIONRECALL
PRECISIONþRECALL MQ1
M4 Event log creation time
TEL¼TfManual InterventiongþTfStatic AnalysisgþTfDynamic Analysisg AQ3 M5 Throughput time TBP¼TfBusin ess Pr ocess Obtainingg AQ4
one of business process recovery. They are used because precisioncan be seen as a measure of exactness or fidelity, whereasrecallis a measure of completeness. On the one hand, recall (M1) represents the number of relevant elements recovered as a function of the total of relevant elements (recovered and not recovered) depicting the organisation’s whole business operation.Recallis related to the answer to question AQ1, while precision (M2) represents the number of relevant elements recovered within the set of recovered elements in a business process model. An element is considered relevant if it faithfully represents business operations or the business behaviour of the organisation in the real world.Precisionis used to answer question AQ2. While each business process discovered is an independent variable, these two measures are dependent variables in this study.
To evaluate these measures in a business process recovery scenario, we considered the task element as the unit element to be evaluated. Therefore, recall (M1) is defined as the number of true relevant tasks divided by the total number of relevant tasks, i.e. the relevant tasks of the business process and other tasks that should have been recovered but were not, while, precision (M2) is defined as the number of true relevant tasks divided by the total number of relevant (recovered) tasks, i.e. the sum of true relevant tasks and false relevant tasks that were incorrectly recovered.
Expert business opinion is used to evaluate these measures and ascertain whether or not a recovered task is relevant according to the organisation’s current business processes. A business process is usually defined as a set of tasks or activities as well as the ordering relationships. For this reason, although tasks are the only element evaluated, the ‘relevant task’ definition implicitly considers other business process elements related to the control flow. Relevant tasks are therefore defined by four conditions. The first condition specifies that the task must represent a real-life business operation within the organisation. So, the task named ‘parseDate’obtained from an auxiliary Java method does not represent any valuable business activity. This condition must not be evaluated by considering task names, since these names are inherited from legacy code and they may be biased as regards the real business activity names provided by business experts. For example, the task named ‘receiveOrder’, despite its name, is not the same as ‘Place Order’ (see Figure 1 in Section 3) but represents the valuable business activity in charge of receiving product orders. The second condition ensures that all the tasks preceding the evaluated task must be ‘recovered relevant tasks’. In order to meet this condition, there can be no non-relevant tasks with a sequence flow to the task evaluated. The third condition ensures that all subsequent tasks must be directly (or indirectly) ‘recovered relevant tasks’. The second and third conditions check the control flow of a business process model focusing on recovered tasks one by one. These conditions assume that if preceding and following tasks are also relevant, then the control flow would be appropriate since the relevance of those tasks is recursively evaluated in the same manner. Finally, the fourth condition specifies that all the Data Object elements read and written by the task evaluated must also be recovered.
The measures will be evaluated according to the business process models discovered by two business experts from the organisation as well as two systems analysts belonging to the system development team. The former are familiar with the organisation’s business processes and they begin by providing a sketch of the original business process supported by the system. The systems analysts, after discovering business process models from the event logs obtained, take the original business
process provided by the business experts and score the base measures like ‘recovered relevant tasks’, ‘recovered non-relevant tasks’, ‘non-recovered relevant tasks’, and so on. With this information, we then calculate the derived measures, precision and recall (see Table 3). Although theprecisionandrecallmeasures are appropriate, there is an inverse relationship between them, so extracting conclusions to answerMQ1 with an isolated evaluation of these measures is very difficult. For this reason, these measures are usually combined into a single measure (M3) known as F-measure (Raghavanet al. 1989), which consists of a weighted harmonic mean of the two.
Two other measures are also considered when answering MQ2 and its sub-questions in relation to the efficiency of the technique under study. Measure M4, concerning the answer toAQ3, includes (see Table 3): (i) the total time spent by ETI on the injection of sentences into the legacy source code; (ii) the time spent on manual pre-intervention by both business experts and systems analysts; and finally (iii) the time spent on dynamic analysis (i.e. the time penalty when the modified source code is executed). Finally, measure M5, related to AQ4, evaluates the time spent on discovering business processes form the event log, which, in this study, is provided byProM, and depends on the algorithm used for discovering them. Both M4andM5 make it possible to answer the second main research question,MQ2.
6.3. Case selection
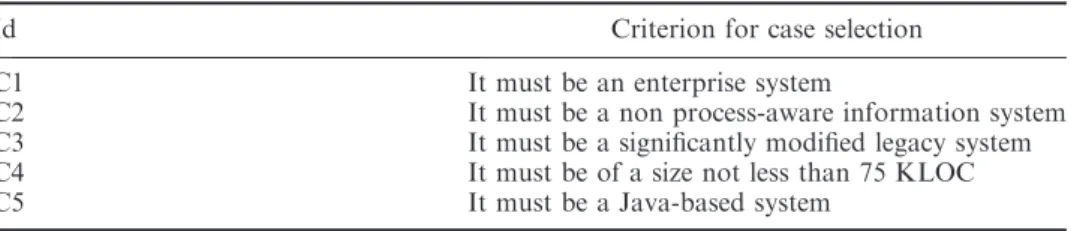
Breretonet al. (2008) state the case under study cannot be randomly selected. The case must be selected according to some criteria so that to ensure the case would provide strengthened conclusions from the execution of the case study. For this reason, the case selection stage defines a criterion list to choose a suitable case for study. Table 4 presents the five criteria established to select the most appropriate information system. C1 is defined to ensure that the system selected is a real-life information system that is currently in the production stage and supports the business operation of an organisation or company. C2 ensures that the system selected is a traditional information system with no built-in logging mechanism.C3 makes it possible to effectively select a LIS that has been significantly modified. Production time is not a suitable measure for checking this criterion, since it has no direct relationship with changes to the system. Instead,C3considers the number of major modifications to the system that transformed the source business processes (i.e. adaptive and perfective maintenance (ISO/IEC 2006)). C4 ensures that the system is large enough to draw representative conclusions, exceeding 75,000 lines of source code. Finally, criterion C5 requires the system to be based on Java technology, since the parser of ETI supporting the technique at this stage is only available for Java-based systems. However, the technique proposed is not specific for
Table 4. Criteria for case selection.
Id Criterion for case selection
C1 It must be an enterprise system
C2 It must be a non process-aware information system
C3 It must be a significantly modified legacy system
C4 It must be of a size not less than 75 KLOC
C5 It must be a Java-based system
Java-based systems, but is based on the concept of callable units, which can also be applied to other programming languages.
After evaluating several available systems according to these criteria (see Table 4), the LIS selected for study was CHES (Computer-based Health Evaluation System)1, a healthcare information system used in several Austrian hospitals in different areas of medicine (e.g. oncology, geriatrics, psychiatry, psychosomatic medicine) for the collection, storage and graphical processing of medical and psychosocial data. In addition, CHES provides graphical real-time feedback of patient-related data to individualise treatment strategies and permits recording individual patient and treatment data (e.g. laboratory values, data from medical interventions, questionnaire data). Data can therefore be analysed in real-time utilising pre-defined reference and cut-off values for determining the appropriate treatment or intervention for a patient. It thus meetsC1. CHEShas no mechanism to register event logs, thus meetingC2.
The first release ofCHESwas moved to the production stage 4 years ago. During that time, the most important maintenance actions in its version history were the following:
. v0.1 was a prototype implemented inVisual Basic
. v1.0 was basically the same system as v0.1, but put on a more solid basis and implemented in Java
. In v2.0 several configuration options were implemented (e.g. customisation of questionnaires, computation of reference values)
. v3.0 involved a complete user interface redesign and added the support for creating reports
. v3.1 extendedCHESwith a new survey application, internationalisation and an update mechanism.
As a result,CHESunderwent three major modifications and a medium-sized, its C3compliance thus being ensured.
The total size ofCHESis 91.3 KLOC, ensuringC4. From a technological point of view, CHES is a Java application meeting C5, and its architecture follows the traditional structure in three layers (Eckerson 1995): (i) thedomainlayer supporting all the business entities and controllers; (ii) thepresentation layer dealing with the user interfaces; and (iii) thepersistency layer handling data access.
6.4. Case study procedure
In addition to the case study design, a procedure was defined to execute the study in a finite set of steps, some of which are partially executed by ETI, the tool developed to support the technique proposed. The steps defined are:
(1) After some meetings between staff from both the candidate organisation and the development team as well as the researchers, the LIS was selected according to the case selection criteria. At this point, the business experts and systems analysts who will provide the information to modify the original source code were appointed. The information provided by them is necessary to perform a later manual verification in order to evaluate measuresM1and M2(see Section 6.2).
(2) The legacy source code was modified by means of ETI, which the systems analysts and researchers used according to the technique proposed (cf. Section 4), playing the roles of business experts, for which purpose they considered the first sketch of the original business processes defined by the real business experts in a meeting at the beginning of the study.
(3) Before obtaining a definitive event log, the instrumented system was executed and a test event log obtained, which was analysed usingProM. The accuracy of the preliminary event log was checked, as it could have had any event fault due to a non-optimal instrumentation of source code during the static analysis stage. The systems analysts were thus able to refine the information previously provided in ETI and iteratively instrument the source code (returning to the second step).
(4) When an optimal instrumentation of the legacy source code was achieved (i.e. when a first sketch of a business process could be accurately obtained after the dynamic analysis stage using the instrumented code), the instrumented LIS was released in an experimental environment. The research team then used the modified application, simulating normal users in the organisation. The execution was led by the underlying execution scenarios derived from the sketch of business processes provided by the business experts. For this case study, the instrumented LIS was executed until the function coveragereached a value greater than 60%.
(5) The event log obtained by applying the technique was analysed withProM, which supports many techniques and algorithms to discover processes from event logs, in order to discover a set of preliminary business processes. This study used the genetic mining algorithm implemented inProM, as it facilitates the discovery of the sequence flow structure. In addition, according to Medeiros et al. (2007) the accuracy of the genetic algorithm makes it the most suitable one. (6) The first sketch of business processes obtained by model transformation was improved by systems analysts and researchers playing the roles of business experts. We fitted the preliminary business processes to the reality of the organisation, i.e. we added tasks that should have been recovered but were not, and removed tasks erroneously recovered. Next we assessed the accuracy of business process models by comparing each preliminary business process with its respective enhanced business process. We obtained the value of the measures proposed such as precision andrecallby scoring the differences between the preliminary and enhanced business processes. Steps 2–6 were iteratively executed until business processes were obtained with an appropriate quality level. (7) All key information related to the generation of the event log (steps 2 and 3), the
business processes discovered (step 4), as well as the business expert intervention (step 5), was collected according to the data collection plan (see Subsection 6.5). The data collected in the previous step were analysed and interpreted to draw conclusions in order to answer the research questions. Subsection 6.6 presents the results obtained in this study. Finally, the case study was reported and feedback is given to the organisation and research community.
6.5. Data collection
Data to be collected and their sources were defined before the case study in order to ensure repeatability, starting with the business experts’ configuration registered in
ETI to instrument the source code. Table 5 shows the last iteration of this information, i.e. the definitive details of the static analysis stage according to the iterative case study procedure (see Steps 2 and 3 in Section 6.4). It also gives the name of the processes selected by business experts together with their start and end activities, the number of domain directories, files and technical filters selected by the systems analysts and, finally, the correlation object, thePatientclassifier, provided by experts.
The information derived from the static analysis, provided by ETI, is also collected, with Table 6 showing the last iteration, giving: (i) the number of source code files inCHES; (ii) the number ofJavasource code files; (iii) the number of Java files modified according to the domain files selected; (iv) the number of sentences injected; and (v) the total time needed to obtain the modified version ofCHES.
After execution of the modified version of CHES, an event log was obtained, a summary of which is shown in Table 7 in its last iteration, provided byProM: (i) the total processes registered; (ii) the number of process instances; (iii) the total number of events; (iv) the number of unique events; (v) the mean of events per process instance; and finally (vi) the function coverage percentage reached.
Table 8 shows the data derived by business process discovery in the last iteration (i.e. information about the business process discovered from the final, stable event log), together with the evaluation ofprecisionandrecallmeasures by business experts (c.f. the final business processes discovered as well as the business experts’ evaluation in Appendix 1). Table 8 shows the following data for each business process:
. The number of tasks recovered (before manual intervention).
. The number of relevant tasks recovered (i.e. the number of tasks that the business experts marked as correct).
Table 5. Business expert information to perform the static analysis stage.
Process Start activity End activity
Patient admission Input data patient Register patient Patient stay management Select patient Save questionnaire Data collection management Select questionnaire Update patient state Data analysis management Check indicators Order treatment
Order intervention Print report Number of Selected domain directories 143
Number of Selected domain files 362
Number of Technical filters 38
Correlation object Patient
Table 6. Static analysis results.
Feature Value
LOC 91266
Number of Java files 822
Number of processed Java files 181
Number of instrumented callable units 336
Static analysis time 803100(511435 ms)
. The number of non-relevant tasks recovered (i.e. tasks removed from the business process as they do not represent a business activity).
. The number of non-recovered relevant tasks (i.e. relevant tasks added by experts to the business processes because they were not recovered).
. Therecallvalues for each final business process. . Theprecisionvalues for each final business process. . The harmonic mean between both measures.
. The fitness value (between 0 and 1) obtained by executing the genetic algorithm inProM, which represents the accuracy level of the transformation from event log to business processes.
. The time spent on discovering business processes with ProM (i.e. the M5 measure).
Finally, Table 9 contains similar information regarding all the previous generations of event logs up to the final one, focusing on the different time values spent on each stage of the proposed technique: (i) manual intervention time; (ii) static analysis time; (iii) dynamic analysis time; (iv) event log obtaining time (i.e. the sum of the three previous values according to M4); and (v) business process discovery time (M5). In addition, Table 9 summarises the remaining measures like (vi) recall,M1; (vii) precision, M2; (viii) F-measure, M3; and finally (ix) the fitness value obtained during the process discovery algorithm.
6.6. Analysis and interpretation
After data collection, data analysis obtained the evidence chains to answer the research questions. Four iterations were carried out until an appropriate event log was obtained, which had a total of 1185 events with an average of seven events per process instance (see Table 7). It comprises four processes in total, related to the four processes at the beginning of the static analysis stage (see Table 5). After this, a business process was discovered usingProM, with 21 recovered tasks, of which 11 were relevant and 10 non-relevant, 7 additional relevant tasks then being added by the business experts (c.f. the final discovered business processes and business experts’ evaluation in Appendix 1).
6.6.1. Effectiveness evaluation
In answer to research questionMQ1, the values of therecallandprecisionmeasures were 0.638 and 0.633, respectively (the average for the four business processes). As a Table 7. Event log analysis.
Feature Value
Number of processes 4
Number of process instances 336
Number of events 1185
Number of events classes 204
Mean of events per instance 3.53
Function coverage 60.7%
Table 8 . Business process model description. Business process model name Number of recovered tasks (RcT) Number of recovered relevant tasks (RcRvT) Number of recovered non-relevant tasks (RcNRvT) Number of non-recovered relevant tasks (NRcRvT) Recall (RcRvT/ RcRvT þ NRcRvT) Precision (RcRvT/ RcRvT þ RcNRvT) F-measure (2 6 P 6 R)/ (P þ R) Fitness value Business process time
(s) Patient admission 5 2 3 3 0.400 0.400 0.400 0.928 46 Data collection management 2 2 0 3 0.400 1.000 0.571 0.975 5 Data analysis management 5 4 1 0 1.000 0.800 0.889 0.928 91 Patient stay management 9 3 6 1 0.750 0.333 0.462 0.886 145 Total 21 11 10 7 – – – – 287 Mean 5.3 2 .8 2.5 1 .8 0.638 0.633 0.635 0.929 72 Standard deviation 2.9 1 .0 2.6 1 .5 0.29 0.32 0.22 0.04 60
Table 9 . T ime and measure values in iterations concerning event log generations. Iteration Manual intervention time (min) Static analysis time (min)
Dynamic analysis time
(min) Event log obtaining time (min) [M4] Throughput time (min) [M5] Recall [M1] Precision [M2] F-measure [M3] Fitness value 19 0 9 ,8 K ! 0 253 71 0.833 0.357 0.500 0.708 23 0 9 ,4 K ! 0 186 19 0.778 0.583 0.667 0.930 31 5 9 ,0 K ! 0 164 7 0 .500 0.600 0.545 0.889 45 8 ,5 K ! 0 147 5 0 .638 0.633 0.635 0.929 Total 140 37 K ! 0 751 102 – – – –
consequence, theF-measurevalue was 0.635. These values obtained for the last iteration were more appropriate than those obtained in previous iterations (see Figure 12).
Figure 12 shows the evolution of all these measures for the previous versions of event logs. In the first iteration the recall andprecision measures were respectively 0.833 and 0.357. On the one hand, a higher recall value means that the proposed method recovers a higher number of relevant business elements. On the other hand, a lower precision value contrasts with a high recall value, which means that a large number of non-relevant tasks have been recovered, non-relevant in most cases because their respective callable units (from which were obtained) do not represent business activities, but, for example, technical source code (e.g. auxiliary methods). In some cases the tasks may have been classified as non-relevant owing to their inappropriate level of granularity (e.g. their business knowledge is already included in other larger relevant tasks).
The precision and recall values obtained for the first iteration were not appropriate. In fact, the first sketch of business processes obtained from the first event log had several mistakes and some deviations from the real-world processes (see Appendix 2). In any event, the results obtained for the first event log were to be expected since there is an inverse relationship betweenprecision andrecallmeasures. Indeed, the precision value should, ideally, always be 1.0 for anyrecallvalue but, according to Davis and Goadrich (2006), this is not possible in practice. Therefore, due to this inverse relationship, it is possible to increase one at the cost of reducing the other. This means that the proposed method could reduce itsrecallvalue by recovering fewer tasks, at the cost of reducing the number of non-relevant tasks recovered, i.e. increasing the precisionvalue. These results were progressively obtained in subsequent iterations (see Figure 12). The above result obtained in the fourth and last iteration was the best, since the recall and precision values were more balanced. Indeed, the F-measure can be considered as a special case of the generalFa-measure(1), whereais 1. Theavalue is
used to weightprecisionin relation torecall, and the selectedF1-measure(M3in Table 3)
thus signifies that bothprecisionandrecallare equally important. In this study, theF1
-measurehad an average value of 0.63.
Fa¼
1þa
ð Þ PRECISIONRECALL
aPRECISIONþRECALL ð1Þ
In order to answerAQ1andAQ2, and thereforeMQ1, the values obtained were additionally compared with reference values from other experiments with model recovery in the literature (Ye and Fischer 2002, Garciaet al. 2006, Lucre´dioet al. 2008). We found reports ofrecallandprecisionvalues close to 60%, our benchmark values. The values obtained for our measures (precision¼64%, recall¼63% and F1-measure¼63%) were therefore above the reference value. Thereby,
sub-questionsAQ1andAQ2could be answered positively, andMQ1(see Table 2) was evaluated as true, i.e. the technique proposed could obtain event logs from legacy information systems to effectively mine business processes.
6.6.2. Efficiency evaluation
In order to answerMQ2, sub-questionsAQ3andAQ4had also to be answered. The time spent obtaining the event log (measure M4) consisted of the manual intervention time, static analysis time and dynamic analysis time. Firstly,T{Manual