CARBONATE AND ZEOLITIC SORBENTS IN CO
2CAPTURE
Magdalena Wdowin1,*, Wojciech Franus2, and Rafał Panek31Mineral and Energy Economy Research Institute of the Polish Academy of Sciences, Wybickiego 7, 31-261 Kraków, Poland 2,3Lublin University of Technology, Nadbystrzycka 40, 20-618, Lublin, Poland
ABSTRACT
This paper presents evaluations of carbonate and zeo-litic materials usefulness from point of view application of them as carbon dioxide sorbents. For all selected mate-rials mineralogical examinations (XRD, SEM analysis and observation in transmitted light) were conducted. Also tex-tural characteristics (the BET surface area, mean pore diame-ter, pore size distribution and volume of pores) were car-ried out. An essential research has constituted CO2
adsorp-tion. CO2 adsorption tests revealed that carbonate rocks have
poor adsorption properties, their sorption capacity does not exceed 0.1 mmol/g. Therefore, they should be examined from the viewpoint of their application in mineral carbona-tion. However zeolites shown much better CO2 adsorption
parameters, thus, they can be subjected to further examina-tions (modification/activation) in order to determine selec-tive and dynamic adsorption of CO2.
KEYWORDS:CO2 adsorption; Carbonate rocks; Synthetic zeo-lites; Sorbents; CO2 capture
1 INTRODUCTION
The environmental impact of anthropogenic CO2
emis-sions is regarded as the major risk to mankind, because its emissions into the atmosphere have been reported to ac-count for half of the greenhouse effect which causes the global warming [1]. Over the past century its concentration in the atmosphere has increase significantly. The atmos-pheric level of CO2 is rising at about 1.6 ppm per year
while worldwide CO2 emissions from fossil fuels
com-bustion would amount to an increase of almost 3 ppm annually [2]. Therefore, reduction of CO2 emission will
be the greatest industrial challenge of the 21st century [3].
There are exist three options to reduce total emission of CO2 into the atmosphere e.i.: 1) reduction of energy
in-tensity, 2) reduction of carbon inin-tensity, 3) enhancing of CO2 sequestration. The first option requires efficient usage
* Corresponding author
of energy. The second, requires switching to using non-fossil fuels such as hydrogen and renewable energy. The third, involves the development of technologies to CO2
capture and storage. It is believed that carbon capture and storage (CCS) technology is one of the obvious priority candidates for long term technology policies and enhanced R&D efforts to protect human against the risks associated with high environmental impacts of climate changes even widespread deployment of CCS requires decades to come. Since the CO2 separation/capture method is the first
and most energy intensive step of CCS processes, many researches have targeted at improving the current tech-nologies or developing new approaches of CO2 separation
and capture [4]. Many materials as sorbents of CO2 are
tested. These include natural and synthetic zeolites [5-8] (so far used in heavy metals [9] and ammonia ions re-moval from water solutions [10] or generally as acid gases sorbents [11]), limestones [3], opokas, glauconites [2, 7, 12], amines [4], activated carbons [13] (so far used in many applications i.e. for purification of water, air, and many chemicals etc. [14]). But, each materials need a different methods of modification or activation of them in order to received better CO2 sorption properties.
2 MATERIALS AND METHODS
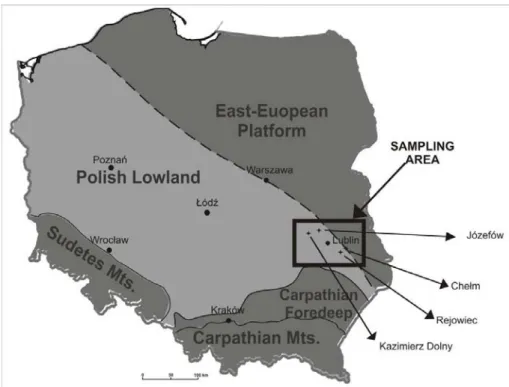
The main aim of this study was examination of car-bonate materials occurring on Lublin vicinity and Roz-tocze in Poland (Fig. 1.) and synthetic zeolites (mixture of Na-P1 with Na-X and Linde-A, and mixture of Na-P1 with Linde-A) as potential carbon dioxide sorbents.
The carbonate research materials have constituted the following rocks: silica-carbonate rocks (opokas) from Kazimierz Dolny area, carbonate-silica rocks (detritic sandy limestone) from Józefów area, chalks from Chełm area and peelite marlstones form Rejowiec area.
The zeolite material was a product of hydrothermal reac-tion of fly ash with NaOH water solureac-tion [15, 16]. It was obtained a mixture of three types of zeolites, in which dominates the zeolite Na-P1 accompanied by Linde-A zeo-lite and Na-X (Z-4 sample), and Na-P1 accompanied only by Linde-A (Z-5 sample). For Z-4 zeolitic mixture the
FIGURE 1 - Location map of carbonate rocks sampling area
following conditions were applied: 21 kg of fly ash, 12 kg of NaOH, 90 dm3 of water, temperature 75°C and time of
reaction 36 h, whereas for Z-5 zeolitic mixture only time of reaction was different - 24h rest of established parame-ter were the same.
For all tested materials mineralogical examinations such as XRD, SEM analysis and observation in transmitted light were conducted. Also textural characteristics were carried out. The BET surface area, mean pore diameter BJH, pore size distribution (PSD) and volume, average particle size, mean width of pores for each sample were determine.
An essential research has constituted CO2 adsorption
test at static condition with 750 mmHg pressure, that al-lowed to determine the usefulness of selected materials to application of them as CO2 sorbents.
The chemical composition of carbonate rocks was de-termined using X-ray fluorescence spectrometer for wave-length-dispersive WD XRF. Induction source was a X-ray lamp with a dual Cr-Au anode about a maximum power of 3 kW.
Microscopic observations in transmitted light were carried out using an optical microscope Olympus BX60 equipped with camera, using zooms: 5x, 10x, 20x.
Observations of the mineral composition and examined samples surface (morphology) were made in FEI Qanta 250 FEG scanning microscope additionally equipped with a chemical composition analysis system (used for zeolitic materials) based on energy dispersion scattering – the EDS EDAX.
XRD analysis of the rocks and zeolitic materials were performed using a Philips X’pert APD diffractometer with the PW 3020 goniometer, Cu lamp, and graphite mono-chromator. The analysis was performed within the angle range of 5-40 2θ.
Textural investigations of the specific surface areas and the associated pore size distribution were performed using Micromeritics ASAP 2020 analyser at temperature of 77°K. The samples before analysis were degassed at low pressure and temperature of 373.15°K during 6 hours period of time. After that, for each sample, cold and warm free spaces using helium were measured. Equilibration interval was 30 seconds. Weight of each samples ranged from 2.4 g to 2.9 g. Saturation pressure p0 were calculated from
tempera-ture values enclosed in database of the analyser.
The main textural parameters (surface area, volume of pores, pore size distribution and average pore diameter) were evaluated by the following calculating methods: Lang-muir model, BET equation, single point method surface area, BJH adsorption/desorption.
The values of the BET surface area and pore size dis-tribution parameters were determined on the basis of the shape of adsorption/desorption isotherms of nitrogen va-pour at 77°K. The BET surface area was calculated using Brunauer-Emmett-Teller’s multilayer adsorption theory [17] at p/p0 between 0.06 and 0.3 (p - equilibrium pressure, p0 -
saturation pressure).
Volumes of pores were determined from the volume of adsorbed nitrogen at the pressure of p/p0 = 0.98. Pore
CO2 sorption measurements were made using an
ana-lyser for precise measurements of physical sorption and chemisorption, equipped with additional device to vapor sorption, and mass spectrometer - AUTOSORB-1-C (Quan-tachrome Instruments, USA). Before the measurements samples were rinsed with helium and calcinated at 373.15°K for 4 h. The scope of works included the appointment of CO2 adsorption isotherms in temperature 273°K.
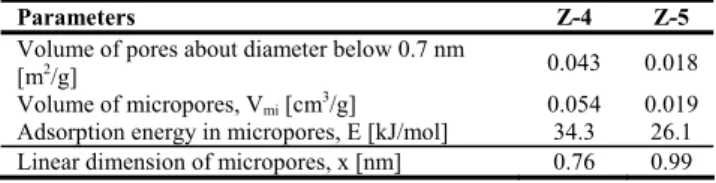
For zeolitic samples, from adsorption isotherm of car-bon dioxide, following parameters were determined: vol-ume of pores with a diameter less than 0.7 nm, micropores volume, adsorption energy in micropores and the linear dimension of the micropores. The volume of pores with a diameter less than 0.7 nm was calculated from the points of adsorption isotherm for the relative pressure p/p0 > 0.029.
Parameters of microporous structure (pores with a diameter up to 2 nm) were determined according to the Dubinin-Radushkevich methodology [18]. These parameters were calculated according to the following standards: NIST 2006, ISO 9277:2010 (E), ISO 15901-3:2007 (E) [19-21].
3 RESULTS AND DISCUSSION
3.1. Chemical composition
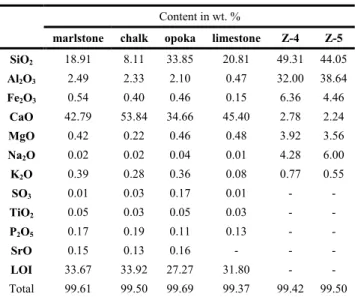
The chemical composition of carbonate rocks is domi-nated by calcium oxide (associated with calcite), the largest amount of it was found in chalks (above 50 % wt.), while the opoka includes the smallest amount (less than 35 % wt.). In significant quantities there is also silica, with the biggest amount occured in opoka (almost 34 % wt.), slightly smaller amounts were found in limestone and marlstone (within 20 % wt.). The smallest number was observed in the chalk rocks. The content of aluminum oxide in the carbonate samples ranges from 2 - 2.5 % wt. with the exception of sandy-limestone from Józefów area (0.45 % wt.). Other ingredients such as MgO, Na2O, K2O, SO3,
TiO2, P2O5, SrO are present in much smaller quantities
(Table 1). For each sample there is a relatively large per-centage of loss on ignition (LOI) (~ 30 % wt.).
The chemical composition of zeolite samples (SEM-EDS, Table 1) is dominated by SiO2 which content is in
the range from 44.05 to 49.31 % wt., and Al2O3 (32.00 -
38.64 % wt.). Average content of iron oxide is about 5 % wt. Among the alkaline elements there dominates sodium (4.28 -6.00 % wt. of Na2O), and potassium (0.55 - 0.77 %
wt. of K2O), while elements of alkaline earths are from
5.8 to 6.7 % wt. in which there is a slightly larger share of magnesium.
3.2. Mineralogical characteristics of tested materials
Observations in transmitted light showed that the min-eral composition of carbonate rocks is dominated by cal-cite. In each sample is also observed quartz and CT opal
remains were noticed in carbonate rocks (very large quan-tities are present in the detritic limestone from Józefów area and in chalk rocks).
TABLE 1 - Chemical composition of tested materials
Content in wt. %
marlstone chalk opoka limestone Z-4 Z-5 SiO2 18.91 8.11 33.85 20.81 49.31 44.05 Al2O3 2.49 2.33 2.10 0.47 32.00 38.64 Fe2O3 0.54 0.40 0.46 0.15 6.36 4.46 CaO 42.79 53.84 34.66 45.40 2.78 2.24 MgO 0.42 0.22 0.46 0.48 3.92 3.56 Na2O 0.02 0.02 0.04 0.01 4.28 6.00 K2O 0.39 0.28 0.36 0.08 0.77 0.55 SO3 0.01 0.03 0.17 0.01 - - TiO2 0.05 0.03 0.05 0.03 - - P2O5 0.17 0.19 0.11 0.13 - - SrO 0.15 0.13 0.16 - - - LOI 33.67 33.92 27.27 31.80 - - Total 99.61 99.50 99.69 99.37 99.42 99.50
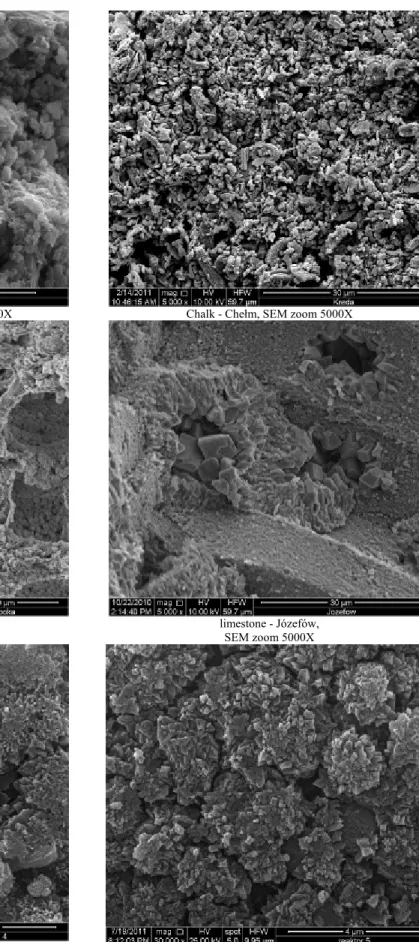
Microstructure of examined carbonate rocks (Fig. 2.) observed using scanning microscopy showed a very fine-grained nature of the tested materials and especially for the chalk and marlstone. Examined rocks are character-ised by a high level of porosity. The microscopic images reveal their organic origin (chalk) and explicit participa-tion of organisms in the process of these rocks formaparticipa-tion (opoka, limestone).
Zeolitic materials are finer grained than carbonate rocks. Aggregation of these minerals rarely exceed the size of 2 µm and individual crystals, most often lamellar, sometimes needle-like, far less rarely isometric, reach the size of 0.X µm.
The mineral composition of carbonated rocks is shown in the Fig. 3. The main mineral component is cal-cite, that amount riches 92 % wt. in chalk rocks. Signifi-cant quantitative part have silica minerals such as CT opal especially occurring in opoka and marlstone. Besides it were observed clay minerals from smectitie and illite group (in marlstones and opokas) and quartz (in each rock sam-ples).
The mineral composition of the zeolite samples is shown in Fig. 4. In the composition of both zeolite sam-ples the dominant zeolite phase is Na-P1 which in the sample Z-4 is accompanied by zeolite of the faujasite group (Na-X) and Linde-A type zeolite. And in Z-5 sample be-sides Na-P1 phase there occurs only Linde-A phase. The mineral composition is supplemented in both cases by the residue after the synthesis reaction which is a mixture of mullite, quartz, the remnants of aluminosilicate glass, and recristalized calcite.
Marlstone – Rejowiec, SEM zoom 10000X Chalk - Chełm, SEM zoom 5000X
Opoka – Kazimierz Dolny,
SEM zoom 5000X limestone - Józefów, SEM zoom 5000X
Z-4 - mixture of Na-P1/Na-X/Linde-A,
SEM zoom 30000X Z-5 - mixture of Na-P1/Linde-A, SEM zoom 30000X
FIGURE 3 - X-ray diffraction patterns of carbonate rocks
FIGURE 4 - X-ray diffraction patterns of zeolitic materials
3.3. Textural parameter
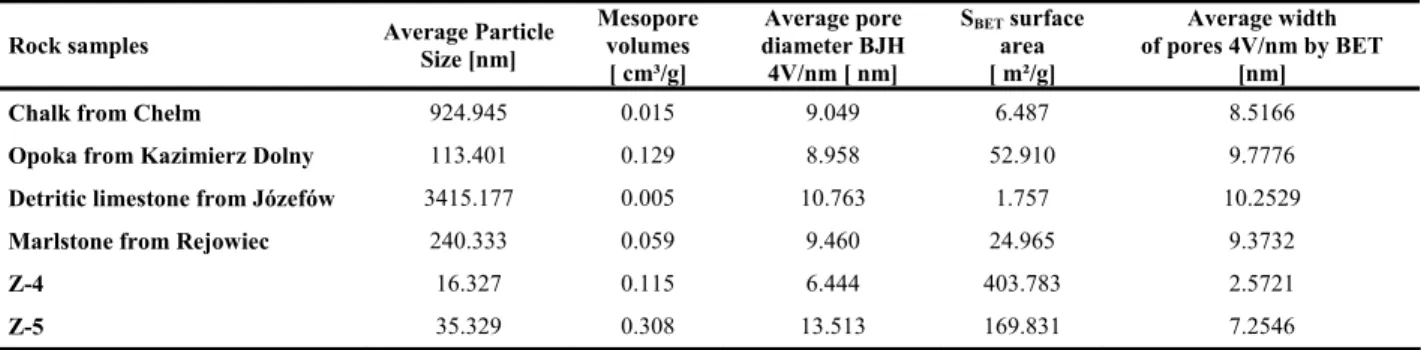
Determined textural parameters are presented in Ta-ble 2. The differentiation of average particle size is clearly visible and these values for carbonate rocks are much higher in comparison with synthetic zeolite materials (from 113.401 nm for the opoka to 3415.177 nm for detritic lime-stone from the Józefów area). For zeolites, these values amounted 16.327 nm for Z-4, and 35.329 nm for Z-5, re-spectively. For an average pore diameter these values are
Determining the average pore width for carbonate rocks, due to the fact that the difference between the average pore size value and the examined parameter is small, it can be concluded that spherical shape of the pores is characteristic for these rocks. Differences between these parameters for zeolites are much higher, suggesting the elongated/oval shape of the pores. The values of the volume of mesopores (pore size 2-50 nm) for the carbonate rocks are very small which indicates a macroporous nature of the rocks. The exception is the opoka (0.129 cm3/g), where this value
is similar to values obtained for zeolitic sample Z-4 (0.114 cm3/g). The volume of mesopores for the Z-5 is
twice as high in comparison to Z-4.
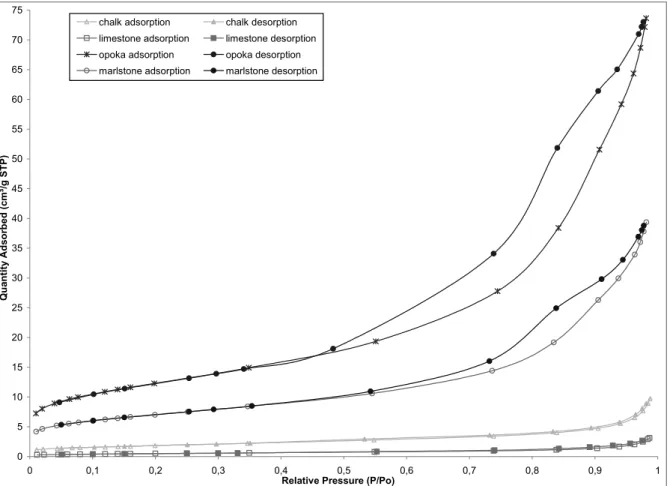
Isotherms of nitrogen adsorption/desorption were also plotted for the examined carbonate materials (Fig. 5). Analy-sis of isotherms for carbonate rocks show that these rocks are characterized by Type IV isotherms according to IU-PAC [22] classification (International Union of Pure and Applied Chemistry), indicating the meso/microporous nature of the rocks, while the hysteresis loops can be catego-rized as Type H2/H3 that confirms the blind spherical and ink bottle shape of pores [23]. Pore size distribution for the carbonate rocks was determined in the range from 1.7 to 300 nm (Fig. 6). It is clearly visible that for opoka and marlstone observed variation in pore diameter varies from 2 - 40 nm, with a predominant pore diameter of 10 - 15 nm for opoka while for marlstone dominate the pores with a diameter of 2 - 12 nm. Pore distribution for opoka is homo-geneous while it is bimodal for marlstone. For chalk and limestone very little variation in pore diameter from 2 -5 nm was observed. However, for chalk dominate pores with 4 nm in diameter and for limestone with 2 nm in diameter. In both cases, the pore distribution is homogeneous.
The isotherms analysis for the examined zeolitic mate-rials (Fig. 7) revealed that, as in the case of carbonate rocks, zeolites are characterized by Type IV isotherms according to IUPAC classification indicating a meso/microporous nature of the rocks, while the hysteresis loops represent the Type H2/H3 which indicates a spherical shapes of pores (blind spherical and ink bottle shapes of pores) [23]. TABLE 2 - Textural parameters of tested materials
Rock samples Average Particle Size [nm]
Mesopore volumes [ cm³/g] Average pore diameter BJH 4V/nm [ nm] SBET surface area [ m²/g] Average width of pores 4V/nm by BET [nm]
Chalk from Chełm 924.945 0.015 9.049 6.487 8.5166
Opoka from Kazimierz Dolny 113.401 0.129 8.958 52.910 9.7776
Detritic limestone from Józefów 3415.177 0.005 10.763 1.757 10.2529
Marlstone from Rejowiec 240.333 0.059 9.460 24.965 9.3732
Z-4 16.327 0.115 6.444 403.783 2.5721
0 5 10 15 20 25 30 35 40 45 50 55 60 65 70 75 0 0,1 0,2 0,3 0,4 0,5 0,6 0,7 0,8 0,9 1
Relative Pressure (P/Po)
Qua n ti ty Ads o rb ed (c m ³/ g S T P )
chalk adsorption chalk desorption limestone adsorption limestone desorption opoka adsorption opoka desorption marlstone adsorption marlstone desorption
FIGURE 5 - N2 sorption/desorption isotherms of carbonate rocks
0 0,001 0,002 0,003 0,004 0,005 0,006 0,007 0,008 0,009 0 10 20 30 40 50 60 70 80 90 100 110 120 130 Pore Diameter (nm) P o re Vo lu me (cm³ /g ·n m )
chalk limestone opoka marlstone
0 10 20 30 40 50 60 70 80 90 100 110 120 130 140 150 0 0,1 0,2 0,3 0,4 0,5 0,6 0,7 0,8 0,9 1
Relative Pressure (P/Po)
Q u an ti ty Ad so rb ed ( cm ³/ g S T P )
FIGURE 7 - N2 sorption/desorption isotherms of zeolites
0 0,02 0,04 0,06 0,08 0,1 0,12 0,14 0,16 0,18 0,2 0 10 20 30 40 50 60 70 80 90 100 110 Pore Diameter (nm) P o re V olu m e ( cm ³/g· nm ) Z-4 Z-5
The variability of the pores in the PSD (pore size dis-tribution, Fig. 8) is observed in the range from 4 - 50 nm for Z-4 and from 2 - 20 nm for Z-4. For Z-4 dominant are pores with a diameter of 4.5 nm, while for Z-5 with a di-ameter of 2.5 nm. The distribution of pores in both cases is bimodal.
3.4. CO2 adsorption
The CO2 sorption experiments carried out on
carbon-ate rocks showed that the carboncarbon-ate rocks adsorbs negli-gible amount of CO2 therefore it was impossible to
calcu-late pore structure parameters. Chalk and limestone show isotherms layout characteristic for Henry's isotherms, while the sorption isotherms for the opoka, marlstone and zeolite samples are similar to Langmuir isotherm.
TABLE 3 - CO2 sorption capacity of tested materials
Rock samples
Sorption capacity at pressure of 750 mmHg,
[mmol/g]
Chalk from Chełm 0.0281
Opoka from Kazimierz Dolny 0.0990 Detritic limestone from Józefów 0.0161 Marlstonefrom Rejowiec 0.0737
Z-4 0.9117 Z-5 0.3915
Sorption capacity (Table 3) for carbonate rocks ranges from 0.0216 mmol/g for samples of chalk to 0.0990 mmol/g for the opoka rocks. Zeolites however showed signifi-cantly bigger sorption capacity 0.3915 mmol/g for Z-5, and 0.9117 mmol/g for Z-4, respectively.
Better sorption capacity for zeolitic samples allowed to calculate following parameters from the isotherms of car-bon dioxide adsorption: volume of pores with a diameter < 0.7 nm, micropore volume, adsorption energy in micro-pores and determination of micromicro-pores' linear dimension, x. The results are compared in Table 4.
TABLE 4 - Textural parameters of zeolitic materials calculated
from CO2 isotherms adsorption
Parameters Z-4 Z-5
Volume of pores about diameter below 0.7 nm
[m2/g] 0.043 0.018
Volume of micropores, Vmi [cm3/g] 0.054 0.019
Adsorption energy in micropores, E [kJ/mol] 34.3 26.1 Linear dimension of micropores, x [nm] 0.76 0.99
4 CONCLUSIONS
Performed tests were aimed at determining the suit-ability of two types of materials (carbonates and zeolites) to use them in CO2 capture technologies. These tests
consti-tuted only preliminary research in order to select appropri-ate further examination method for each tested mappropri-aterials. Due to the fact that the tested materials (carbonates and zeolites), significantly differ from each other, both in terms of chemical composition and mineral structure of the pore
and textural properties, disparate results of adsorption of CO2 were achieved.
Carbonate rocks contain mainly CaO in their chemi-cal composition and thus chemi-calcite dominates in their min-eral composition. While zeolites are mainly built by sili-cates, which are suitable zeolitic phases, and therefore SiO2
and Al2O3 dominate in their chemical composition. For
carbonate rocks i.e. chalk or limestone results showed a very low specific surface area of a few m2/g. Higher values
were obtained for opoka and marlstone, respectively 24 m2/g and 53 m2/g which is probably associated with the
presence of clay minerals in their mineral composition. Zeolites however have a much higher the BET specific surface area of Z-4 - 403.7 m2/g and Z-5 - 169.8 m2/g.
Zeolites also have a much smaller particle size where average values are more than ten times as much lower than the values obtained for carbonate rocks.
CO2 adsorption tests revealed that carbonate rocks have
poor adsorption properties, their sorption capacity does not exceed 0.1 mmol/g. Therefore, they should be examined from the viewpoint of their application in mineral carbona-tion to neutralizacarbona-tion of CO2 but only after calcining them
into CaO and then using them to carbon dioxide capture [8]. However zeolites shown much better CO2 adsorption
pa-rameters (their sorption capacity is 0.9 mmol/g for Z-4 and 0.4 mmol/g for Z-5, respectively), thus, they can be sub-jected to further examinations (modification/activation) in order to determine selective and dynamic adsorption of CO2 [8, 24, 25].
Therefore, testing materials so different from each other indicate that, depending on whether they will be used car-bonate rocks or synthetic zeolites, a different method of neutralization of CO2 should be applied. For carbonate
rocks it should be utilization method, i.e. mineral carbona-tion, while zeolites could be used in adsorption methods in order to separate carbon dioxide.
In further consideration the thermal and IR (infrared) analysis will be conducted. Also for carbonate rocks the test of mineral carbonation is planned. However for zeoli-tic samples modification of their surface properties using amine solutions (MEA or IPA) will be carried out in order to improve their adsorption properties.
ACKNOWLEDGMENT
This work was financed within the frameworks of re-search and development projects No R14 0013 06 and No N523 424837
The authors declare no conflict of interest
REFERENCES
[1] Houghton, J. T. (1995) Climate change 1995: The science of climate change. Cambridge University Press Publications, Cambridge.
[3] Fang, F., Li Z-S. and Cai, N-S. (2009) CO2 capture from flue
gases using a fluidized bed reactor with limestone. Korean Journal of Chemical Engineering 26 (5), 1414-1421. [4] Yang, H., Xu, Z., Fan, M., Gupta, R., Slimane, R.B., Bland,
A.E. and Wright, I. (2008) Progress in carbon dioxide separa-tion and capture: A review. Journal of Environmental Sci-ences20, 14-27.
[5] Sirivardane, R. V., Shen, M.-S., Fisher, E. P. and Poston, J. A. (2001) Adsorption of CO2 on molecular sieves and
acti-vated carbon. Energy and Fuels 15, 279–284.
[6] Acley, M. W., Rege, S. U. and Sexena, H. (2003) Applica-tion of natural zeolites in the purificaApplica-tion and separaApplica-tion of gases. Microporous Mesoporous Materials 61, 25–42. [7] Xu, X., Song, Ch., Andrésen, J. M., Miller, B. G. and
Scaroni, A. W. (2003) Prepared and characterization of novel “molecular basket” adsorbent based on polymer-modified mesoporous molecular sieve MCM-4., Microporous and Mesoporous Materials 62, 29-45.
[8] Walton, K. S., Abney, M.B. and Douglas, L.M. (2006) CO2
adsorption in Y and X zeolites modified by alkali metal cation Exchange. Microporous and Mesoporous Materials 91, 78–84.
[9] Erdem, E., Karapinar, N. and Donat, R. (2004) The removal of heavy metal cations by natural zeolites. Journal of Colloid and Interface Science 280, 309–314.
[10] Franus, W. and Wdowin, M. (2010) Removal of ammonium ions by natural and synthetic zeolites, Mineral Resources Management 4, 133–148.
[11] Sirivardane, R.V.; Shen, M.-S. and Fisher, E.P. (2003) Ad-sorption of CO2, N2 i O2 on Natural Zeolite., Energy and
Fu-els 17, 571–576.
[12] Fernandez-Bastero, S., Gil-Lozano, C., Briones, M. J. I., and Gago-Duport L. (2008) Kinetic and structural constraints during glauconite dissolution: implications for mineral dis-posal of CO2. Mineralogical Magazine 72 (1), 27-31.
[13] An, H., Feng, B. and Su, S. (2011) CO2 capture by
electro-thermal swing adsorption with activated carbon fibre materi-als. International Journal of Greenhouse Gas Control 5 (2011), 16-25.
[14] Hassler, J. W. (1963) Purification with Activated Carbon. 2nd
end (Chemical Publishing Co Inc., New York).
[15] Derkowski, A., Franus, W., Beran, E. and Czímerová, A. (2006) Properties and potential applications of zeolitic mate-rials produced from fly ash using simple method of synthesis. Powder Technology 166/1, 47–54.
[16] Derkowski, A., Franus, W., Waniak-Nowicka, H. and Czímerová, A. (2007) Textural properties vs. CEC and EGME retention of Na–X zeolite prepared from fly ash at room temperature. International Journal of Mineral Process-ing 82, 57–68.
[17] Gregg, S. J. and Sing, K. S. W. (1982) Adsorption, Surface Area and Porosity. 2nd edition. Academic Press. London.
[18] Dubinin, M. M., Zaverina, E. D. and Radushkevich, L. V. (1947) Sorption and structure of activated carbon. I Adsorp-tion of organic vapors. Zhurnal Fizicheskoi Khimii 21, 1351– 1362.
of solid by gas adsorption – BET method.
[21] NIST 2006, Porosity and Specific Surface Area Measure-ments for Solid Materials.
[22] IUPAC (1972) Manual of Symbol and Terminology for Physicochemical Quantities and Units. Appendix II. Defini-tions, Terminology and Symbols in Colloid and Surface Chemistry. Part 1. Pure Appl. Chem. 31 (4), 579-638. [23] Klinik, J. (2000) Tekstura porowatych ciał stałych/ texture of
porosity solids. AGH – Ośrodek Edukacji Niestacjonarnej, Kraków.
[24] Chatti, R., Bansiwal, K., Thote, J. A., Kumar, V., Jadhav, P., Lokhande, S. K., Biniwale, R. B., Labhsetwar, N. K. and Rayalu, S. S. (2009) Amine loaded for carbon dioxide cap-ture: Amine loading and adsorption studies. Microporous Mesoporous Materials 121, pp. 84–89.
[25] Singh, R., Reddy, M. K. R., Wilson, S., Joshi, K., Diniz da Costa, J. C. and Webley P. (2009) High temperature materi-als for CO2 capture. Energy Procedia 1, 623–630.
Received: April 17, 2012
Revised: June 05, 2012
Accepted: June 11, 2012
CORRESPONDING AUTHOR Magdalena Wdowin
Mineral and Energy Economy Research Institute of the Polish Academy of Science
Wybickiego 7 31-261 Kraków POLAND
Phone: +48 12 632 33 00 ext. 157 Fax: +48 12 632 35 24
E-mail: [email protected]; [email protected]