WORLD WIND JAVA
for
MODIS FIRE PRODUCTS VISUALIZATION
(WWJF)
User Manual, v 1.0, April 2011
Luigi Boschetti, Alexandra Moulden and Michael Humber
Department of Geography, University of Maryland, College Park, MD 20740
World Wind is a three dimensional geographic information system developed by NASA
Ames Research Centre that is installed on a user’s personal computer (Hogan and Coughlan
2006, WWW1). Unlike similar virtual globe software, such as Google Earth or Microsoft
Virtual Earth, World Wind was developed and distributed from the beginning under an Open
Source Agreement (WWW2) to enable users to study, change, improve and redistribute the
code and to develop add-on components and customized data layers. World Wind was
initially developed as a .NET application for Windows platforms; recently a Java-based
World Wind Software Development Kit was released to allow platform-independent World
Wind applications (WWW3). The World Wind Java Fire application available on the
MODIS fire website is based on the Java Development Kit.
Available Fire Products
MODIS Burned Area product
The MODIS burned area product (MCD45A1) is distributed as a monthly 500m product
reporting the approximate day of burning between eight days before and after the calendar
month period. As a consequence, there is always a 16 day overlap period between
consecutive months in which the same burn can be detected on the same day, or, because of
algorithm sensitivity to the frequency and occurrence of missing observations, on slightly
different days. For display in World Wind, we generated a temporally filtered version of the
monthly product that uses the MCD45A1 quality and processing path information to allocate
burns in the overlap period to the most likely calendar month in order to preclude potential
double-counting of burned areas when consecutive months are considered.
MODIS Active Fire product
The MODIS active fire product detects fires in 1km pixels that are burning at the time of
overpass under relatively cloud-free conditions (Giglio et al. 2003, Giglio 2007). The 1km
daily MODIS active fire product reports the occurrence of active fires detected over a 24
hour period as sampled during the 4 Terra and Aqua overpasses (MOD14A1 and MYD14A1
for MODIS Terra and MODIS Aqua) and the detection confidence (high, medium or low)
(Giglio et al., 2003). If no detections occurred then the surface state (land, water, unknown,
snow or cloud) is recorded. In this study, low confidence active fire detections are not
considered in order to reduce potential active fire commission errors. To investigate the
impact of this, the total number of 1km active fires detected globally is quantified
considering all active fire detections regardless of their confidence (high, medium and low
confidence) and considering only the high and medium confidence detections.
These data
were aggregated into monthly composites that define the location of 1km pixels with an
active fire detection in that month, or if no detection, then the percentage of the days with
cloud or snow or missing data, and a code indicating if the pixel was water or unknown
surface status. As Aqua was launched in 2002, for the 2000-2002 we display only MODIS
Terra detections (idendified as MOD14) and for 2002-present we combine Aqua and Terra
detections (this combined product is identified as MCD14).
World Wind Fire Layer Generation
The MODIS product cannot be simply loaded into World Wind: to provide World Wind compatible imagery the i) The monthly burned area product tiles are reprojected from the Sinusoidal projection to the Plate Carreé projection, maintaining the original 500m spatial resolution and mosaicing the different tiles together to produce a single global mosaic HDF file. This task is performed using the Modis Reprojection Tool (WWW6).
ii) The monthly global mosaic file is generalized at different spatial resolutions. Custom C code to compute the median day of burning and the mode of the non-burning values (fill, water, snow, no-burning) in an arbitrary sized window is used. Each window is assigned the median day of burning, and if no burning occurs then it is assigned the mode non-burning value. In this way the burned areas remain visible even at the smallest scales (zoomed out far from Earth), and at larger scales (zoomed in close to Earth) their correct areal proportions are evident. Five levels of generalization are sufficient to support visually smooth World Wind zooming from the coarsest World Wind resolution to the original 500m MODIS resolution: 0.07°, 0.035°, 0.0175°, 0.008775° and 0.0043875°.
iii) The five generalized global mosaic HDF files are converted to PNG images with fixed contrast stretching and colour look-up tables using specific tools developed to support MODIS land quality assessment. A rainbow colour scale describing the approximate day of burning and non-rainbow colours for non-burning days is used.
iv) The PNG files are converted to World Wind format by dividing each into 512x 512 pixel tiles using ImageMagick (WWW7). An accompanying XML file describing the geographic corner coordinates, the number of levels of generalisation, and the tile dimensions at the coarsest spatial resolution is generated by a shell script.
The World Wind compatible PNG browse images are then moved to the WMS server, and can be visualised from the MODIS Fire web site (WWW4). These imagery are made available on a systematic basis as the monthly burned area product and active fire products are generated.
How to Launch WWJF
a. Go to the website
b. Go to section 1.1 NASA World Wind Virtual Globe under section 1. Visualize the data c. Click on the image of the Earth that says “Click to Launch MODIS Burned Area World
Wind Java Application”
d. Depending on your browser, you might be asked to confirn that you want to install / run the JavaWorld Wind application:
• Mozilla Firefox
1. Clicking on the image will open a window that says “Opening wwmodisfire.jnlp” 2. Click on either Open with Java™ Web Start Launcher, to just start the program in your computer or Save File, saves the jnlp to your computer’s download location, then click Ok
3. A window appears that says it is downloading the program
4. A window will open that titled “Warnings-Security” that says “The application’s digital signature cannot be verified. Do you want to run this application?”, click Run
5. A small globe icon may appear on your screen
6. Then two windows, MODIS Burned Area and Active Fire and MODIS Burned Area and Active Fire Layers, will open
• Internet Explorer
1. An Internet Explorer Security window will open, click Allow 2. A small globe may appear on your screen
3. Then two windows, MODIS Burned Area and Active Fire and MODIS Burned Area and Active Fire Layers, will open
• Google Chrome
1. At the bottom of the Google Chrome window it will ask “This type of file can harm your computer. Are you sure you want to download wwmodisfire.jnlp?” click Save, this will save it to your computer’s download location
2. A small rectangular box will appear at the bottom that says wwmodisfire.jnlp, click on this box, or click the drop down arrow and click open
3. A small globe may appear
4. Then two windows, MODIS Burned Area and Active Fire and MODIS Burned Area and Active Fire Layers, will open
The WWJF interface
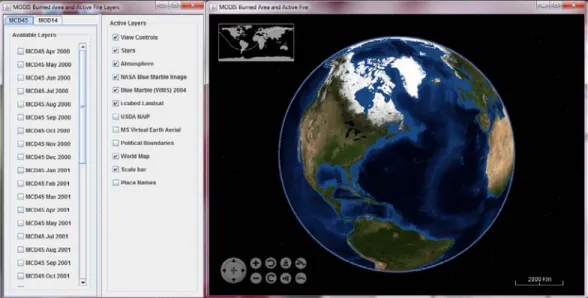
WWJF has three windows: the main WW view window and an interactive window that allows the selection of the active layers (figure 1). These windows can be moved, minimized and maximized on the screen independently.
Figure 1: the main World Wind view window (on the right) and the interactive "MODIS Burned Area and Active Fire Layers" window (on the left)
The initial World Wind view displays global MODIS surface reflectance data (Stöckli et al.,
2006) projected onto a three dimensional Earth; zooming in to larger scale, these data are
replaced by Landsat ETM+ data draped over a digital terrain model derived from the Shuttle
Radar Topography Mission. The graphical rendering is undertaken efficiently in Java.
Available spatially explicit data sets may be overlain as different layers according to user
selections. The data to be visualized must be defined at different spatial resolutions and/or
levels of generalization format. This is facilitated by a pyramid data structure defined in the
Plate Carrée projection. At the coarsest level, the Earth’s surface is described by 36
˚x36˚
square tiles of 512x512 pixels (0.07
˚ pixels). At progressively larger scales, the pixel size
decreases by a factor of two and the number of pixels per-tile remains constant; the second
coarsest level is composed of 18
˚x18˚ tiles (0.035˚ pixels), the third of 9˚x9˚ tiles (0.0175˚
pixels) and so on, until the native data resolution is reached. MODIS burned areas are
displayed up to the native resolution of 500m, and active fires up to the native resolution of
1km. World Wind software is capable of reading files in a variety of image formats, but each
dataset must be complemented by an Extensible Markup Language (XML) file containing
descriptive geographic metadata.
The loadable layers window has three menus with layers; MOD14, MCD45 (both of which are Available Layers) and Active Layers:
• MCD45 is a list of MODIS burned area layers organized by the month and year of detection
• MOD14 is a list of MODIS active fires layers organized by year and month of detection • Active Layers contains the layers that come with the World Wind Java application Layers can be added or removed by checking or unchecking the box located next to them.
When a layer is checked from the MOD14 or MCD45 menu it appears in the Active Layers menu and it can be checked and unchecked in the Active Layers menu to add and remove it from the globe It will disappear from the Active Layers menu and the globe if it is unchecked in the MCD45 or MOD14 menu
Using WWJF
To zoom in on the globe scroll forward with the scroll pad on your mouse, layers for each tier will automatically load as you zoom in or use the Controls (The Active Layers Menu below)
To zoom out on the globe scroll backwards with the scroll pad on your mouse, layers for each tier will automatically load as you zoom out or use the Controls (see The Active Layers Menu below) If you click on any part of the globe it will rotate to that point
If you click and hold down the left-click you can rotate that Earth by dragging the mouse in the direction you want to move; you can rotate the Earth in any direction; East-West, North-South, Diagonal.
The Active Layers Menu
The View Controls layer in the Active Layers menu refers to controls that are seen in the bottom left corner of the MODIS Burned Area and Active Fire window
•This allows you to navigate the globe, it can be used instead of the instructions given in the Using World Wind Java Basics Section
1. The icon on the far left of the controls that has four arrows pointing like a compass allows you to rotate the Earth in any direction by click on the icon in the direction you want to rotate it
2. The next icons over from the left, the + and – icons are to zoom in and out on the globe 3. The next icons to the right that are rounded arrows pointing in opposite directions allow you
to rotate the Earth in a counterclockwise or clockwise direction
4. The next icons to the right that are three stacked lines vertical or horizontal allow you to shift the angle that you view the Earth, either up or down, the vertical bars allow to adjust the angle upwards, the horizontal bars allow you to adjust the angle downwards
5. The last icons on the right that have a mountain with a plus sign and a small mountain with a minus sign allow you to increase or decrease the visible elevation, by pressing the button with the plus sign it increases the relief on the globe allowing the natural elevations to be viewed, the icon with the minus sign will decrease the relief on the globe, the relief can be seen best when zoomed in and the globe is viewed from a downward angle
Available Layers
• Stars layer: shows the stars that are seen behind the Earth when looking upon it from this viewpoint, constellations are mapped out in the stars
• Atmosphere layer: visible around the rim of the globe and is not visible when you are zoomed in and the rim of the globe cannot be seen
• NASA Blue Marble Image: from MODIS data and is a view of the globe and is only visible from the most zoomed out tier
• Blue Marble (WMS) 2004 layer: necessary to be able to zoom in and view the Earth at each tier
• i-cubed Landsat layer: only visible when zoomed into 50km and is comprised of Landsat images of the Earth
• USDA NAIP layer: only visible when zoomed into 20km and is only visible over the United States as it is imagery of the US during its growing seasons
• MS Virtual Earth Aerial layer: Microsoft aerial imagery of the Earth and is only visible when zoomed into 50km, this layer is also only visible over the United States
• Political Boundaries layer: when checked places yellow country borders on the Earth, defining each country
• World Map layer: small map seen in the upper left corner of the globe display, this feature allows you to click on any location the Earth and it will zoom into that location at 100km zoomed in
• Scale bar layer: in the bottom right corner of the globe display and shows that scale at which you are zoomed in
• Place Names layer: adds place names to the globe over the feature it is labeling
•continents are in white capital letters, oceans are in white letters, countries are in white letters, bodies of water other than oceans are blue letters, physical features (mountains, deserts, ect.) are labeled with orange letters, cities are labeled with yellow letters
•As you zoom in more features are added, from the most zoomed out that Place Names are visible only ocean and continents are labeled and as you zoom in more features are labeled
Citation information
We kindly ask the users of the MODIS fire website to cite the following publications when
referring to datasets made available through the webpages.
World Wind visualization of MODIS Fire Products:
Boschetti, L., Roy, D. and Justice, C., 2008. Using NASA’s World Wind Virtual Globe for
Interactive Visualization of the Global MODIS Burned Area Product,
International Journal of
Remote Sensing
, 29(11)3067-3072.
MODIS active fire product:
Giglio, L., Descloitres, J., Justice, C.O., Kaufman, Y. 2003. An enhanced contextual fire
detection algorithm for MODIS.
Remote Sensing of Environment
, 87:273-282
MODIS burned area product:
D.P. Roy, L. Boschetti, C.O. Justice, J. Ju, The Collection 5 MODIS Burned Area Product -
Global Evaluation by Comparison with the MODIS Active Fire Product, 2008.
Remote Sensing
of Environment
, 112, 3690-3707
References:
BUTLER, D., 2006, The web-wide world, Nature, vol.439, pp. 776-778.
HOGAN, P, COUGHLAN, J., 2006, NASA World Wind, Open Source 4D Geospatial Visualization Platform:.NET & Java, Eos Transactions AGU, 87(52), Fall Meet. Suppl., Abstract IN33A-1333
JONES, C.B. AND WARE, J.M., 2005, Map generalization in the Web age, International Journal of Geographical Information Science, DOI: 10.1080/13658810500161104, Volume 19, pages 859 – 870.
JUSTICE, C. O., TOWNSHEND, J. R. G., VERMOTE, E. F., MASUOKA, E., WOLFE, R. E., SALEOUS, N., ROY, D. P., MORISETTE, J.T., 2002, An overview of MODIS Land data processing and product status, Remote Sensing of Enviroment., 83, 3–15.
KALLURI, S., GILRUTH, P. AND BERGMAN, R., 2003. The potential of remote sensing for decision makers at the state, local and tribal level: experiences from NASA’s Synergy program, Environmental Science and Policy, 6, 487-500.
ROY, D.P., BORAK, J.S., DEVADIGA, S., WOLFE, R.E., ZHENG, M., DESCLOITRES, J., 2002, The MODIS Land Product Quality Assessment Approach, Remote Sensing of Environment, 83, 62-76.
ROY, D.P., JIN, Y., LEWIS, P. E., AND C. O, JUSTICE, 2005, Prototyping a global algorithm for systematic fire affected area mapping using MODIS time series data, Remote Sensing of Environment, vol. 97, pp. 137-162. STÖCKLI R., VERMOTE E., SALEOUS N., SIMMON R., HERRING D. 2006. True Color Earth Data Set Includes Seasonal Dynamics. EOS Transactions, American Geophyisical Union, 87, 5, 49-55.
TRIGG, S.N AND ROY D.P., 2007, A focus group study of factors that promote and constrain the use of satellite derived fire products by resource managers in southern Africa, Journal of Environmental Management, 82:95-110. WOLFE, R.E., ROY, D.P., E. VERMOTE, 1998, The MODIS land data storage, gridding and compositing methodology: L2 Grid, IEEE Transactions on Geoscience and Remote Sensing, vol. 36, pp. 1324-1338.
WWW1: NASA World Wind, http://worldwind.arc.nasa.gov/
WWW2: NASA World Wind Open Source Community web site: http://www.worldwindcentral.com WWW3: NASA World Wind Java
http://worldwind.arc.nasa.gov/java/
WWW4: MODIS Burned Area Product Web Site, http://modis-fire.umd.edu/MCD45A1.asp
WWW5: MODIS Land Quality Assessment Web Site, http://modland.nascom.nasa.gov/QA_WWW/ WWW6: MODIS Reprojection Tool Software, http://edcdaac.usgs.gov/landdaac/tools/modis/index.asp WWW7: ImageMagick Software, http://www.imagemagick.org