Mapping quantitative trait loci controlling fatty acid composition in olive
12
M. L. Hernández1, A. Belaj2, M. D. Sicardo1, L. León2, R. de la Rosa2*, A. Martín3,J. M. Martínez-3
Rivas1, and S. G. Atienza3 4
5 1
Department of Biochemistry and Molecular Biology of Plant Products, Instituto de la Grasa (CSIC). 6
Campus Universidad Pablo de Olavide, Building 46. Ctra. Utrera, Km 1, E-41013 Sevilla, Spain. 7
2
Área Mejora y Biotecnología, IFAPA-Centro Alameda del Obispo. Avda. Menendez Pidal s/n 14080, 8
Córdoba, Spain 9
3
Institute for Sustainable Agriculture, CSIC, Alameda del Obispo s/n, 14004, Córdoba, Spain 10 11 *Corresponding author: 12 Raúl de la Rosa: 13
e-mail: [email protected] phone: ++34671532738 14 fax: ++34957016043 15 16 Acknowledgements 17
This work was partly supported by OLEAGEN Project funded by the Fundación Genoma España, Junta 18
de Andalucía through Instituto de Investigación y Formación Agraria y Pesquera (IFAPA) and 19
Corporación Tecnológica de Andalucía (CTA). 20
21 22 23
Postprint of Euphytica, January 2017, 213:7
DOI: 10.1007/s10681-016-1802-3
Abstract
24
Fatty acids are the main component of the olive oil and their composition has a critical influence on the 25
oil quality. However, oil quality evaluation has not been frequently included in the selection of new bred 26
cultivars. This can due to the difficulties in analyzed oil quality in large set of genotypes and also to the 27
long juvenile period of olive seedlings. Therefore, the identification of molecular markers associated to 28
olive oil quality traits could facilitate the selection for them in breeding programs of this species. In the 29
present work, the first identification of QTLs for fatty acids on olive oil is reported. They have been 30
located in a linkage map of a ‘Picual’ x ‘Arbequina’ progeny of the olive breeding program of Córdoba. 31
Correlations among fatty acids are in agreement with previous reports of breeding progenies. QTLs found 32
for oleic and linoleic acids explained 41.1 and 69.7 % of the total variability, respectively, and were co-33
localized in the same linkage groups. In the same region, QTLs for monounsaturated, polyunsaturated and 34
oleic/linoleic ratio were also identified. In other linkage groups, three QTLs for linolenic and one for 35
palmitoleic acid were also located explaining 15.0-28.0 % of the total variability. These results could be 36
useful to increase the efficiency of breeding programs aimed at selecting new cultivars with high oleic 37
acid content, and, therefore, with enhanced nutritional properties and oxidative stability of the olive oil. 38
Keywords: Olea europaea L.; breeding; QTL; olive oil; oleic acid
39 40
Introduction
41
Olea europaea L. (2n = 2x = 46) is one of the most economically important trees in the Mediterranean 42
basin with over 98% of the 2.8 MTm of virgin olive oil (VOO) harvested in the world (FAOSTAT 2013). 43
VOO is the main source of fat in the Mediterranean diet. This oil is obtained as a fruit juice, i.e., directly 44
from the crushing of olive fruits and its consumption has been widely associated with positive health 45
benefits (Covas 2008; Schwingshackl and Hoffmann 2014). Fatty acids, the main components of the olive 46
oil, are considered directly implicated in the health benefits of the olive oil (Di Bella et al. 2007; 47
Quintero-Florez et al. 2015). In particular, the role of VOO in the protection against cardiovascular 48
disease has been mostly attributed to its high oleic acid content (Rietjens et al. 2007). In contrast, elevated 49
linoleic acid content may cause a negative impact in the nutritional properties of olive oil, since recent 50
studies using seed oils characterized by high linoleic acid content indicates that an excessive consumption 51
of this fatty acid in the diet is associated with a higher risk of hypertension and cardiovascular and 52
carcinogenic diseases (Bonow and Eckel 2003; Vos 2003). Besides, the oleic/linoleic ratio has also 53
important consequences in the technological properties of the olive oil, with high linoleic acid content 54
affecting negatively its oxidative stability (Gutiérrez et al. 1999). In addition, the levels of individual fatty 55
acids are also important at the regulatory level. According to European Commission regulation 702/2007 56
(EC 2007), the contents of oleic acid must range from 55 to 83%, while linoleic acid must account for 3.5 57
to 21% and linolenic acid for less than 1%. 58
The fatty acid biosynthesis pathway is well known in plants including olive. In vascular plants, 59
the fatty acid biosynthesis starts in the plastids, yielding primarily palmitoyl-acyl carrier protein (ACP) 60
and stearoyl-ACP by successive addition of two carbon atoms from acetyl-CoA (Harwood 2005). Still in 61
the plastid, most of the stearoyl-ACP is desaturated by the action of a soluble Δ9 stearoyl-ACP desaturase 62
producing oleoyl-ACP, which is the main product of the plastidial fatty acid biosynthesis. The oleic acid 63
is then incorporated into glycerolipids inside or outside plastids, and it can be further desaturated to 64
linoleic, and then to α-linolenic acid by the consecutive action of ∆12 and ∆15 desaturases. Two sets of 65
these enzymes are present in plant cells, which differ in their cellular localization (Shanklin and Cahoon 66
1998). The microsomal oleate desaturase (FAD2) and linoleate desaturase (FAD3) are located in the 67
endoplasmic reticulum (ER), whereas the plastidial oleate desaturase (FAD6) and linoleate desaturase 68
(FAD7/8) are located in the chloroplast. 69
The fatty acid composition of olive oil is influenced by pedoclimatic conditions, olive growing 70
practices (Jimenez Herrera et al. 2012; Dabbou et al. 2015) and the cultivar (Rondanini et al. 2011). In 71
fact, high variability for fatty acid composition has been observed in cultivar collections (Rotondi et al. 72
2013; Uceda et al. 2005). However, most of the current olive cultivars are very ancient and have been 73
obtained by the empiric selection of the growers mainly on the basis of their productivity, oil content and 74
fruit size, but not on oil composition (Barranco et al. 2010; Bracci et al. 2011). Besides, none of the few 75
cultivars obtained by systematic breeding, such as ‘Barnea’ (Lavee et al. 1986), ‘Maalot’ (Lavee et al. 76
1999), ‘Askal’ (Lavee et al. 2003), ‘Fs-17’ (Bellini et al. 2002) or ‘Sikitita’ (Rallo et al. 2008) has been 77
specifically selected for having a superior oil composition. This is mainly due to the fact that the 78
evaluation of oil quality traits, including fatty acids, is a very time consuming and costly task. Initially, 79
seedlings have to overcome the juvenile period and then to reach a significant size in order to bear enough 80
amount of fruits to allow oil extraction (De la Rosa et al. 2006). Then, to extract and analyze oil from the 81
large progenies usually obtained in breeding programs represents a very complicated and difficult task. 82
The fact that the content of some oil components is not affected by the oil extraction process and can be 83
directly measured in fruit without the need of oil extraction, could partly overcome this problem (Garces 84
and Mancha 1993; Velasco et al. 2014). Although some studies suggested high heritability for fatty acid 85
composition (Dabbou et al. 2010; De la Rosa et al. 2016), there is little knowledge on the genetic control 86
of its variability among olive cultivars. 87
In this context, the use of molecular markers could be helpful to investigate the genetic control of 88
important traits and for the identification of beneficial alleles through the development of linkage maps 89
and marker-trait associations as QTL analysis (El-Soda et al. 2014). Actually, few QTL analyses have 90
been performed in olive including flowering-related traits (Ben Sadok et al. 2013) using a ‘Olivière × 91
‘Arbequina’ progeny. Thus, the objective of this work was the identification of QTLs associated to the 92
fatty acid profile in a segregation progeny of ‘Picual’ × ‘Arbequina’ where molecular markers associated 93
with fruit-related traits and oil content has been previously found (Atienza et al. 2014). This cross has 94
been very successful in olive breeding, showing high variability for fatty acid composition (León et al. 95
2004b) and producing the first olive cultivar registered in Spain, ‘Sikitita’ (Rallo et al. 2008). 96
Material and methods 98 99 Plant material 100 101
A progeny coming from the cross of ‘Picual’בArbequina’ performed in spring 2001 were used in the 102
present study. Seedlings were planted in open field in September 2003, at 4×1.5 m of spacing at the 103
experimental orchard of IFAPA, Centre “Alameda del Obispo”, Córdoba, Spain. Trees were trained to 104
form the canopy at 1.6 m height and then develop freely, as suggested in previous experiments (Santos-105
Antunes et al. 2005) and yearly irrigated with 2,000 m3/ha of water. This progeny comes from the 106
cooperative breeding program of the University of Cordoba and IFAPA, Spain. The oils of the two 107
parents are known to have contrasting fatty acid composition (Hernández et al. 2009). 108
109
Fatty acid analysis 110
111
Sixty genotypes which showed enough crop for oil extraction were selected for fatty acid analyses 112
during the 2008/2009 season. . A random sample of 1000 g of olives was hand-collected per seedling. 113
Samples were collected when most fruits were at maturity index 2,5 (Frías et al. 1991). VOO was 114
extracted using an Abencor analyzer (Comercial Abengoa, S.A., Seville, Spain) that simulates the 115
industrial process of VOO production at lab scale (Martinez-Suarez et al. 1975). Milling of whole olive 116
fruits was performed using a stainless steel hammer mill operating at 3000 rpm provided with a 5 mm 117
sieve. Malaxation was carried out for 30 min with the Abencor thermo-beater operated at 30 °C according 118
to industry recommendations. Centrifugation of the kneaded paste was performed in a basket centrifuge at 119
3500 rpm for 1 min. After centrifugation, the oils were decanted and paper filtered. Oils were stored 120
under nitrogen at -20 ºC until analysis. 121
Fatty acid composition of the different olive oils was determined using the one-step method of 122
(Garcés and Mancha 1993). After the addition of 2 ml of methanol-toluene-H2SO4 (80:20: 2, vol/vol/vol) 123
to 50 mg of olive oil, the mixture was incubated for 1 h at 80 ºC. After cooling, 2 ml heptane and 5 ml 124
Na2SO4 were added, and the upper phase containing the fatty acid methyl esters was analysed by gas-125
liquid chromatography using a 7890A (Agilent, Santa Clara, CA USA) fitted with a capillary column (30-126
m length; 0.32-mm inner diameter; 0.2-µm film thickness) of fused silica (Supelco, Bellafonte, PA, USA) 127
and a FID detector. Hydrogen was used as a carrier gas with a linear rate of 1.34 ml min-1 and split ratio 128
of 1/50. The injector and detector temperature was 220 °C and the oven temperature was 170 °C. Results 129
were obtained in mol % of the different fatty acids and expressed as means of three independent 130
determinations. 131
The following traits were considered for QTL analyses. Individual fatty acids (% over total oil 132
content): palmitic, palmitoleic, stearic, oleic, linoleic and linolenic acids. Quality indices: total saturated 133
(stearic + palmitic); total unsaturated (oleic+ linoleic + linolenic + palmitoleic), total monounsaturated 134
(oleic + palmitoleic) and total polyunsaturated (linoleic + linolenic) were also considered. Ratio oleic / 135
linoleic was considered as an additional trait. Pearson correlation coefficients among traits were 136
calculated using IBM SPSS Statistics 20. 137
138
QTL analyses 139
140
The genetic map for ‘Picual’בArbequina’ progeny (Dominguez-Garcia et al. 2012) was used for QTL 141
analysis. Two independent QTL analyses (one for each parental map) were performed using MAPQTL 142
5.0 package (Van Ooijen 2004). First, the non-parametric Kruskal-Wallis (KW) test was performed to 143
identify association between markers and traits individually, without considering the map information. 144
After this, interval mapping (IM) analyses were performed (Lander and Botstein 1989; van Ooijen 1992). 145
An initial set of cofactors was selected from KW and IM results and a backwards elimination procedure 146
was applied to select significant markers as implemented in MapQTL 5.0. Only significant markers at 147
P<0.1 were used as cofactors in the multiple QTL methods (rMQM and MQM) (Jansen 1993, 1994; 148
Jansen and Stam 1994) analyses. A mapping step size of 1 cM was used for IM and MQM analyses. The 149
significance thresholds for accepting the presence of potential QTLs were empirically determined using a 150
permutation analysis (500 permutations) (Churchill and Doerge 1994) as implemented in MapQTL 5.0. 151
An estimation of the total variance explained at the position with the highest LOD score was given by 152
MapQTL® 5.0. The QTL positions were estimated as the position with the maximum LOD score on a 153
linkage group. Uncertainty of the map position was indicated by a 1-LOD support interval (Conneally et 154
al. 1985; van Ooijen 1992). MapChart software (Voorrips 2002) was used to indicate location of the QTL 155
for fruit traits in the ‘Picual’ and ‘Arbequina’ maps. For each QTL, the difference in the alleles effect was 156
determined using the Knott et al. (1997) method ((Atienza et al. 2003a, b; Sewell et al. 2000).In a CP 157
population, a QTL can segregate for four different alleles in a cross between two heterozygous parents 158
(‘CP’ population in Joinmap). Thus, four different genotypic classes can be obtained ‘ac’, ‘ad’, ‘bc’, ‘bd’ 159
from the parental mating type ab×cd. Since the pseudo-testcross strategy was used for map construction, 160
‘Picual’ markers are genotyped as ‘lm×ll’ and thus ‘ac’≡‘ad’≡‘ll’; ‘bc’≡‘bd’≡‘lm’ and the difference in 161
effect of the alleles from ‘Picual’ (PPic) = ‘bc’-‘ac’=‘lm’–‘ll’. Similarly, ‘Arbequina’ markers are 162
genotyped as ‘nn×np’ and thus, ‘ac’≡‘bc’≡‘nn’; ‘ad’≡‘bd’≡‘np’ and the difference in effect of the alleles 163
from ‘Arbequina’ (PArb)=‘ad’-‘ac’=‘np’-‘nn’. 164
165
Results and discussion
166 167
Phenotypic variation in fatty acid composition 168
169
Six fatty acids were quantified including oleic, palmitic, linoleic, palmitoleic, stearic and linolenic acids, 170
although other fatty acids were also found in trace amounts, such as arachidic or eicosenoic acids. Basic 171
statistics were calculated for these compounds and the quality indexes described in the material and 172
methods section (Table 1), while their distributions are shown in Supplementary Material 1. 173
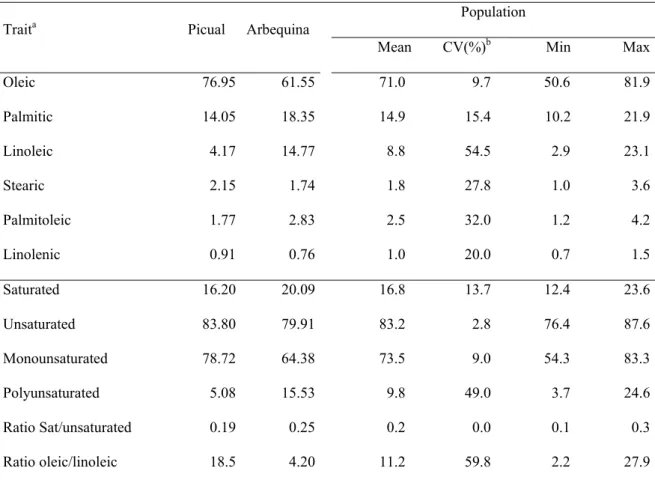
Oleic acid was the main constituent of the fatty acid profile of the progeny with a mean value of 174
71.0% followed by palmitic (14.9%) and linoleic acid (8.8%) (Table 1). The remaining fatty acids only 175
constituted the 5.3% of the total fatty acid composition. As far as the parents, ‘Picual’ showed a higher 176
oleic content (76.95%) than ‘Arbequina’ (61.55%) while ‘Arbequina’ oil was characterized by higher 177
palmitic (18.35%) and linoleic (14.77%) contents than ‘Picual’ (Table 1), in total agreement with 178
previous reports (Uceda et al. 1999; Leon et al. 2008). Considerable variability was observed for all the 179
fatty acids content, as previously reported in other progeny of the same cross (León et al. 2004b). This 180
high variability together with the high genotypic effect previously found for this character (De la Rosa et 181
al., 2016) indicates that the cross between ‘Picual’ and ‘Arbequina’ is very convenient for breeding 182
programs aimed at producing new cultivars with high percentage of oleic acid in their oils. 183
184
Correlation analysis of oil content and fatty acids 185
Pearson correlations were calculated including not only individual fatty acids and quality indexes, but 187
also the previously reported oil content in fruit on dry weight basis (OCFDW) (Atienza et al. 2014) 188
(Table 2). Although they do not determine the cause-and-effect relationships between the phenotypic 189
traits, they estimate the strength of association between them, which is useful for breeding and mapping 190
purposes. 191
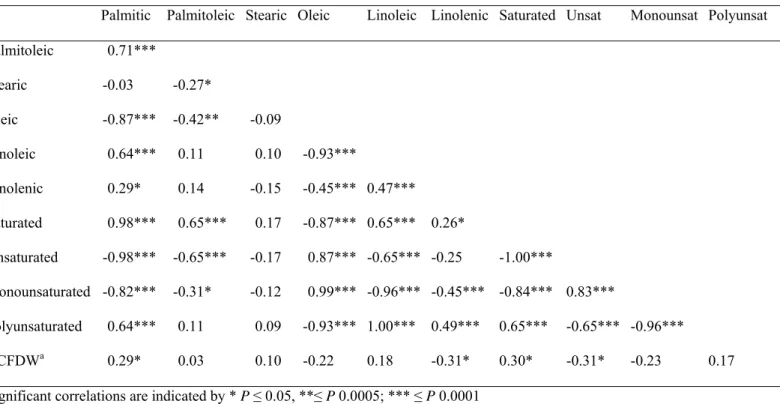
The highest correlation was found between the two main fatty acids of olive oil, oleic and 192
linoleic acids, which indicates that any increase in one of them will imply a decrease in the other. This is 193
to be expected since linoleic acid is directly formed by desaturation of oleic acid, which is catalysed by 194
the oleate desaturase activity (Shanklin and Cahoon 1998). In fact, this negative correlation seems to be 195
general in olive (León et al., 2004a; Dabbou et al., 2012; Sabetta et al. 2013) and in other oil crops such 196
as sunflower (Pérez-Vich et al. 2004), sesame (Were et al. 2006), maize (Wassom et al. 2008), Jatropha 197
(Liu et al. 2011), rice (Ying et al. 2012), almond (Font i Forcada et al. 2012) and oil palm (Montoya et al. 198
2013; Montoya et al. 2014). 199
Palmitic acid was negatively correlated with oleic acid (Table 2). This observation agrees with 200
various reports on olive (León et al., 2004a; Dabbou et al., 2012), sesame (Were et al. 2006), rapeseed 201
(Zhao et al. 2008), oil palm (Singh et al. 2009; Montoya et al. 2013; Montoya et al. 2014), rice (Ying et 202
al. 2012) and almond (Font i Forcada et al. 2012). The biosynthesis of C18 fatty acids proceeds via an 203
elongation step of C16 acyl chains, followed by desaturation (Voelker and Kinney 2001). The elongation 204
step plays an important role in regulating the relative amounts of palmitic acid and C18 fatty acids 205
(Carlsson et al. 2002). On the contrary, palmitic acid showed a positive correlation with linoleic acid, as it 206
was previously reported in olive (León et al., 2004a) and almond (Font i Forcada et al. 2012). Particularly 207
interesting is the lack of correlation between palmitic and stearic acids despite the fact that the later fatty 208
acid is directly synthesized from the first. On the other hand, palmitoleic acid, which is directly 209
synthesized from palmitic acid by a single desaturation step, is positively correlated with palmitic acid, 210
but inversely associated with oleic acid. 211
Linolenic acid was inversely associated with oleic acid and positively correlated with linoleic 212
acid, as previously described in maize (Wassom et al. 2008), rice (Ying et al. 2012), and oil palm 213
(Montoya et al. 2013; Montoya et al. 2014). Interestingly, the correlation between linoleic and linolenic 214
acids was moderate, despite the fact that the second fatty acid is directly synthesized by desaturation of 215
the first, as a result of the linoleate desaturase activity (Shanklin and Cahoon 1998). This result has also 216
been observed in an olive collection (Sabetta et al. 2013). 217
As mentioned in the introduction, a high content of oleic acid and low on linoleic, linolenic and 218
palmitic is considered very relevant in the health properties of the olive oil (Di Bella et al. 2007; 219
Quintero-Florez et al. 2015). Therefore, the reported negative correlations of oleic acid with the rest of the 220
mentioned fatty acids content might be of interest for breeding programs aimed at improving the oil fatty 221
acid composition. 222
Stearic and linolenic acids, the two in the lower proportion in the olive oil, were the ones were 223
weakest correlations with the four quality indexes calculated. None of the fatty acids showed a strong 224
correlation with the oil content (OCFDW). 225
226
QTLs involved in fatty acid composition 227
228
QTL analyses were independently performed in each parental map (‘Picual’ and ‘Arbequina’) (Table 3, 229
Fig. 1) as usually performed in mapping populations derived from two heterozygous parents (Grattapaglia 230
et al. 1995; Sewell et al. 2000; Atienza et al. 2003b; Socquet-Juglard et al. 2013; Atienza et al. 2014). 231
Two QTLs were detected in ‘Picual’ map whereas eight QTLs were found in ‘Arbequina’ map. More 232
QTLs were also detected for fruit traits in the ‘Arbequina’ than in ‘Picual’ map in a previous work of our 233
group (Atienza et al. 2014). This is likely influenced by the shorter genetic distance covered in ‘Picual’ 234
map compared to the one of ‘Arbequina’ (Dominguez-Garcia et al. 2012). 235
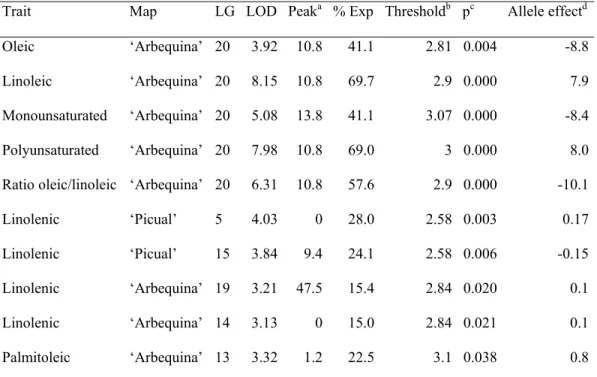
A single QTL for oleic acid was identified on linkage group 20 in ‘Arbequina’ (Arb_20) map 236
(Table 3, Fig. 1). It accounted for 41% of the phenotypic variance and it has an allele effect of -8.8 which 237
indicates that the allele increasing oleic content is inherited from ‘Picual’. Similarly, a QTL for linoleic 238
acid was located in the same position (Table 3, Fig. 1). It explained 69.7% of the phenotypic variation and 239
it shows an allele effect of 7.9, i.e., the allele increasing the content is inherited from ‘Arbequina’. This is 240
concordant with the fact that ‘Arbequina’ has higher linoleic acid and lower oleic acid content than the 241
other parent ‘Picual’. The co-localization of both QTLs and the different sign of the allele effect (Table 3, 242
Fig. 1) are in agreement with the high negative correlation between both fatty acids (Table 2). 243
Furthermore, the co-localization in the same region of QTL for monounsaturated and polyunsaturated 244
fatty acids as well as for the ratio oleic/linoleic trait, reinforces the importance of this region for the 245
determination of the fatty acid profile in olive oil. Whether there is a single segregating locus controlling 246
the biosynthesis of oleic and linoleic acids or clusters of linked QTLs independently affecting the 247
biosynthesis of both fatty acids cannot be discerned. Fine-mapping of this QTL region and the analysis of 248
future genomic sequence data could allow the discrimination between both hypotheses. 249
The fact that QTLs for oleic and linoleic acids, as well as for monounsaturated and 250
polyunsaturated fatty acids, and for the oleic/linoleic ratio were co-localized in the same linkage group of 251
‘Arbequina’ cultivar is significant considering that the proportions of these fatty acids have a important 252
effect on olive oil quality (Gutiérrez et al. 1999). Regarding their metabolic origin, oleate desaturases 253
catalyze the desaturation of oleic acid to produce linoleic acid. Two genes encoding microsomal oleate 254
desaturases (OepFAD2-1 and OepFAD2-2) have been described in olive (Hernandez et al. 2005), whereas 255
only one gene corresponding to the chloroplast oleate desaturase (OeFAD6) has been reported (Banilas et 256
al. 2005; Hernández et al. 2011). Expression analysis of these genes revealed that OepFAD2-2 is the gene 257
mainly responsible for the linoleic acid content in the olive fruit mesocarp and, therefore, in VOO 258
(Hernandez et al. 2009). Hence, the gene OepFAD2-2 seems to be a good candidate underlined by the co-259
localized QTLs for oleic and linoleic acids, as well as for monounsaturated and polyunsaturated fatty 260
acids, and for the oleic/linoleic ratio in linkage group 20 of ‘Arbequina’ cultivar (Arb20). Interestingly, 261
the presence of at least two copies of the OepFAD2-2 gene in the olive genome has been reported 262
(Hernandez et al. 2005). 263
Further analysis was conducted in Arb20 to identify the best genotypes for oleic and linoleic 264
production within the interval of confidence of the QTLs for oleic and linoleic acid (Fig. 2). These QTLs 265
are located within the markers olPt-767430 and a group of four identical markers (olPt-578159, 266
olPt576186, olPt-771304 and olPt772057). At each marker, the mean values for oleic and linoleic content 267
were calculated for both genotypes (np and nn) (Fig. 2). As shown by this figure, the best haplotype for 268
increasing oleic content would be np-np-nn, at each of the three loci respectively (Fig. 2). On the 269
contrary, nn-nn-np would be the best combination if we are interested in raising linoleic content. The 270
change in the amount of one fatty acid affecting the levels of other associated fatty acids was reported 271
earlier (Pérez et al. 2014). In particular, the co-localization of a QTL for oleic and linoleic acid has been 272
also reported for almond (Font i Forcada et al. 2012) and oil palm (Montoya et al. 2014). 273
On the other hand, four QTLs were identified for linolenic acid, two in ‘Picual’ map (linkage 274
groups 5 and 15) and two in ‘Arbequina’ map (linkage groups 14 and 19) (Table 3). QTL detected in 275
‘Picual’ show opposite allele effects. The QTL on linkage group 5 (LG5) has an allele effect of 0.17, 276
which means that the allele derived from ‘Arbequina’ increases the content of linolenic acid. On the 277
contrary, the QTL on LG15 has an allele effect of -0.15 which indicates that the allele from ‘Picual’ 278
increases the content at this QTL. Both QTL detected in ‘Arbequina’ had a similar allele effect (0.1) and 279
each of them explained around 15% of the phenotypic variation. It is peculiar that the allele increasing the 280
content was derived from ‘Arbequina’ in three out of four QTLs, despite it has lower linolenic content 281
than ‘Picual’ (Table 1). 282
Linolenic acid content has also an important effect on the VOO quality. In particular, this ω3 283
fatty acid participates in the proportion of ω3/ω6 fatty acids which has been reported to be very important 284
in terms of nutritional characteristics of edible oils. In addition, it has been demonstrated that the low 285
levels of linolenic acid are essential for aroma biogenesis during the milling and malaxation processes to 286
obtain VOO (Olías et al. 1993). The synthesis of linolenic acid is catalyzed by two different linoleate 287
desaturases. The microsomal enzyme (FAD3) is located in the endoplasmic reticulum, while the plastidial 288
linoleate desaturase (FAD7/8) is located in the plastids. Two FAD3 genes, designated FAD3A (Banilas et 289
al. 2007) and FAD3B (Hernández et al. 2016), and two FAD7 genes, named FAD7-1 (Poghosyan et al. 290
1999; Sabetta et al. 2013) and FAD7-2 (Hernández et al. 2016) encoding linoleate desaturases have been 291
isolated and characterised in olive. In contrast to oilseeds, where FAD3 genes are the main responsible for 292
the linolenic acid content of TAG, in olive fruit mesocarp FAD7 could be responsible for the synthesis of 293
the linolenic acid present in triacylglycerols (Hernandez et al. 2008; Hernández et al. 2016). Hence, the 294
FAD7 gene is a good candidate to explain the QTL of linolenic acid detected in ‘Arbequina’ and ‘Picual’ 295
in future studies. 296
Finally, a QTL for palmitoleic acid explaining 22.5% of the phenotypic variance was identified 297
on LG13 (Arbequina map). A QTL for palmitoleic acid content was also found in an almond progeny, 298
explaining a similar percentage of variance (Font i Forcada et al. 2012). This monoenoic fatty acid is 299
found in small amounts in most plant oils (Gunstone, 1992). The stability and low melting point of 300
palmitoleic acid makes oils rich in this fatty acid, good lubricants at low temperatures. Additionally, some 301
studies have attributed antitumor activity to palmitoleic acid (Hayatsu et al. 1988), as well as positive 302
effects in the treatment of hyperlipidemia (Maedler et al. 2001). Looking at the pathway for plant fatty 303
acid biosynthesis, palmitoleic acid is produced in the plastid from palmitoyl-ACP by the enzymatic 304
activity of the stearoyl-ACP desaturase, which exhibits low specificity for palmitoyl moieties (Cahoon et 305
al. 1998; Gibson 1993). In olive, one gene encoding stearoyl-ACP desaturase has been isolated and 306
characterized up to date, being its expression temporally and developmentally regulated in olive fruit 307
(Haralampidis et al. 1998). 308
It is remarkable that none of the QTLs identified in this work co-localizes with the QTL for 309
OCFDW (Oil content fruit dry weight) previously reported (Atienza et al. 2014). This together with the 310
almost lack of correlation between oil content and fatty acid composition may indicate that these traits are 311
independent, opening thus the possibility of simultaneous breeding selection for both total oil content and 312
fatty acid profiles. 313
The relatively small population size used in this study may have resulted in underestimates of the 314
number of QTL since it is known that the number of QTL increases with population size (Li et al. 2006; 315
Vales et al. 2005). However, QTL with large effect can be identified even with small populations (Vales 316
et al. 2005). Thus, QTLs identified in this work are likely the best targets for breeding since they have the 317
largest effect. Similarly, the amount of phenotypic variance explained by the QTL may be overestimated 318
since this parameter increases as the population size decreases (Vales et al. 2005). In any case, small 319
population sizes have been successfully used for the identification of QTL associated with fatty acid 320
composition in perennial species like oil palm (Singh et al. 2009) and almond (Font i Forcada et al. 2012). 321
322
Conclusions
323 324
The present study represents the first detection of QTL underlying the variability of fatty acid 325
composition in olive oil. The current results are based in data from a single season and thus they require 326
further validation. Nevertheless the co-localization of QTLs for oleic, linoleic and three quality indices in 327
one linkage group (Arb_20), indicates that this region could be important for determining the relative 328
proportions of oleic and linoleic acids in olive oil. In particular, it could be useful to increase the 329
efficiency of breeding programs aimed at selecting new cultivars with high oleic acid content, giving the 330
long juvenile period of olive. This could be important in order to enhance the nutritional properties and 331
oxidative stability of the corresponding VOO. Furthermore, these QTLs are independent of the QTL for 332
OCFDW previously reported, and, thus, simultaneous selection for both total oil content and fatty acid 333
profile seems to be feasible, at least under the genetic background here reported. 334
336
Table 1 Basic statistics for the fatty acids, the quality indices, and the olive oil content in the progeny and
parent cultivars.
Traita Picual Arbequina Population
Mean CV(%)b Min Max
Oleic 76.95 61.55 71.0 9.7 50.6 81.9 Palmitic 14.05 18.35 14.9 15.4 10.2 21.9 Linoleic 4.17 14.77 8.8 54.5 2.9 23.1 Stearic 2.15 1.74 1.8 27.8 1.0 3.6 Palmitoleic 1.77 2.83 2.5 32.0 1.2 4.2 Linolenic 0.91 0.76 1.0 20.0 0.7 1.5 Saturated 16.20 20.09 16.8 13.7 12.4 23.6 Unsaturated 83.80 79.91 83.2 2.8 76.4 87.6 Monounsaturated 78.72 64.38 73.5 9.0 54.3 83.3 Polyunsaturated 5.08 15.53 9.8 49.0 3.7 24.6 Ratio Sat/unsaturated 0.19 0.25 0.2 0.0 0.1 0.3 Ratio oleic/linoleic 18.5 4.20 11.2 59.8 2.2 27.9
aAll values but the ratios are expressed as mol%. Saturated = Stearic + Palmitic; Unsaturated = Oleic + Linoleic + Linolenic + Palmitoleic; Monounsaturated = Oleic + Palmitoleic; Polyunsaturated= Linoleic + Linolenic
bCoefficient of variation 337
339 340 341 342 343 344 345 346
Table 2 Pearson coefficient among fatty acids and oil content in the ‘Picual’ × ‘Arbequina’ olive population.
Palmitic Palmitoleic Stearic Oleic Linoleic Linolenic Saturated Unsat Monounsat Polyunsat
Palmitoleic 0.71*** Stearic -0.03 -0.27* Oleic -0.87*** -0.42** -0.09 Linoleic 0.64*** 0.11 0.10 -0.93*** Linolenic 0.29* 0.14 -0.15 -0.45*** 0.47*** Saturated 0.98*** 0.65*** 0.17 -0.87*** 0.65*** 0.26* Unsaturated -0.98*** -0.65*** -0.17 0.87*** -0.65*** -0.25 -1.00*** Monounsaturated -0.82*** -0.31* -0.12 0.99*** -0.96*** -0.45*** -0.84*** 0.83*** Polyunsaturated 0.64*** 0.11 0.09 -0.93*** 1.00*** 0.49*** 0.65*** -0.65*** -0.96*** OCFDWa 0.29* 0.03 0.10 -0.22 0.18 -0.31* 0.30* -0.31* -0.23 0.17
Significant correlations are indicated by * P ≤0.05, **≤P 0.0005;*** ≤P 0.0001
347
Table 3 QTLs identified for fatty acid composition in the ‘Picual’ × ‘Arbequina’ olive population
Trait Map LG LOD Peaka % Exp Thresholdb pc Allele effectd
Oleic ‘Arbequina’ 20 3.92 10.8 41.1 2.81 0.004 -8.8
Linoleic ‘Arbequina’ 20 8.15 10.8 69.7 2.9 0.000 7.9
Monounsaturated ‘Arbequina’ 20 5.08 13.8 41.1 3.07 0.000 -8.4
Polyunsaturated ‘Arbequina’ 20 7.98 10.8 69.0 3 0.000 8.0
Ratio oleic/linoleic ‘Arbequina’ 20 6.31 10.8 57.6 2.9 0.000 -10.1
Linolenic ‘Picual’ 5 4.03 0 28.0 2.58 0.003 0.17
Linolenic ‘Picual’ 15 3.84 9.4 24.1 2.58 0.006 -0.15
Linolenic ‘Arbequina’ 19 3.21 47.5 15.4 2.84 0.020 0.1
Linolenic ‘Arbequina’ 14 3.13 0 15.0 2.84 0.021 0.1
Palmitoleic ‘Arbequina’ 13 3.32 1.2 22.5 3.1 0.038 0.8
aPosition of the maximum LOD Score
bGenome wide threshold determined by 500 permutations cQTL probability determined from 500 permutations
dThe allele increasing the value are derived from ‘Arbequina’ (+) or ‘Picual’ (-) 348
Figure captions
349
Fig. 1 QTL localization for fatty acid and quality traits in the olive progeny derived from ‘Picual’ ×
350
‘Arbequina’. The map was constructed using a pseudo-testcross strategy. Linkage groups from ‘Picual’ 351
and ‘Arbequina’ maps are coded (Pic) and (Arb) respectively. QTL locations are shown as 1-LOD 352
support intervals. 353
Fig. 2 Identification of the best olive genotypes for oleic and linoleic content in the QTLs located in
354
Arb20. For each marker, the mean values for oleic and linoleic contents for each genotype (‘nn’ and ‘np’) 355
were calculated. 356
357
References
359
Atienza SG, De la Rosa R, Leon L, Martin A, Belaj A (2014) Identification of QTL for agronomic traits 360
of importance for olive breeding. Mol Breed 34:725-737. doi:10.1007/s11032-014-0070-y 361
Atienza SG, Satovic Z, Petersen KK, Dolstra O, Martin A (2003a) Identification of QTLs influencing 362
agronomic traits in Miscanthus sinensis Anderss. I. Total height, flag-leaf height and stem 363
diameter. Theor Appl Genet 107:123-129 364
Atienza SG, Satovic Z, Petersen KK, Dolstra O, Martin A (2003b) Identification of QTLs influencing 365
combustion quality in Miscanthus sinensis Anderss. II. Chlorine and potassium content. Theor 366
Appl Genet 107:857-863 367
Banilas G, Moressis A, Nikoloudakis N, Hatzopoulos P (2005) Spatial and temporal expressions of two 368
distinct oleate desaturases from olive (Olea europea L.). Plant Sci 168:547-555 369
Banilas G, Nikiforiadis A, Makariti I, Moressis A, Hatzopoulos P (2007) Discrete roles of a microsomal 370
linoleate desaturase gene in olive identified by spatiotemporal transcriptional analysis. Tree 371
Physiol 27:481-490 372
Barranco D, Fernandez-Escobar R, Rallo L (2010) Olive growing. Pendle Hill, Australia 373
Bellini E, Parlati MV, Giordani E (2002) Three new olive cultivars obtained by cross-breeding. Acta 374
Horticulturae 586:221-223 375
Ben Sadok I, Celton J-M, Essalouh L, El Aabidine AZ, Garcia G, Martinez S, Grati-Kamoun N, Rebai A, 376
Costes E, Khadari B (2013) QTL mapping of flowering and fruiting traits in olive. PLoS ONE 377
8:e62831 378
Bonow RO, Eckel RH (2003) Diet, obesity, and cardiovascular risk. New England J Med 348:2057-2058. 379
doi:10.1056/NEJMp030053 380
Bracci T, Busconi M, Fogher C, Sebastiani L (2011) Molecular studies in olive (Olea europaea L.): 381
overview on DNA markers applications and recent advances in genome analysis. Plant Cell 382
Reports 30:449-462 383
Cahoon EB, Shah S, Shanklin J, Browse J (1998) A determinant of substrate specificity predicted from 384
the Acyl-Acyl carrier protein desaturase of developing cat's claw seed. Plant Physiol 117:593-385
598 386
Carlsson AS, LaBrie ST, Kinney AJ, Von Wettstein-Knowles P, Browse J (2002) A KAS2 cDNA 387
complements the phenotypes of the Arabidopsis fab1 mutant that differs in a single residue 388
bordering the substrate binding pocket. Plant J 29:761-770. doi:10.1046/j.1365-389
313X.2002.01253.x 390
Conneally PM, Edwards JH, Kidd KK, Lalouel J-M, Morton NE, Ott J, White R (1985) Report of the 391
committee on methods of linkage analysis and reporting. Cytogenet Cell Genet 40:356-359 392
Covas MI (2008) Bioactive effects of olive oil phenolic compounds in humans: reduction of heart disease 393
factors and oxidative damage. Inflammopharmacol 16:216-218. doi:10.1007/s10787-008-8019-6 394
Churchill GA, Doerge RW (1994) Empirical threshold values for quantitative trait mapping. Genetics 395
138:963-971 396
Dabbou S, Chaieb I, Rjiba I, Issaoui M, Echbili A, Nakbi A, Gazzah N, Hammami M (2012) Multivariate 397
data analysis of fatty acid content in the classification of olive oils developed through controlled 398
crossbreeding. J Am Oil Chem 89:667-674. doi:10.1007/s11746-011-1946-1 399
Dabbou S, Chehab H, Taticchi A, Servili M, Hammami M (2015) Content of fatty acids and phenolics in 400
coratina olive oil from tunisia: influence of irrigation and ripening. Chem Biodiv 12:397-406. 401
doi:10.1002/cbdv.201400142 402
Dabbou S, Rjiba I, Echbili A, Gazzah N, Mechri B, Hammami M (2010) Effect of controlled crossing on 403
the triglyceride and fatty acid composition of virgin olive oils. Chem Biod 7:1801-1813. 404
doi:10.1002/cbdv.200900385 405
De la Rosa R, Arias-Calderón R, Velasco L, León L (2016) Early selection for oil quality components in 406
olive breeding progenies. Eur J Lipid Sci Technol 118:1160–1167. doi:10.1002/ejlt.201500425 407
De la Rosa R, Kiran AI, Barranco D, Leon L (2006) Seedling vigour as a preselection criterion for short 408
juvenile period in olive breeding. Austr J Agric Res 57:477-481. doi:10.1071/ar05219 409
Di Bella G, Maisano R, La Pera L, Lo Turco V, Salvo F, Dugo G (2007) Statistical characterization of 410
sicilian olive oils from the Peloritana and Maghrebian zones according to the fatty acid profile. J 411
Agric Food Chem 55:6568-6574. doi:10.1021/jf070523r 412
Dominguez-Garcia MC, Belaj A, De la Rosa R, Satovic Z, Heller-Uszynska K, Kilian A, Martin A, 413
Atienza SG (2012) Development of DArT markers in olive (Olea europaea L.) and usefulness in 414
variability studies and genome mapping. Sci Hortic 136:50-60. oi:10.1016/j.scienta.2011.12.017 415
EC (2007) European Commission regulation. No. 702/2007. (2007). Ofiicial Journal of European 416
El-Soda M, Malosetti M, Zwaan BJ, Koornneef M, Aarts MGM (2014) Genotype x environment 418
interaction QTL mapping in plants: lessons from Arabidopsis. Trends Plant Sci 19:390-398. 419
doi:10.1016/j.tplants.2014.01.001 420
FAOSTAT (2013) Food and Agriculture Organization or the United Nations, Statistics division. 421
http://faostat3.fao.org/download/Q/QC/E. 422
Font i Forcada C, Fernández i Martí A, Socias i Company R (2012) Mapping quantitative trait loci for 423
kernel composition in almond. BMC Genetics 13:47 424
Frías L, García-Ortiz A, hermoso M, Jiménez A, Llavero del Pozo MP, Morales J, Ruano T, Uceda M 425
(1991) Analistas de laboratorio de almazara. Informaciones Técnicas 6/91 426
Garces R, Mancha M (1993) One-step lipid extraction and fatty acid methyl esters preparation from fresh 427
plant tissues. Anal Biochem 211:139-143. doi:10.1006/abio.1993.1244 428
Gibson KJ (1993) Palmitoleate formation by soybean stearoyl-acyl carrier protein desaturase. Biochim 429
Bioph Acta 1169:231-235. doi:10.1016/0005-2760(93)90245-5 430
Grattapaglia D, Bertolucci FL, Sederoff RR (1995) Genetic mapping of QTLs controlling vegetative 431
propagation in Eucalyptus grandis and E. urophylla using a pseudo-testcross strategy and RAPD 432
markers. Theor Appl Genet 90:930-947 433
Gunstone FD (1992) Fatty acid structure. In: Gunstone FD, Harwood JL, Padley FB (eds) The lipid 434
handbook, 2nd edn. Chapman and Hall, London (UK), pp 1-19 435
Gutiérrez F, Jímenez B, Ruíz A, Albi MA (1999) Effect of olive ripeness on the oxidative stability of 436
virgin olive oil extracted from the varieties picual and hojiblanca and on the different 437
components involved. J Agric Food Chem 47:121-127. doi:10.1021/jf980684i 438
Haralampidis K, Milioni D, Sanchez J, Baltrusch M, Heinz E, Hatzopoulos P (1998) Temporal and 439
transient expression of stearoyl-ACP carrier protein desaturase gene during olive fruit 440
development. J Exp Botany 49:1661-1669 441
Harwood JL (2005) Fatty acid biosynthesis. In: Murphy DJ (ed) Plant Lipids. Blackwell Publishing, 442
Oxford (UK), pp 27-101 443
Hayatsu H, Arimoto S, Negishi T (1988) Dietary inhibitors of mutagenesis and carcinogenesis. Mutation 444
Research - Fundamental and Molecular Mechanisms of Mutagenesis 202:429-446. 445
doi:10.1016/0027-5107(88)90204-7 446
Hernandez ML, Guschina IA, Martinez-Rivas JM, Mancha M, Harwood JL (2008) The utilization and 447
desaturation of oleate and linoleate during glycerolipid biosynthesis in olive (Olea europaea L.) 448
callus cultures. J Exp Botany 59:2425-2435. doi:10.1093/jxb/ern121 449
Hernandez ML, Mancha M, Martinez-Rivas JM (2005) Molecular cloning and characterization of genes 450
encoding two microsomal oleate desaturases (FAD2) from olive. Phytochemistry 66:1417-1426. 451
doi:10.1016/j.phytochem.2005.04.004 452
Hernandez ML, Padilla MN, Mancha M, Martinez-Rivas JM (2009) Expression analysis identifies FAD2-453
2 as the olive oleate desaturase gene mainly responsible for the linoleic acid content in virgin 454
olive oil. J Agric Food Chem 57:6199-6206. doi:10.1021/jf900678z 455
Hernández ML, Padilla MN, Sicardo MD, Mancha M, Martínez-Rivas JM (2011) Effect of different 456
environmental stresses on the expression of oleate desaturase genes and fatty acid composition in 457
olive fruit. Phytochemistry 72:178-187. doi:10.1016/j.phytochem.2010.11.026 458
Hernández ML, Sicardo MD, Martínez-Rivas JM (2016) Differential contribution of endoplasmic 459
reticulum and chloroplast ω-3 fatty acid desaturase genes to the linolenic acid content of olive 460
(Olea europaea) fruit. Plant Cell Physiol. 57:138-151. doi:10.1093/pcp/pcv159 461
Jansen RC (1993) Interval mapping of multipli quantitative trait loci. Genetics 135:205-211 462
Jansen RC (1994) Controlling the type I and type II errors in mapping quantitative trait loci. Genetics 463
138:871-881 464
Jansen RC, Stam P (1994) High resolution of quantitative traits into multiple loci via interval mapping. 465
Genetics 136:1447-1455 466
Jimenez Herrera B, Rivas Velasco A, Sanchez-Ortiz A, Lorenzo Tovar ML, Ubeda Munoz M, Callejon 467
RM, Ortega Bernaldo de Ouiros E (2012) Influence of fruit maturation process on the sensory 468
quality of virgin olive oils from Picual, Hojiblanca and Picudo cultivars. Grasas y Aceites 469
63:403-410. doi:10.3989/gya.058212 470
Knott SA, Neale DB, Sewell MM, Haley CS (1997) Multiple marker mapping of quantitative trait loci in 471
an outbred pedigree of loblolly pine. Theor Appl Genet 94:810-820 472
Lander ES, Botstein D (1989) Mapping Mendelian factors underlying quantitative traits using RFLP 473
linkage maps. Genetics 121:185-199 474
Lavee S, Avidan B, Meni Y (2003) 'Askal', a new high-performing oil variety for intensive and super-475
intensive olive orchards. Olivae 97:7 476
Lavee S, Harshemesh H, Haskal A, Trapero A, Metzidakis IT, Voyiatzis DG (1999) 'Maalot' a new 477
cultivar for oil extraction resistant to Spilocaea oleagina (Cast). Acta Horticulturae 474:125-128 478
Lavee S, Haskal A, Wodner M (1986) 'Barnea' a new olive cultivar from first breeding generation. Olea 479
17:95-99 480
Leon L, De la Rosa R, Gracia A, Barranco D, Rallo L (2008) Fatty acid composition of advanced olive 481
selections obtained by crossbreeding. J Sci Food Agric 88:1921-1926 482
Leon L, Martin LM, Rallo L (2004a) Phenotypic correlations among agronomic traits in olive progenies. 483
J Am Soc Hortic Sci 129:271-276 484
León L, Uceda M, Jiménez A, Martín LM, Rallo L (2004b) Variability of fatty acid composition in olive 485
(Olea europaea L.) progenies. Spanish J Agric Res 2:353-359 486
Li X, Quigg RJ, Zhou J, Xu SS, Masinde G, Mohan S, Baylink DJ (2006) A critical evaluation of the 487
effect of population size and phenotypic measurement on QTL detection and localization using a 488
large F2 murine mapping population. Genet Mol Biol 29:166-173 489
Liu P, Wang CM, Li L, Sun F, Liu P, Yue GH (2011) Mapping QTLs for oil traits and eQTLs for oleosin 490
genes in jatropha. BMC Plant Biol 11:132. doi:10.1186/1471-2229-11-132 491
Maedler K, Spinas GA, Dyntar D, Moritz W, Kaiser N, Donath MY (2001) Distinct effects of saturated 492
and monounsaturated fatty acids on β-cell turnover and function. Diabetes 50:69-76 493
Martinez-Suarez JM, Muñoz-Arnada E, Alba-Mendoza J, Lanzón-Rey A (1975) Report about the use of 494
the 'Abencor' yields analyser. Grasas y Aceites 26:379-385 495
Montoya C, Cochard B, Flori A, Cros D, Lopes R, Cuellar T, Espeout S, Syaputra I, Villeneuve P, Pina 496
M, Ritter E, Leroy T, Billotte N (2014) Genetic architecture of palm oil fatty acid composition in 497
cultivated oil palm (Elaeis guineensis Jacq.) compared to its wild relative E. oleifera (H.B.K) 498
Cortés. PLoS ONE 9: e95412. doi:10.1371/journal.pone.0095412 499
Montoya C, Lopes R, Flori A, Cros D, Cuellar T, Summo M, Espeout S, Rivallan R, Risterucci AM, 500
Bittencourt D, Zambrano JR, Alarcon WH, Villeneuve P, Pina M, Nouy B, Amblard P, Ritter E, 501
Leroy T, Billotte N (2013) Quantitative trait loci (QTLs) analysis of palm oil fatty acid 502
composition in an interspecific pseudo-backcross from Elaeis oleifera (HBK) Cort,s and oil 503
palm (Elaeis guineensis Jacq.). Tree Genet Genomes 9:1207-1225. doi:10.1007/s11295-013-504
0629-5 505
Olías JM, Pérez AG, Ríos JJ, Sanz LC (1993) Aroma of virgin olive oil: Biogenesis of the "green" odor 506
notes. J Agric Food Chem 41:2368-2373 507
Pérez-Vich B, Knapp SJ, Leon AJ, Fernández-Martínez JM, Berry ST (2004) Mapping minor QTL for 508
increased stearic acid content in sunflower seed oil. Mol Breed 13:313-322. 509
doi:10.1023/B:MOLB.0000034081.40930.60 510
Pérez AG, León L, Pascual M, Romero-Segura C, Sánchez-Ortiz A, De La Rosa R, Sanz C (2014) 511
Variability of virgin olive oil phenolic compounds in a segregating progeny from a single cross 512
in Olea europaea L. and sensory and nutritional quality implications. PLoS ONE 9: e92898 513
Poghosyan ZP, Haralampidis K, Martsinkovskaya AI, Murphy DJ, Hatzopoulos P (1999) Developmental 514
regulation and spatial expression of a plastidial fatty acid desaturase from Olea europaea. Plant 515
Physiol Biochem 37:109-119 516
Quintero-Florez A, Sinausia Nieva L, Sanchez-Ortiz A, Beltran G, Perona JS (2015) The fatty acid 517
composition of virgin olive oil from different cultivars is determinant for foam cell formation by 518
macrophages. J Agric Food Chem 63:6731-6738. doi:10.1021/acs.jafc.5b01626 519
Rallo L, Barranco D, De la Rosa R, Leon L (2008) 'Chiquitita' olive. Hortscience 43:3 520
Rietjens SJ, Bast A, Haenen GRMM (2007) New insights into controversies on the antioxidant potential 521
of the olive oil antioxidant hydroxytyrosol. J Agric Food Chem 55:7609-7614. 522
doi:10.1021/jf0706934 523
Rondanini DP, Castro DN, Searles PS, Rousseaux MC (2011) Fatty acid profiles of varietal virgin olive 524
oils (Olea europaea L.) from mature orchards in warm arid valleys of Northwestern Argentina 525
(La Rioja). Grasas y Aceites 62:399-409. doi:10.3989/gya.125110 526
Rotondi A, Magli M, Morrone L, Alfei B, Pannelli G (2013) Italian national database of monovarietal 527
extra virgin olive oils. The Mediterranean Genetic Code - Grapevine and Olive. doi:39064 528
Sabetta W, Blanco A, Zelasco S, Lombardo L, Perri E, Mangini G, Montemurro C (2013) Fad7 gene: 529
identification and fatty acids phenotypic variation in an olive collection by EcoTILLING and 530
sequencing approaches. Plant Physiol Biochem 69:1-8. doi:10.1016/j.plaphy.2013.04.007 531
Santos-Antunes AF, León L, De la Rosa R, Alvarado J, Mohedo A, Trujillo I, Rallo L (2005) The length 532
of the juvenile period in olive as influenced by vigor of the seedlings and the precocity of the 533
parents. HortScience 40:1213-1215. 534
Schwingshackl L, Hoffmann G (2014) Monounsaturated fatty acids, olive oil and health status: A 535
systematic review and meta-analysis of cohort studies. Lipids Health Dis 13: 154 536
Sewell MM, Bassoni DL, Megraw RA, Wheeler NC, Neale DB (2000) Identification of QTLs influencing 537
wood property traits in loblolly pine (Pinus taeda L.). Physical wood properties. Theor Appl 538
Genet 101:1273-1281 539
Shanklin J, Cahoon EB (1998) Desaturation and related modifications of fatty acids. Ann Rev Plant 540
Physiol Plant Mol Biol 49:611-641. doi:10.1146/annurev.arplant.49.1.611 541
Singh R, Tan SG, Panandam JM, Rahman RA, Ooi LCL, Low E-TL, Sharma M, Jansen J, Cheah S-C 542
(2009) Mapping quantitative trait loci (QTLs) for fatty acid composition in an interspecific cross 543
of oil palm. BMC Plant Biol 9:114. doi:10.1186/1471-2229-9-114 544
Socquet-Juglard D, Duffy B, Pothier JF, Christen D, Gessler C, Patocchi A (2013) Identification of a 545
major QTL for Xanthomonas arboricola pv. pruni resistance in apricot. Tree Genet Genomes 546
9:409-421 547
Uceda M, Beltrán G, Jimenez A (2005) Composición del aceite In: Rallo L, Barranco D, Caballero J et al. 548
(eds) Las variedades de olivo cultivadas en España. Libro II. Variabilidad y selección. Junta de 549
Andalucía, MAPA and Ediciones Mundi-Prensa, Madrid (Spain), pp 357-372 550
Uceda M, Hermoso JF, García-Ortiz A, Jimenez A, Beltran G (1999) Intraspecific variation of oil 551
contents and the characteristics of oils in olive cultivars. Acta Horticulturae 474:4 552
Vales MI, Schön CC, Capettini F, Chen XM, Corey AE, Mather DE, Mundt CC, Richardson KL, 553
Sandoval-Islas JS, Utz HF, Hayes PM (2005) Effect of population size on the estimation of 554
QTL: a test using resistance to barley stripe rust. Theor Appl Genet 111:1260-1270 555
van Ooijen JW (1992) Accuracy of mapping quantitative trait loci in autogamous species. Theor Appl 556
Genet 84:803-811. doi:10.1007/bf00227388 557
Van Ooijen JW (2004) MapQTL(R) 5, Software for the mapping of quantitative trait loci in experimental 558
populations. Kyazma B.V., Wageningen, The Netherlands. 559
Velasco L, Fernández-Cuesta A, De La Rosa R, Victoria Ruiz-Méndez M, León L (2014) Selection for 560
some olive oil quality components through the analysis of fruit flesh. J Am Oil Chem 91:1731-561
1736 562
Voelker T, Kinney AJ (2001) Variations in the biosynthesis of seed-storage lipids. Ann Rev Plant Biol, 563
vol 52: 335-361 564
Voorrips RE (2002) MapChart: Software for the graphical presentation of linkage maps and QTLs. J 565
Hered 93:77-78 566
Vos E (2003) Linoleic acid, 'vitamin F6'- is the Western World getting too much? Probably. Lipid 567
Technol 15:81-84 568
Wassom JJ, Mikkelineni V, Bohn MO, Rocheford TR (2008) QTL for fatty acid composition of maize 569
kernel oil in Illinois High Oil x B73 backcross-derived lines. Crop Sci 48:69-78. 570
doi:10.2135/cropsci2007.04.0208 571
Were BA, Onkware AO, Gudu S, Welander M, Carlsson AS (2006) Seed oil content and fatty acid 572
composition in East African sesame (Sesamum indicum L.) accessions evaluated over 3 years. 573
Field Crops Res 97:254-260. doi:10.1016/j.fcr.2005.10.009 574
Ying JZ, Shan JX, Gao JP, Zhu MZ, Shi M, Lin HX (2012) Identification of quantitative trait loci for 575
lipid metabolism in rice seeds. Mol Plant 5:865-875. doi:10.1093/mp/ssr100 576
Zhao J, Dimov Z, Becker HC, Ecke W, Möllers C (2008) Mapping QTL controlling fatty acid 577
composition in a doubled haploid rapeseed population segregating for oil content. Mol Breed 578 21:115-125. doi:10.1007/s11032-007-9113-y 579 580 581
gapu90 olPt767337 olPt511506 olPt580996 olPt773341 olPt769329 olPt580720 olPt580086 olPt774117 olPt511715 olPt581374 olPt768954 Linolenic Pic_15 olPt771146 olPt772192 olPt510727 Dca_3 Linolenic olPt773274 olPt511823 olPt510489 olPt512012 olPt579964 olPt582215 olPt581125 Emo30 Pic_5 olPt510860 olPt510912 olPt767979 olPt511344 olPt577317 Dca_3 olPt772271 olPt511116 olPt767851 olPt578716 Emo30 olPt577042 olPt577298 olPt510780 olPt576512 olPt772570 olPt771651 olPt770973 olPt511612 olPt511542 Arb_5 olPt767507 olPt577543 olPt576816 olPt579127 olPt771410 olPt577888 olPt578524 olPt772239 olPt767737 olPt577689 olPt578380 olPt511416 olPt577816 olPt578432 olPt577763 olPt511719 olPt578794 olPt771421 olPt576674 udo_4 udo_25 olPt577141 olPt511473 Pa lmi to le ic Arb_13 olPt577795 olPt577284 olPt576788 olPt577439 olPt510590 olPt577364 olPt769833 olPt577324 olPt578828 olPt773060 olPt770391 olPt767401 olPt577618 olPt511706 olPt576243 olPt577316 olPt578148 olPt510743 Linolenic Arb_14 olPt579201 olPt578331 olPt771838 olPt578683 olPt577620 olPt579002 olPt576677 Linolenic Arb_19 olPt767430 olPt578885 olPt576186 olPt578159 olPt771304 olPt772057 olPt510234 olPt766771 Mo n o u n sa t Po lyu n sa t R a tio _ o le ic/ lin o le ic O le ic Linoleic Arb_20 0 5 10 15 20 25 30 35 40 45 50 55 60 65 70 75 80 85 90 95 100 105 110
60 65 70 75 nn np Oleic (%)