Key Words: Value co-creation; open innovation; principal component analysis; linear regression analysis; empirical study; business intelligence tool.
Abstract. Value co-creation is an emerging marketing and innovation paradigm describing a broader opening of the firm to its customers by providing them with the opportunity to become active participants in the design and development of personalized products, services and experiences. However, there is not yet a fully satisfactory theoretical vision about its distinctive characteristics as compared to more tradi-tional value creation approaches. One of the challenges in studying value co-creation is the lack of business intelligence (BI) tools that can be used in the conceptualization of value co-creation practices. The present paper provides a preliminary vision for the development of such a BI tool and a first implementation that uses empirical research results in answering two research questions. The first question is: What are the principal components of value co-creation? The second question is: What is the relationship between the degree of firms’ involvement in value co-creation activities and their innovativeness?
I. Introduction
Value co-creation is an emerging business, marketing and innovation paradigm describing how customers and end users could be involved as active participants in the design and devel-opment of personalized products, services and experiences (Prahalad & Ramaswamy, 2004; Etgar, 2008; Payne, Storbacka, & Frow, 2008). It is based on the design and development of customer participation platforms providing firms with the tech-nological and human resources, tools and mechanisms to ben-efit from the engagement experiences of individuals and commu-nities as a new basis of value creation. The active participation of customers and end users is enabled through multiple inter-action channels, very often by means of specifically designed technological platforms through the Internet (Sawhney, Gianmario & Prandelli, 2005; Nambisan & Nambisan, 2008; Nambisan & Baron, 2009). Indeed, it is the advances in Information and Communications Technologies (ICT) that has enabled customers to be much more active, knowledgeable, globally aware and willing to use interactive virtual environments to personalize the existing and shape new products and services. The ability of value co-creation platforms to enable the personalization of new products and services challenges the operational presupposi-tions of traditional marketing segmentation techniques by pro-moting a new service-dominant logic (Vargo & Lusch, 2004; von Hippel, 2006a). The new dominant marketing logic enables firms to address broader heterogeneous markets aiming at a better fit between what a customer needs and what the firm does and offers. It entails a new vision of the topology and the dynam-ics of the entire value creation system including i) a shift from thinking about consumers to thinking about co-creators of value,
ii) a shift from thinking about value chains to thinking about value networks, iii) a shift from thinking about product value to thinking about network value, iv) a shift from thinking about simple co-operation or competition to thinking about complex co-opetition, and v) a shift from thinking about individual firm strategy to thinking about strategy in relation to the entire value ecosystem (Hearn & Pace, 2006). Such vision promotes a new understanding of the customer centricity of the traditional value network concept which is now considered dynamical, as a people-driven web of potential value configurations that could be actualized on the basis of specific customer demands (Norman & Ramirez, 1993; Flint & Mentzer, 2006; Prahalad & Krishnan, 2008).
The adoption of value creation practices leads to the need of “changing the very nature of engagement and relationship between the institution of management and its employees, and between them and co-creators of value - customers, stakehold-ers, partners or other employees” (Ramaswamy, 2009). This ongoing change challenges the management of innovations by promoting a new vision of the nature of innovation itself (Prahalad & Krishnan, 2008; Kristensson, Matthing & Johansson, 2008; Tanev, Knudsen & Gerstlberger, 2009). The new co-creative vision of innovation is built on two key distinctive features. The first one is the truly user-driven aspect of the value co-creation activities between firms and customers. In this sense, value co-creation platforms represent a natural extension of some of the key aspects of the user-driven innovation paradigm (von Hippel, 2006) by focusing on the development of participation platforms to, literally, multiply the effect of user-driven innovation methods such as the design of innovation toolkits (von Hippel, 2001; Nambisan & Nambisan, 2008; Nambisan & Baron, 2009) and searching for lead users (von Hippel, 2006b; Bilgram, Brem & Voigt, 2008; Droge, C., Stanko, M. & Pollitte, W., 2009). Another distinctive feature is the focus on the opetitive (from co-opetition) nature of the interactions between the different stake-holders, including the customers and end users, participating in the value co-creation process. Before competing and negotiating to capture value, the different players in a value co-creation network need to compete and negotiate in order to be able to participate and to contribute value (Tanev, Knudsen & Gerstlberger, 2009). The opetitive dimension of value co-creation platforms leads to a more dynamic type of economic mechanisms as underlying driver of the innovation processes. These mechanisms operate on the basis of multiple transac-tions between customers, partners and suppliers at multiple access points across the value network. They enable customers and end users to control the relationship between price and user experience (Prahalad & Ramaswamy, 2004; Etgar, 2006) by providing them with the opportunity to actualize (i.e., create) specific value chain configurations that would fit their proper
A Business Intelligence Tool for Studying
Value Co-creation and Innovation
need, context and preferences. It is in this context that we could talk about customer value co-creation. Although focusing on the proactive role of the customer, such understanding is generically holistic in nature; it embraces all the actors involved in the value creation process providing an opportunity for firms to broaden the boundaries of their open innovation processes.
The objective of this article is to report the research in-sights from the development of a business intelligence tool that is based on an empirically-derived quantitative model describing the relationship between the degree of firms’ value co-creation activities and their innovativeness. The tool is used to identify the key components of value co-creation based on a methodology using web search generated data and Principal Component Analy-sis (PCA) techniques and applies a similar, web search-based approach to evaluate firms’ innovativeness; finally, it uses linear regression analysis to examine the relationship between the degrees of value co-creation activities and firms’ innovativeness which is measured by the frequency of firms’ online comments about their new products, processes and services and by the number of new products, processes and services in the last
three years. The underlying hypotheses of this research are as follows:
• H1: Firms with a higher degree of involvement in co-creation activities are in a better position to articulate the inno-vative aspects of their new products, processes and services.
• H2: Firms with a higher degree of involvement in co-creation activities are in a better position to introduce new products, processes and services.
The testing of this hypothesis is particularly relevant within the context of an increasingly global competitive environment where firms are struggling with the limits of their innovation capacity through investments in greater product variety and in traditional marketing techniques that do not necessarily lead to a better competitive positioning, innovation and differentiation (Prahalad et al., 2004, 2008).
II. Methodology
Hicks et al. (2006) and Ferrier (2001) pioneered the concept that an analysis of the frequency of use of specific keywords on public websites and corporate news releases can be an adequate representation of the degree of importance the firms place on the concepts those keywords were chosen to represent. Allen et al. (2009ab) and Tanev et al. (2010ab)
provided preliminary results demonstrating that this concept could be applied to classify value co-creation practices and articulated the key steps of the data gathering and analysis work flow. These research studies show that factor analysis of the frequencies of a specifically designed set of keywords can be used to extract the key components of value co-creation in a large sample of firms. The research methodology was further enhanced by Tanev et al. (2011) by adding an additional step focusing on: i) examining the perception of firms’ innovativeness by measuring the frequency of firms’ online comments about their new products processes and services, ii) estimating the innovation capacity of the firms by measuring the number of new products processes and services, iii) applying linear regression analysis to test the two hypotheses about the existence of a positive association between the degree of firms’ involvement in value co-creation activities and their innovativeness. The key difference in the approach adopted here can be summarized as follows. First, a new data collection was done by three different web search engines (Google, Yahoo, Bing) to measure the fre-quency of the keywords on firms’ websites. Second, the data
was collected by newly developed multi-functional search tool. The results are based on a convenience sample of 273 firms that were selected for being representative of the breadth of their value co-creation activities (table 1).
III. Summary of Results
1. Development of the ‘LuckySearch’ Business
Intelligence Tool
This section will focus on the details of the development and the functionality of the search tool. The application is devel-oped as a Windows Desktop program. It executes searches on Google, Yahoo! Search and Bing. The search queries are con-structed for each keyword and each company’s web site. Also one additional search is executed only with the company’s web site, to get the count of the pages in the web site. The output of the application is one (287x30) matrix (corresponding to # of firms X # of keywords) saved in Microsoft Excel file with the results of the searches executed against one of the search engines. The results are structured in a table with columns - the selected 29 keywords entered as an input + one column for the pages size of the web site; and rows - the 287 companies’ web sites. The data in the table is normalized: the number of pages beneath the site and the keyword counts normalized by the Type of firms Frequency Percent Cumulative Percent
1 GEN 65 23.8 23.8
2 ECL 133 48.7 72.5
3 OSS 75 27.5 100.00
Total 273 100.0
Table 1. Breakdown of sample organizations: ECL - firms members of the Eclipse Foundation, OSS - open source software firms, OSS+ECL - open source software firms members of the Eclipse Foundation, GEN - firms that are not open source
number of pages beneath the site. The application is able to execute simultaneous searches against one of the three search engines. The number of the simultaneously executed search may be preconfigured by the user of the application. The application is constructed in a way that supposes further development and integration with the SPSS software. The user interface is shown in figure 1.
To use the software application, the following steps must be executed:
• Import a text file that contains the predesigned key-words. Each keyword should be placed in a new line in the file or in the “Keywords” text area in the keyword application window.
• Import a text file that contains the web sites. Each web site should be placed in a new line in the file or in the “Websites” text area in the application window.
• Select a folder in the field “Output directory”, to specify the output directory where the excel file and the text files results should be collected.
• Choose the “Number of threads”, which specifies the parallel web searches executed at a given moment. It is recom-mended that this value is preset to 2, otherwise the search engine may reject the request to execute the web searches.
• To save the text content from the first found web pages should be parsed and saved in the specified output directory, check the field “Save text results”.
• To specify the number of the first found web pages, from the search engines, which are going to be parsed and their text content saved, choose the number from “Number of links” field.
• Click the “Search” button to start web search executions.
As the Bing and the .NET platforms have a common owner - Microsoft, there is plenty of documentation, articles and ex-amples how the Bing API can be used with the .NET development platform. There is an available Bing library written in .NET that can be used for the execution of web search requests. Yahoo! Search has its own .NET Developer Center with HOWTO articles and Community Resources where one can join mailing list and discuss the Yahoo! APIs (as well as OAuth Authorization class source in C# and VB.NET). The OAuth Authorization source saves a significant development tie and is appropriate to be used in this project. For Google there is an available .NET Client Library Developer’s Guide, which includes many tutorials and examples in .NET.
From version 14 onwards SPSS can be driven externally by a Python, R and .NET program using supplied “plug-ins”. So for the sake of convenience for the further development and integration with SPSS, one should focus on using development platforms such as: Python, R or .NET. Since the application uses Microsoft Excel fileñ as the output of the application, the devel-opment platform should have integration and possibility for out-put Excel files with filled results in it. Microsoft distributes MS Office libraries that can be used by external sources. They support almost all Windows development platforms including .NET. One advantage of .NET over Python is the possibility to use integrated modules for Windows Forms and the nice compatibil-ity between .NET and Windows’ Desktop. Having in mind all of the above, it was found to be most appropriate using the .NET platform and its most popular language C#. As a coding con-vention for the development we have chosen the one recom-mended by Microsoft.
All the search engines’ API supports a web response in XML, JSON and SOAP protocols. In this software XML responses are chosen to be used, as this is the most affirmative method today. For the development of the Bing part in the application, Bing API SDKwas used. It provides automatic authentication and search query construction. It is recommended to be used by Microsoft MSDN. The application - ”LuckySearch” is developed with three subprojects:
• The user interface is separated in individual sub-project. It contains the user settings, the windows forms interface and the class that outputs the Excel data file with the matrix results. This project manages the executed simultaneous threads.
• Module responsible for extracting the text from the web site content. It parses the web page and removes its HTML, Javascript and Flash code.
• Module responsible for executing web requests to the Google, Yahoo and Bing. It is also responsible for parsing the results from the Search engines. It determines the total number of results for a given requests, and also gathers the returned links in a lists.
The diagram shown in figure 2 describes the process actions steps that the application LuckySearch must execute to gather the search engines Excel data results and the text data results from the sites linked by the search engines.
2. Value Co-creation Components
Table 2 shows the specific composition of the extracted
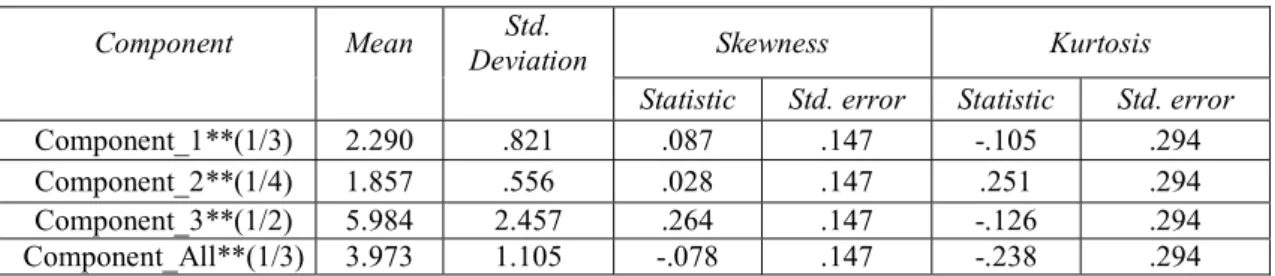
principal value co-creation components that was used to con-struct three value co-creation component variables for each of the firms in the sample (Tanev et al, 2010; Tanev et al, 2011). Based on these results, the first co-creation component was interpreted as “Resources, processes, tools and mechanisms enabling customer and user involvement in production, assem-bly, manufacturing and self-service aiming at design and pro-cess flexibility based on product modularity and sharing of in-ternal expertise, resources and IP.” The second co-creation component was interpreted as “Customer relationships enabled through partnerships and cooperation aiming at cost reduction, design and process flexibility, and leading to better customer and end user experiences based on risk management, transpar-ency and trust.” The third co-creation component was interpreted as “Mutual learning mechanisms based on the existence of user networking forums enabling customer suggestions, input, de-mands and requests, and leading to multiple options for users through involvement in test and beta trials.” Table 3 shows the descriptive statistics of the three co-creation variables that were constructed by adding up the ratings of each of the keywords weighted by their loadings.
3. Innovation-related Metrics
Table 4 shows the descriptive statistics of the three inno-vation metrics related to the number of new products, service and processes, together with the perception of innovativeness metric that was used by Tanev et al. (2010). It was measured
by the frequency of firms’ online comments about new products, services and processes and collected by means of the compos-ite keyword: new AND product OR service OR process OR appli-cation OR solution OR feature OR release OR version OR launch OR introduction OR introduce OR “new product” OR “new ser-vice” OR “new process” OR “new solution” OR “product launch.”
4. Linear Regression Analysis
The results from the linear regression analysis are pre-sented in table 5 including two different cases: the general type firms alone and the firms involved in OSS projects alone. The linear regression models for firms’ perception of innovativeness suggested by Tanev et al. (2010) are also included as a com-parison. The explanatory power is determined by the R square value.
5. Analysis of the Relation between Value
Co-creation and Innovation
The innovation capacity of the firms was measured by the number of their new products, services and processes. These results were compared to previous results about firms’ percep-tion of innovativeness that was measured by the frequency of online comments about firms’ new products, processes and services. It should be pointed out that the perception of innovativeness is not a traditional innovation metric since it does directly count the number of new products, processes and ser-vices but the frequency of online comments about them. It could
Component # 1 Loading customer+OR+user+produce+OR+assemble+OR+manufacture .727 product+OR+process+modularity+OR+modular+OR+module .705 customer+OR+user+IP+OR+”intellectual+property” .669 design+OR+process+flexibility+OR+flexible+OR+adaptable .599 internal+expertise+OR+resource .554 lease+OR+rent+OR+license+OR+“self+serve”+OR+“self+service” .550 product+OR+process+OR+service+evolution+OR+evolve .521 Component # 2 Loading customer+partnerships+OR+interaction+OR+relationship+ OR+participate+OR+participation+OR+activity+OR+action .778 customer+OR+user+risk+manage+OR+management+OR+control+OR+ assess+OR+reduce+OR+reduction+OR+potential+OR+ Exposure .698 customer+OR+user+cooperate+OR+cooperation+OR+ collaboration+OR+partnership .691 cost+reduce+OR+reduction+OR+saving .685 trust+OR+honesty+OR+integrity+OR+transparency .647 customer+OR+user+experience .627 Component # 3 Loading customer+OR+user+learn+OR+learning .752 customer+OR+user+suggest+OR+suggestion+OR+input+OR+ request+OR+demand .737 customer+OR+user+OR+forum+OR+connect+OR+network+OR+ networking .716 customer+OR+user+options+OR+choice+OR+choose .524 customer+OR+user+test+OR+trial+OR+beta .512
Table 2. Composition of the three principal value co-creation components
Component Mean Deviation Std. Skewness Kurtosis
Statistic Std. error Statistic Std. error
Component_1**(1/3) 2.290 .821 .087 .147 -.105 .294 Component_2**(1/4) 1.857 .556 .028 .147 .251 .294 Component_3**(1/2) 5.984 2.457 .264 .147 -.126 .294 Component_All**(1/3) 3.973 1.105 -.078 .147 -.238 .294
Table 3. Descriptive statistics of the three principal component variables
Innovation metric Mean Std.
Deviation Skewness Kurtosis
Statistic Std. Error Statistic Std. error
New products**(1/5) 1.025 0.727 -0.144 0.150 -0.421 0.300
New services**(0.27) 0.748 0.747 0.411 0.150 -0.647 0.300
New processes**(1/3) 0.411 0.617 1.011 0.150 -0.533 0.300
Perception**(1/2) 4.745 1.760 -0.126 0.147 -0.286 0.294
be expected, however, that this frequency will be proportional to the number of new products, processes and services. In this sense, there is an opportunity by properly “calibrating” or opti-mizing the perception metric to construct a modified innovation metric that would be based on information available online and that could be used for an automated quick estimation of firms’ overall innovation capacity.
Indeed, the application of correlation analysis indicates that there is a modest statistically significant positive associa-tion between the percepassocia-tion of firms’ innovativeness and their number of newly introduced products. The Pearson correlation coefficient is 0.155 (p < 0.025) suggesting that only 15% of the perception metric corresponds to comments about the introduc-tion of new products, the rest being related to discussing the innovative features of existing produces. The correlation between the perception of innovativeness and the number of new service and processes was found to be statistically insignificant.
A closer examination of the linear regression results leads to a number of findings.
First, in the case of the entire research sample, there is no statistically significant relationship between value co-creation and innovation. This situation is different from the one studied by Tanev et al. (2010) where in this case there was a positive association between firms’ extent of value co-creation activities and the perception of their innovativeness.
Second, in the case of firms involved in OSS projects, there is no statistically significant relationship between value co-creation and innovation. Again, this situation is different from the one studied by Tanev et al. (2010) where for this type of firms there was a positive association between firms’ extent of value co-creation activities and the perception of their innovativeness.
Third, statistically significant models were found in the case of general type firms alone. The second value co-creation component “Customer relationships enabled through partner-ships and cooperation” appears as the only independent variable in the model describing its relationship to the number of new products (table 5, Model 1). This finding is similar to the one suggested by Tanev et al. (2010) where in the case of general type firms there was a positive association between the percep-tion of innovapercep-tion and the second co-creapercep-tion component (table 5, Model 4). The key difference is that in the present case the explanatory power of the model is only 13.8%, as compared to 43.1% in the other case. However, the lower explanatory power corresponds to the modest level of correlation between the innovation and perception metrics. It is important to point out that the second co-creation component has the lowest rate of use as compared to the other two co-creation components (Tanev et al., 2010) but it happens to be the component that provides the statistical evidence in support of our initial hypothesis about the
existence of a positive relationship between the innovative ca-pacity of firms and the extent of their value co-creation activities.
Fourth, there is a positive association between the first co-creation component “Resources, processes, tools and mecha-nisms enabling customer and user involvement in production, assembly, manufacturing and self-service,” and the total number of firms’ new products and services (table 5, Model 2). An additional analysis suggests that in this case the value co-creation activities appear to be more beneficial in terms of firms’ potential for new service introduction (table 5, Model 3). Such positive association is similar to one of the findings of Tanev et al. (2010) suggesting a positive association between the total value co-creation component and firms’ perception of innovation (Table 5, Model 4). However, again, the explanatory power in the present case is 15.2%, as compared to 43.1% in the other case. Models 2 and 3 (table 5) suggests a higher relevance of the first co-creation component as compared to the previous study. This is a new finding that needs to be further studied.
References
1. Allen, S., S. Tanev & T. Bailetti. Components of Co-creation. Special Issue on Value Co-creation. Open Source Business Review Online Jour-nal, November, 2009a. <www.osbr.ca/ojs/index.php/osbr/article/view/ 991/954>.
2. Allen, S., S. Tanev, & T. Bailetti. Towards the Development of Research Methodology for Studying the Nature of Value Co-creation in Internet-driven Businesses. Proceedings of the Fifth International Conference on Software, Services & Semantic Technologies, Dicheva, D., R. Nikolov & E. Stefanova, Eds., Sofia University, Bulgaria, 2009b, 200-209.
3. Ballantyne, D. Dialog and its Role in the Development of Relationship Specific Knowledge. - Journal of Business and Industrial Marketing, 19 (2), 2004, 114-123.
4. Ballantyne, D & R. Varey. The Service-dominant Logic and the Future of Marketing. - Journal of the Academy of Marketing Science, 36, 2008, 11-14.
5. Bilgram, V., A. Brem & K.-I. Voigt. User-centric Innovations in New Product Development - Systematic Identification of Lead Users Harness-ing Interactive and Collaborative Online-tools. - International Journal of Innovation Management, 12(3), 2008, 419-458.
6. Bogers, M., A. Afuah & B. Bastian. Users as Innovators: a Review, Critique, and Future Research Directions. - Journal of management, 36 (4), 2010, 857-875.
7. Bolton, R. & S. Saxena-Iyer. Interactive Services: a Framework, Synthesis and Research Directions. - Journal of Interactive Marketing, 23, 2009, 91-104.
8. Bonsu, S. & A. Darmody. Co-creating Second Life - Market-consumer Cooperation in Contemporary Economy. - Journal of Macromarketing, 28 (4), 2008, 355-368.
9. Bowonder, B., A. Dambal, S. Kumar & A. Shirodkar. Innovation Strategies for Creating Competitive Advantage. - Research-technology Management, 53 (3), 2010, 19-32.
10. Brohman, M., G. Piccoli, P. Martin, F. Zulkernine, A. Parasuraman, R. Watson, R. A Design Theory Approach to Building Strategic Network-based Customer Service Systems.
Type of firm Model Linear regression model Expl. power
1 New products = const + 0.599 * C#2 13.8% General firms 2 New (products + services) = const + 0.554 * C#1 15.2% 3 New services = const + 0.330 * C#1 14.5% 4 Perception = const + 0.657 * C#2 43.1%
Table 5. Linear regression results about value co-creation and innovation-related outcomes. The results for the perception of innovativeness are from Tanev et al. (2010).
- Decision Sciences, 40 (3), 2009, 403-430.
11. Chandra, Y. & N. Coviello. Broadening the Concept of International Entrepreneurship: ‘Consumers as International Entrepreneurs’. - Jour-nal of World Business, 45, 2010, 228-236.
12. Chesbrough, H. W. The Era of Open Innovation. - MIT Sloan Management Review 44 (3), 2003, 35-41.
13. Cova, B. & R. Salle. Marketing Solutions in Accordance with the S-D Logic: Co-creating Value with Customer Network Actors. - Industrial Marketing Management, 37, 2008, 270-277.
14. Dahan, N., J. Doh, J. Oetzel & M. Yaziji, M. Corporate-NGO Collabo-ration: Co-creating New Business Models for Developing Markets. - Long Range Planning, 43, 2010, 326-342
15. Dong, B., K. Evans & S. Zou. The Effects of Customer Participation in Co-created Service Recovery. - Journal of the Academy of Marketing Science, 36, 2008, 123-137.
16. Droge, C., M. Stanko & W. Pollitte. Lead Users and Early Adopters on the Web: The Role of New Technology Product Blogs. - Journal of Product Innovation Management, 27, 2010, 66-82.
17. Edvardsson, B., B. Enquist & R. Johnston. Cocreating Customer Value through Hyperreality in the Prepurchase Service Experience. -Journal of Service Research, 8, 2005, 149-161.
18. Elenurm, T. & A. Moisala. Human Resources for Entrepreneurship: Comparing Orientations of Estonian and Finnish Business Students.-European Journal of International Management, 2 (4), 2008, 454-470. 19. Etgar, M. Co-production of Services. Ch. 11 in Lusch, R. & S. Vargo Eds. The Service Dominant Logic of Marketing. Armonk, NY: M. E. Sharpe Inc, 2006.
20. Etgar, M. A Descriptive Model Of The Consumer Co-Production Process. - Journal of The Academy of Marketing Science, 36 (1), 2008, 97-108.
21. Ferguson, R. & M. Paulin. Customer Sociability and the Total Service Experience: Antecedents of Positive Word-of-mouth Intentions. - Journal of Service Management, 21(1), 2010, 25-44.
22. Ferrier, W. Navigating the Competitive Landscape: The Drivers and Consequences of Competitive Aggressiveness. - Academy of Manage-ment Journal, 44 (4), 2001, 858-877.
23. Field, A. Discovering Statistics Using SPSS. Thousand Oaks, CA, Sage Publications, 2005.
24. Flint, D. & J. Mentzer. Striving for Integrated Value Chain Manage-ment Given a Service-Dominant Logic of Marketing. Ch. 11 in Lusch, R. & S. Vargo Eds. The Service-dominant Logic of Marketing. Armonk, NY: M. E. Sharpe Inc, 2006, 139-149.
25. Franke, N. & M. Schreier. Product Uniqueness as a Driver of Customer Utility in Mass Customization. - Marketing Letters, 19 (2), 2008, 93-107.
26. Füller, J. Refining Virtual Co-creation from a Consumer Perspective. - California Management Review, 52 (2), 2010, 98-122.
27. Hearn, G & C. Pace. Value-creating Ecologies: Understanding Next Generation Business Systems. - Foresight, 8(1), 2006, 55-65. 28. Hicks, D., D. Libaers, L. Porter & D. Schoeneck. Identification of the Technology Commercialization Strategies of Hightech Small Firms. -Small Business Research Summary, December, 2006. Available at: http://www.sba.gov/advo/research/rs289tot.pdf.
29. Jaworski & Kohli. Co-Creating the Voice of The Customer. Ch. 8 in Lusch, R. & S. Vargo Eds. The Service Dominant Logic of Marketing. Armonk, NY: M. E. Sharpe Inc., 2006.
30. Kohler, T., K. Matzler, J. Fuller. Avatar-based Innovation: Using Virtual Worlds for Real-World Innovation. Technovation, 29, 2008, 395-407. 31. Kristenson, P., J. Matthing & N. Johansson. Key Strategies for the Successful Involvement of Customers in the Co-creation of New Tech-nology-based Services. - International Journal of Service Industry Man-agement, 19 (4), 2008, 474-491.
32. Maglio, P. & J. Spohrer. Fundamentals of Service Science. - Journal of the Academy of Marketing Science, 36, 2008, 18-20.
33. Michel, S., S. Brown & A. Gallan. An Expanded and Strategic View on Discontinuous Innovations: Deploying a Service-dominant Logic of Marketing. - Journal of the Academy of Marketing Science, 36 (1), 2008, 54-66.
34. Midgley, D. Co-creating the Innovation with Customers. Ch. 5 in the Innovation Manual - Integrating Strategies and Practical Tools for
Bring-ing Value Innovation to the Market. Chichester, UK: John Wiley & Sons, 2009, 143-190.
35. Nambisan, S. & R. Baron. Interactions in Virtual Customer Environ-ments: Implications for Products Support and Virtual Customer Relation-ship Management. - Journal of Interactive Marketing, 21 (2), 2007, 42-62.
36. Nambisan, S. & P. Nambisan. How to Profit From a Better ‘Virtual Customer Environment’. - MIT Sloan Management Review, 49 (3), 2008, 53-61.
37. Nambisan, S. & A. Baron. Virtual Customer Environments: Testing a Model of Voluntary Participation in Value Cocreation Activities. -Journal of Product Innovation Management, 26, 2009, 388-406. 38. Nambisan, S. Virtual Customer Environments: IT-Enabled Customer Co-innovation and Value Co-creation. Nambisan, S. (Ed.). Information Technology and Product Development. - Annals of Information Sys-tems, 5 (2), 2009, 109-127.
39. Ng, I., R. Maull & N. Yip. Outcome-based Contracts as a Driver for Systems Thinking and Service-dominant Logic in Service Science: Evi-dence from the Defence Industry. - European Management Journal, 27, 2009, 377- 387.
40. Norman, R. & R. Ramirez. From Value Chain to Value Constellation: Designing Interactive Strategy. - Harvard Business Review, 71 (4), 1993, 65-77.
41. O’Hern, M. & A. Rindfleisch. Customer Co-creation: A Typology and Research Agenda. - Review of Marketing Research, 6, 2010, 84-106. 42. Ostrom, A., M. Bitner, S. Brown, K. Burkhard, M. Goul, V. Smith-Daniels, H. Demirkan & E. Rabinovich. Moving Forward and Making a Difference: Research Priorities for the Science of Service. - Journal of Service Research, 13 (4), 2010, 4-36.
43. Payne, A., K. Storbacka & P. Frow. Managing the Co-creation of Value. - Journal of the Academy of Marketing Science, 36, 2008, 83-96.
44. Pitelis, C. & J. David, D. Teece. Cross-border Market Co-creation, Dynamic Capabilities and the Entrepreneurial Theory of The Multinational Enterprise. - Industrial and Corporate Change, 19(4), 2010, 1247-1270.
45. Prahalad, C. K. & V. Ramaswamy. Co-opting Customer Compe-tence. - Harvard Business Review, January-February, 2000, 79-87. 46. Prahalad, C. K. & V. Ramaswamy. The New Frontier of Experience Innovation. - MIT Sloan Management Review, 44 (4), 2003, 12-18. 47. Prahalad, C. K. & V. Ramaswamy. Co-opting Customer Compe-tence. - Harvard Business Review, January-February, 2000, 79-87. 48. Prahalad, C. K. & M. S. Krishnan. The New Age of Innovation. New York: McGraw Hill, 2008.
49. Ramaswamy, V. Leading the Transformation to Co-creation of Value. - Strategy & Leadership, 37 (2), 2009, 32-37.
50. Ramaswamy, V. & F. Gouillart. Building the Co-creative Enterprise. - Harvard Business Review, October, 2010, 100-109.
51. Roberts, D., S. Bake & D. Walker, D. Can We Learn Together? Co-creating with Customers. - International Journal of Market Research, 47 (4), 2005, 407-427.
52. Romero, D. & A. Molina. Value Co-creation and Co-innovation: Linking Networked Organisations and Customer Communities. Leverag-ing Knowledge for Innovation in Collaborative Networks. IFIP Advances in Information and Communication Technology, 307, 2009, 401-412 53. Sawhney, M., V. Gianmario & E. Prandelli. Collaborating to Create: The Internet as Platform for Customer Engagement in Product Innova-tion. - Journal of Interactive Marketing, 19 (4), 2005, 4-17. 54. Soutaris, V. Technological Trajectories as Moderators of Firm-level Determinants of Innovation. - Research Policy, 31, 2002, 877-898. 55. Tanev, S., H. Milyakov, P. Durchev & P. Ruskov. Value Co-creation and Innovation. Proceedings, 3rd ICEIRD Conference, May 27-29, 2010, Novi Sad, Serbia, 722-732.
56. Tanev, S., P. Durchev, H. Milyakov & P. Ruskov. Value Co-creation in Open Source Firms ... and Beyond. Open Source Innovation (Beyond Software) Workshop, Strasbourg, France, Feb. 24-25, 2010b. http://cournot.u-strasbg.fr/users/osi/program/.
57. Tanev, S., M. Knudsen & W. Gerstlberger. Value Co-creation as Part of an Integrative Vision for Innovation Management. Special Issue on Value Co-creation, Open Source Business Review Online Journal,
De-Manuscript received on 8.04.2011
Dr. Stoyan Tanev is an Associate Professor in the Institute of Technology and Innovation and member of the Integrative Innovation Management (I2M) Research Unit at the University of Southern Denmark (SDU), Odense, Denmark. I2M is a research group operating across the faculties of social sciences and engineering. Before joining the I2M unit at SDU in August 2009, Dr. Tanev was a Faculty member in the Technology Innovation Management Program, Department of Systems and Com-puter Engineering, Carleton University, Ottawa, Ontario, Canada. Stoyan Tanev has a M.Sc. and Ph.D. in Physics (1995, jointly by the University of Sofia, Bulgaria, and the University Pierre and Marie Curie, Paris, France), a M.Eng. in Technology Management (2005, Carleton Univer-sity, Canada), and a M.A. (2009, University of Sherbrooke, Canada). His main research interests are in the fields of technology innovation man-agement, value co-creation and disruptive innovation management. Dr. Tanev teaches technology innovation, technology marketing and tech-nology management courses in the M.Sc. Engineering program “Prod-uct Development and Innovation” at SDU. He is also adjunct professor in the Department of System and Computer Engineering at Carleton University, Canada, as well as external lecturer in the Technology Entre-preneurship program at the Faculty of Mathematics and Informatics, University of Sofia “St Kliment Ohridski”, Bulgaria.
Contacts: Institute of Technology and Innovation University of Southern Denmark Niels Bohrs Alle 1, DK-5230 Odense M, Denmark Office A 203-A Tel. +45-6550-7518; Fax: +45-6550-7364 e-mail: tan@iti.sdu.dk Dr. Petko Ruskov is a head of the “Technological Entrepreneurship and Innovations in Information Technologies” master degree program at Sofia University.
He a leading IT/IS and technology entrepreneurship educator, researcher and consultant. With an engineering background he cooperate world-wide with academic and business community in promoting and creating new ventures, improving processes and applying technology for busi-ness and IT/IS students and professionals.
Contacts: http://bg.linkedin.com/in/petkoruskov e-mail: ruskov.petko@gmail.com cember, 2009. http://www.osbr.ca/ojs/index.php/osbr/article/view/1014/ 975.
58. Vargo, S. Customer Integration and Value Creation - Paradigmatic Traps and Perspectives. - Journal of Service Research, 11 (2), 2008, 211-215.
59. Vargo, S. L. & R. F. Lusch. Evolving to a New Dominant Logic for Marketing. Journal of Marketing, 68, January, 2004, 1-17.
60. Von Hippel, E. Perspective: User Toolkits for Innovation. - Journal of Product Innovation Management, 18, 2001, 247-257.
61. Von Hippel, E. Democratization of Innovation. Cambridge, MIT Press, 2006.
62. Von Hippel, E. Why Many Users Want Custom Products. Ch. 3 in Democratization of Innovation. Cambridge, MIT Press, 2006a, 33-43. 63. Von Hippel, E. Application: Searching for Lead User Innovations.Ch. 10 in Democratization of Innovation. Cambridge, MIT Press, 2006b, 133-146.
64. Warnke, P., M. Weber. & K.-H. Leitner. Transition Pathways Towards User-centric Innovation. - International Journal of Innovation Manage-ment, 12 (3), 2008, 489-510.
65. Weerawardena, J. & J. McColl-Kennedy. New Service Development and Competitive Advantage: A Conceptual Model. - Australian Marketing Journal, 10, 2002, 13-23.
66. West, J. & S. O’Mahony. The Role of Participation Architecture in Growing Sponsored Open Source Communities. - Industry & Innova-tion, 15( 2), 2008, 145-168.
Lachezar Georgiev is a researcher in the fields IT/IS, technology entre-preneurship and value co-creation. He graduated in master degree “Technological Entrepreneurship and Innovations in Information Tech-nologies”. He has experience and expertise in wide area of Software Technologies. Participated in various start-up and IT projects, technology and business courses. Currently working as a software engineer, leading projects in the travel technology industry.
Contacts: Mobile: +359 888 990 081 http://bg.linkedin.com/in/lachezargeorgiev e-mail: lachezar.georgiev@hotmail.com Tony Bailetti is the Director of Carleton University’s Technology Inno-vation Management program. Over the years, Bailetti has worked with technology entrepreneurs, Carleton faculty, students, staff and alumni, talented individuals, senior company managers, economic development organizations, service providers, non-profits and other academic insti-tutions to deliver: (i) the highly successful Lead To Win (LTW) program; (ii) offer the Talent First experiential-based project to explore a new approach to develop and commercialize technology products, services and solutions; (iii) spin off companies that create high-paying jobs; (iv) deliver Carleton Entrepreneurs, a program that helps student entrepre-neurs transform their ideas into compelling opportunities and successful ventures; (v) establish Coral CEA, a multi-million dollar project focused on providing Ontario with a leadership position in communications-enabled applications; (vi) publish the Open Source Business Resource (OSBR.ca), a monthly online journal about innovative company issues that attracts thousands of visitors worldwide every month; (vii) develop the Keystone-off-the-shelf (KOTS) platform to support Model C, a new approach to commercialize products and services of technology com-panies; (viii) entice companies to set up R&D facilities in Ottawa and attract public and private funding to the region; (ix) spin-off BigBlueButton as an open source project; (x) provide suitable jobs with technology companies to dozens of new immigrants and students; (xi) increase the number of females in senior management positions of technology companies; and (xii) promote the Ottawa region as a centre of inno-vation and entrepreneurialism.
In 1996 he won a Carleton University Teaching Award, in 2007 a Carleton University Leadership Breakthrough Award, and in 2011 the Ottawa Innovation Community Award from the Ottawa Centre for Re-gional Innovation (OCRI).
Contacts: Department of Systems and Computer Engineering Sprott School of Business Mackenzie Buildings Office 4476 Carleton University Ottawa, Ontario, K1S 5B6 phone: 613 829 8885; fax: 613 520-5727 e-mail: Bailetti@sce.carleton.ca www.carleton.ca/tim