Wideband DOA Estimation via Sparse Bayesian Learning
over a Khatri-Rao Dictionary
Yujian PAN, Ning TAI, Naichang YUAN
College of Electronic Science and Engineering, National University of Defense Technology, Changsha, Hunan, 410073, China
[email protected] Abstract. This paper deals with the wideband
direction-of-arrival (DOA) estimation by exploiting the multiple mea-surement vectors (MMV) based sparse Bayesian learning (SBL) framework. First, the array covariance matrices at different frequency bins are focused to the reference fre-quency by the conventional focusing technique and then transformed into the vector form. Then a matrix called the Rao dictionary is constructed by using the Khatri-Rao product and the multiple focused array covariance vec-tors are set as the new observations. DOA estimation is to find the sparsest representations of the new observa-tions over the Khatri-Rao dictionary via SBL. The perfor-mance of the proposed method is compared with other well-known focusing based wideband algorithms and the Cramer-Rao lower bound (CRLB). The results show that it achieves higher resolution and accuracy and can reach the CRLB un-der relative demanding conditions. Moreover, the method imposes no restriction on the pattern of signal power spec-tral density and due to the increased number of rows of the dictionary, it can resolve more sources than sensors.
Keywords
Array covariance vector, direction-of-arrival estima-tion, focusing technique, sparse Bayesian learning, wideband source
1. Introduction
Direction of arrival (DOA) estimation is an impor-tant part of the array signal processing and widely applied in the civil and military fields, e.g., communication, radar and sonar. Since the narrowband estimation method such as MUSIC and ESPRIT cannot be directly used under the wideband scenarios which commonly exist in practice, re-searchers have proposed a number of specific methods.
Incoherent subspace method (ISM) [1] is the first pro-posed method which averages the DOA estimations under different frequency bins in-band. Thus the power variation in-band will deteriorate its performance. Moreover, it cannot deal with the coherent sources. To make up this weakness,
the coherent subspace method (CSM) was proposed [2–4]. It averages the array covariance matrices obtained by the fo-cusing technique and then the narrowband DOA estimation method follows. The frequency smoothing involved in that procedure enables it to resolve the coherent sources. Addi-tionally, it improves the angle resolution and the estimation accuracy. However, the CSM needs DOA pre-estimation usually acquired by the traditional beamforming and the in-accuracy in pre-estimation will adversely affect the perfor-mance of CSM. Based on CSM, Feng came up with the focusing Khatri-Rao and rotational signal-subspace (FKR-RSS) method [5] which transforms the array covariance ma-trices of different frequency bins into a higher dimensional matrix through Khatri-Rao product. Then DOA estimation is done by the subspace type algorithm. The author claimed that, compared with CSM, the method improved the robust-ness to the inaccuracy in pre-estimation and the angle reso-lution. But in that method there is a key assumption that the matrix[HT,1j]should be full column rank. (1j is the
col-umn vector with all entries being one and see below for the meaning ofH). That means, at least, the sources should nei-ther have flat power spectral densities nor have similar power spectral density with each other. This strict assumption will limit its application range. We will show that even if this assumption is satisfied, its performance is not satisfying in our simulation conditions. Another method based on Khatri-Rao product can be found in [6]. However, the transformed noises at some virtual sensors are coherent and the power compensation to remove power variation in-band can only be applied to signals with similar power spectral densities.
Recently, the sparse representation related to the com-pressed sensing (CS) and machine learning has found its ap-plication in DOA estimation. The narrowband DOA esti-mation algorithms`1-SVD [7] based on`1-norm and
RVM-DOA [8] based on SBL are the two well-known algorithms. The abbreviations SVD and RVM denotes the singular value decomposition and relevance vector machine, respectively. Their performances both are much better that of the tradi-tional subspace type method. However, `1-SVD is not as
good as RVM-DOA since it is biased for closely-spaced sig-nals. Wideband algorithm based on SBL has also be pre-sented in [9]. It directly processes the array outputs in time domain without executing Fourier transform. However, due to the modeling method, it can only exploit the single
RADIOENGINEERING, VOL. 24, NO. 2, JUNE 2015 553
surement vector (SMV) based SBL whose reconstruction performance is worse than the MMV based SBL [10]. More-over, it requires specific types of signal modulation or pre-estimated signal power spectral density to estimate the cor-relation functions for building the dictionary [11] and the estimation error will leads to performance degradation [12]. In this paper, we propose a new wideband DOA esti-mation method. By using the focusing technique, the array covariance matrices at different frequency bins are focused to the same frequency. Then the vectorization operation in-stead of the averaging operation in CSM is performed on the focused array covariance matrices to obtain the multi-ple focused array covariance vectors. By taking advantage of the spatial sparsity property of sources, the focused ar-ray covariance vectors can be sparsely represented over the Khatri-Rao dictionary via MMV based SBL to obtain the DOAs. This method can improve the resolution and accu-racy compared with other well-known focusing based algo-rithms under the same preliminary DOAs estimated by the conventional beamforming method and reach the CRLB un-der the relative demanding scenario. This indicates the new method decreases its sensitivity to the initial DOAs. Further more, the method removes the restriction that the number of sensors has to be larger than the number of sources and im-poses no restriction on the pattern of signal power spectral density. The latter means the method can be applied to sig-nals with flat or non-flat, similar or non-similar signal power spectral densities.
Notations used in the paper are introduced as follows.
(·)T,(
·)∗ and(·)H are denoted as the transpose, conjugate
and conjugate transpose operator, respectively. (·)j·, (·)·j
and(·)j,j denote thejth row,jth column andjth diagonal
element of a matrix, respectively.k · k2denotes the`2norm. tr(·),(∗)and⊗are the trace, Khatri-Rao product and Kro-necker product operator respectively. vec(·)is the operator that creates a column vector by stacking the column vectors of a matrix below one another. E(·) denotes the
expecta-tion and diag(·)is to form a diagonal matrix with entries of
a vector.
2. Model Formulation
AssumeK far-field wideband signals from directions θk, k = 1, . . . , Kimpinge on a uniform linear array (ULA)
ofM elements whose inter-spacing beingd. The output of mth element at timetcan be written as
xm(t) = K
X
k=1
sk(t−τm(θk)) +nm(t) (1)
whereτm(θk)is the propagation delay for thekth signal
be-tween the reference point and themth element. sk(t)is the
kth singal. nm(t)is assumed to be the additive white
Gaus-sian noise. As the sources being wideband, the array outputs in time domain are divided intoIsegments with each for the discrete Fourier transformation (DFT) to obtain the J nar-rowband measurements. Iis called the frequency snapshot
number. The DFT outputs of theith segment can be repre-sented as
Xi(fj) =A(fj,θ)Si(fj) +Ni(fj), j = 1, . . . , J (2)
where Si(fj) and Ni(fj) are the frequency
com-ponent of the signal and noise vectors, respec-tively. A(fj,θ) = [a(fj, θ1), . . . ,a(fj, θK)]
is the array manifold matrix and a(fj, θk) =
[1, e−i2πfjdcos(θk)/c, . . . , e−i2πfj(M−1)dcos(θk)/c]T. c
de-notes the signal propagation speed. For simplicity,Aj(θ)
andaj(θk)are used to replace A(fj,θ) anda(fj, θk)
re-spectively in the rest of the paper. AsNi(fj) can be
as-sumed to be white Gaussian and uncorrelated with signals, the array covariance matrix atfjcan be expressed as
Rj=Aj(θ)PjAHj (θ) +σj2I (3)
wherePjis the signal covariance matrix andσj2is the noise
power at frequencyfj.
In order to remove the dependence of array manifold matrix on frequency, the focusing technique which arose in CSM is adopted. Here the rotation signal-subspace (RSS) [3] focusing matrixTjis utilized to transform (3) into
TjRjTHj =A0(θ)PjAH0(θ) +σj2I (4)
where
Tj=VjUHj (5)
andA0(θ)is the manifold matrix at the center frequency,
Uj and Vj are the left and right singular matrix of
Aj(θp)A0H(θp), respectively.θpis the preliminary DOAs.
In practice,R(fj)is consistently estimated by
ˆ Rj= I X i=1 Xi(fj)XiH(fj)/I. (6)
AsIcannot be infinitely large,∆Rj =Rˆj−Rjwhich is
called the covariance estimation error will exist. Denote
ˆ σj2= 1 M −K M X m=K+1 ρm (7)
as the estimation ofσj2andρmis themth largest eigenvalue
ofRˆj. Then (4) can be turned into
TjRˆjTHj −σˆj2I=A0(θ)PjAH0(θ)
+Tj∆RjTHj .
(8) Assume the signals are uncorrelated with each other, and thenPj is a diagonal matrix and we can form the focused
covariance vector as ˆ yj =vec TjRˆjTHj −σˆj2I =vec A0(θ)PjA0H(θ) +Tj∆RjTHj =Bηj+εj, j= 1, . . . , J (9) where B = A∗0(θ) ∗ A0(θ) = [b(θ1), . . . ,b(θK)] ∈ CM2 ×K,η
j = [η1j, . . . , ηKj]T denotes the vector composed
error component. According to the rule of Khatri-Rao prod-uct,b(θk) =a∗0(θk)⊗a0(θk).
Since vec(∆Rj) approximately follows the complex
normal distribution which is vec(∆Rj) ∼ CN(0,RTj ⊗
Rj/I) [13, 14] and εj = vec(Tj∆RjTHj ) = (T∗j ⊗ Tj)vec(∆Rj)[15], we have εj∼ CN(0,Qj), j= 1, . . . , J (10) where Qj= (T∗j⊗Tj)E vec(∆Rj)vec(∆Rj)H(T∗j⊗Tj)H = (TjRjTHj )T ⊗(TjRjTHj )/I. (11) SettingYˆ = [yˆ 1, . . . ,yˆJ] ∈ CM 2×J , (9) can be ex-tended to a MMV model as ˆ Y =BH+E (12) whereH = [η1, . . . ,ηJ]∈ CK×JandE= [ε1, . . . ,εJ]is
the error component that follows the Guassian distribution.
3. Sparse Bayesian Learning for
Wideband DOA Estimation
In order to adopt the sparse reconstruction algorithm, letΘ = {θ˜l}Ll=1 (L M)be the uniform sampling grids in the azimuth range[0◦,180◦]with the grid interval∆˜θ.
Then (12) can be reformulated as
ˆ
Y =B(Θ)H˜+E (13)
whereB(Θ) = [b(θ1), . . . ,b(θL)] ∈ CM
2×L
is called the Khatri-Rao dictionary since it obtained via the Khatri-Rao product andH˜ is the matrix with all rows being zero except
those corresponding to the true DOAs, which indicates each column ofH˜ has the same sparsity profile.
As elements of H˜ denote signal power, it should be
a non-negative matrix. Assigning it a truncated normal distribution is reasonable [16], however, it will largely in-crease the computation cost [17]. So we follow the stan-dard SBL procedure [10, 18] and assign it with a nor-mal distributed prior as p(H˜|γ) = QJj=1CN(H˜·j|0,Γ)
where Γ = diag(γ), γ = [γ1, . . . , γL]T is the
un-known hyperparameter. From (11) we find the error components generally have different covariances at differ-ent frequency bins. However, if we model p(Yˆ|H˜) =
QJ
j=1CN(Yˆ·j|B(Θ)H˜·j,Qj), the eventual DOA
estima-tion will be the average of estimaestima-tions under different single measurement vector (SMV) model, which will de-teriorate the performance. So we alter to p(Yˆ|H˜) =
QJ
j=1CN(Yˆ·j|B(Θ)H˜·j,Qˆ) where Qˆ = PJj=1Qˆj/J
andQˆ
j= (TjRˆ(fj)THj )T⊗(TjRˆ(fj)THj )/I. This
alter-ation makes sense with sources having flat power spectrum1,
which does not mean our method can only be applied in this
situation since [19] concluded that the optimal performance of SBL cannot be obtained with the true covariance of er-ror component. Thus, in Section 4, one can notice that our method can also gain high performance with sources having non-flat power spectrum.
According to the Bayesian rule the posterior distribution of H˜ can be written as p(H˜|Yˆ) = QJ
j=1CN(H˜·j|M·j,Σ)with the mean
M=ΓBH(Θ)Σ−Yˆ1Yˆ (14)
and the covariance
Σ=Γ−ΓBH(Θ)ΣY−ˆ1B(Θ)Γ (15) whereΣYˆ = Qˆ+B(Θ)ΓBH(Θ). To find the unknown hyperparameter, we need to adopt the type-II maximum likelihood method which indicates to maximize p(Yˆ|γ) =
R
p(Yˆ|H˜)p(H˜|γ)dH˜. Finally, it is equivalent to minimize
L(γ) = lnΣYˆ +tr(Σ−ˆ1 Y RˆYˆ) (16) whereRˆˆ Y = YˆYˆ H /J . The Expectation-Maximization (EM) algorithm can be used to solve the problem by treat-ingH˜ as the hidden variable. However, to speed up
con-vergence, the fixed-point iteration is introduced as follow-ing [10, 18],
γl(q+1)= k
Mj·k22 J(1−Σl,l/γl(q))
+ς, l= 1, . . . , L (17) whereγl(q)is the value atqth iteration andςis a small
pos-itive constant to prevent division by zero. The iteration pro-cess is terminated ifγ(q+1) −γ(q) 2/ γ(q) 2 < τwhere τis the termination threshold.
Denote ˆγ as the estimation of γ after iteration
con-verged. If the true DOAs are fortunately at the spatial sam-pling grids, the peak locations ofγˆcan be directly output
as DOA estimations, or the grid mismatch will happen. One solution is to increase the number of grids adaptively dur-ing the iteration [7]. But here we perform a post-processdur-ing whose computational cost is lower [8]. Denoteθkas the set
which consists of two adjacent grids relating to thekth peak location ofγˆ,Θ−k as the grid set obtained by removingθk
fromΘ,Γˆ−k ∈ C(L−2)×(L−2)as the matrix which removes the diagonal elements corresponding toθk from Γˆ where
ˆ
Γ = diag(ˆγ),Σ−k = Qˆ+B(Θ−k)ˆΓ−kBH(Θ−k).
Ac-cording to (16), the method is to adjustβkandθto minimize
L(βk, θ) = ln Σ−k+βkb(θ)bH(θ) +tr Σ−k+βkb(θ)bH(θ)− 1ˆ RYˆ (18) whereβk is a fitting parameter. Taking the derivative with
respect toβk andθ, equating to zero, we finally achieve the
post-processing rule as θrk= arg max θ∈Ωk RehbH(θ)Σ−−1kb(θ)bH(θ)Σ−−1kRˆYˆ −RˆYˆΣ− 1 −kb(θ)b H (θ)Σ−−1k ∂b(θ) ∂θ i−1 , k= 1, . . . , K (19)
1The alteration can make sense with the two-sided correlation transformation (TCT) focusing matrix [4] without the limitation of signal pattern. But we
RADIOENGINEERING, VOL. 24, NO. 2, JUNE 2015 555
whereΩk is the interval between the grids corresponding to
θk. The post-processing is to scan withinΩk with a small
step size for every source.
In the following, the steps of the proposed wideband DOA estimation algorithm can be summarized as
1. Divide the array outputs intoIsegments with each for DFT and then obtainRˆ(fj), j= 1, . . . , J by (6).
2. Perform conventional beamforming (CBF) onRˆ(f0)to
pre-estimate the DOA and output the pre-estimation as
θp= [θCBF−θBW/4,θCBF,θCBF+θBW/4](θBW
is the beamwidth of the array) [3] and acquire the fo-cusing matrixTj, j= 1, . . . , Jby (5).
3. Form the multiple focused array covariance vectors
ˆ
Y = [yˆ1, . . . ,yˆJ]by (7) and (9) .
4. Follow the SBL method to iterate between (14) (15) and (17) with the initialization of γ(0) =
PJ
j=1|B
H(Θ)Yˆ
·j|/Jto yieldˆγ.
5. For each peak of ˆγ , execute the post-processing by
(19) to output the ultimate DOA estimations.
It should be noticed that the Khatri-Rao DictionaryB
hasM2rows, which indicates the proposed method has the potential to detect more sources than sensors. Theoretically, with a minimum redundancy linear array (MRLA) it can re-solve (M2
−M)/2 sources simultaneously at most. Sub-tractingM is to delete the diagonal elements from the co-variance matrix since they are the same in noiseless situation and division by two is to remove the symmetric information since the covariance matrix is Hermitian.
Regarding the computational complexity of the pro-posed method, the computational cost mainly lies in the SBL iteration process in step (4). Assuming L > M√J and L > M2, the computational complexity of SBL is O(L2M2)per iteration. However, since we adopt the fixed-point iteration and do not need to update the noise vari-ance, the iteration converges much faster than the stand SBL method in [10].
4. Simulation Results
In this section, some experiments are performed to evaluate the performance of our algorithm. An ULA of five elements is exposed to two uncorrelated wideband sources. The intersensor spacing is half wavelength at the center fre-quency of 100 MHz and the relative bandwidth of signals are20%. The array outputs are decomposed into 9
narrow-band components in each segment (with 16 point fast Fourier transform (FFT)), i.e.,J = 9. The positive constant in (17) and the iteration termination threshold are set asς = 10−10 andτ = 10−4, respectively. The maximum iteration times is limited as 2000. The grid interval is1◦ (i.e.,L = 181)
and the scanning step size is0.1◦. In order to take into
ac-count the impact of pre-estimation on the performance, the pre-estimated DOAs are obtained by CBF in every single trial [20]. The simulation results are obtained by averag-ing 300 Monte Carlo trials. The RSS, TCT and FKR-RSS method are chosen as the comparative algorithms. The wide-band CRLB whose detailed derivation can be seen in [21] is also included. In order to make FKR-RSS work normally, the sources with non-flat power spectrum are selected to in-sure[HT,1J]being full column rank.
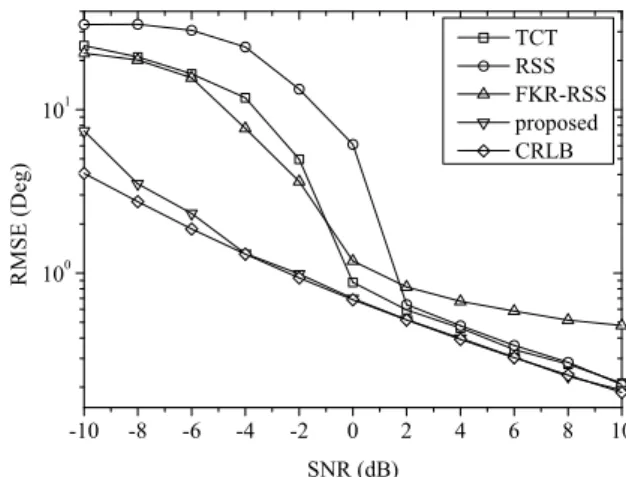
Firstly, we simulate the performance versus signal-to-noise ratio (SNR). The DOAs of sources are set as
[85.2◦,94.7◦]with the frequency snapshot number being 50.
The results are depicted in Fig. 1. The vertical axis repre-sents the root-mean-square error (RMSE) between the esti-mated value and true value. Compared to the other meth-ods, our method achieves the highest DOA estimation accu-racy and reaches the CRLB at SNR = – 4 dB. Meanwhile, the FKR-RSS only surpasses the traditional methods under low SNR. The results here have confirmed our previous per-spective that the new proposed method can also work with sources having non-flat power spectrum. Additionally, al-though there are errors in the preliminary DOAs, our method arrives the CRLB. It indicates that in the new method the sensitivity to the initial DOAs is decreased.
Secondly, we address the estimation performance un-der different frequency snapshot number. The simulation conditions are the same as above except for SNR = 0dB.
The results are revealed in Fig. 2, where we can notice that when the frequency snapshot number is as low as 20, our method reaches the CRLB. The FKR-RSS gets the similar performance as in Fig. 1. It exceeds the traditional meth-ods with small frequency snapshot number and falls behind when snapshot number becomes larger.
Thirdly, we vary the angle separation to evaluate an-gle resolution performance. SNR= 0dB and the DOAs of
sources are set as[85.2◦,85.2◦+ ∆θ]where∆θis the angle separation. Figure 3 demonstrates the results. Compared to the other methods, the proposed method possesses the high-est angle resolution. The proposed method achieves the es-4 Y. j. PAN, N. TAI, N. C. YUAN, WIDEBAND DOA ESTIMATION VIA SBL OVER A KHATRI-RAO DICTIONARY
is the beamwidth of the array) [3] and acquire the focus-ing matrixTj, j= 1, . . . , J by (5).
3) Form the multiple focused array covariance vectors
ˆ
Y = [yˆ1, . . . ,yˆJ]by(7) and (9) .
4) Follow the SBL method to iterate between (14) (15) and (17) with the initialization of γ(0) =
∑J
j=1|B
H
(Θ)Yˆ·j|/Jto yieldγˆ.
5) For each peak ofγˆ, execute the postprocessing by (19)
to output the ultimate DOA estimations.
It should be noticed that the Khatri-Rao DictionaryB
hasM2rows, which indicates the proposed method has the potential to detect more sources than sensors. Theoretically, with a minimum redundancy linear array (MRLA) it can re-solve(M2
−M)/2 sources simultaneously at most. Sub-tractingM is to delete the diagonal elements from the co-variance matrix since they are the same in noiseless situation and division by two is to remove the symmetric information since the covariance matrix is hermitian.
Regarding the computational complexity of the pro-posed method, the computational cost mainly lies in the SBL iteration process in step (4). AssumingL > M√J and L > M2, the computational complexity of SBL is O(L2M2)per iteration. However, since we adopt the fixed-point iteration and do not need to update the noise vari-ance, the iteration converges much faster than the stand SBL method in [14].
4. Simulation Results
In this section, some experiments are performed to evaluate the performance of our algorithm. An ULA of five elements with its inter-spacing being half wavelength corre-sponding to the center frequency is exposed to two uncorre-lated wideband sources which occupy the same20% band-width. The array outputs are decomposed into 9 narrowband components in each segment (with 16 point FFT), i.e.J = 9. The positive constant in (17) and the iteration termination threshold are set asς = 10−10andτ= 10−4, respectively. The maximum iteration times is limited as 2000. The grid in-terval is1◦(i.e.L= 181) and the scan step size sis0.1◦. In
order to take into account the impact of pre-estimation on the performance, the pre-estimated DOAs are obtained by CBF in every single trial [16] . The simulation results are obtained by averaging 300 times Monte Carlo trials. The RSS, TCT and FKR-RSS method are chosen as the comparative algo-rithms. The wideband CRLB whose detailed derivation can be seen in [17] is also included. In order to make FKR-RSS work normally, the sources with non-flat power spectrum are selected to insure[HT,1J]being full column rank.
Firstly, we simulate the performance versus SNR. The DOAs of sources are set as[85.2◦,94.7◦]with the frequency
snapshot number being 50. The results are depicted in Fig. 1. Compared to the other methods, our method achieves the
-10 -8 -6 -4 -2 0 2 4 6 8 10 10 0 10 1 R M S E ( D e g ) SNR (dB) TCT RSS FKR-RSS proposed CRLB
Fig. 1.RMSE of wideband DOA estimation versus SNR.
10 20 30 40 50 60 70 80 90 100 10 0 10 1 R M S E ( D e g )
Frequency snapshot number TCT
RSS
FKR-RSS
proposed
CRLB
Fig. 2.RMSE of wideband DOA estimation versus frequency
snapshot number. 3 4 5 6 7 8 9 10 11 12 13 10 0 10 1 R M S E ( D e g )
Angle separation (Deg) TCT
RSS
FKR-RSS
proposed
CRLB
Fig. 3.RMSE of wideband DOA estimation versus angle
separation.
highest DOA estimation accuracy and reaches the CRLB at SNR =−4dB. Meanwhile, the FKR-RSS only surpass the traditional methods under low SNR. The results here have confirmed our previous perspective that the new proposed method can also work with sources having non-flat power spectrum. Additionally, although there are errors in the pre-liminary DOAs, our method arrives the CRLB. It indicates that in the new method the sensitivity to the initial DOAs is decreased.
556 YUJIAN PAN, NING TAI, NAICHANG YUAN, WIDEBAND DOA ESTIMATION VIA SBL OVER A KHATRI-RAO . . . is the beamwidth of the array) [3] and acquire the
focus-ing matrixTj, j= 1, . . . , J by (5).
3) Form the multiple focused array covariance vectors
ˆ
Y = [yˆ1, . . . ,yˆJ]by(7) and (9) .
4) Follow the SBL method to iterate between (14) (15) and (17) with the initialization of γ(0) =
∑J
j=1|B
H(Θ)Yˆ
·j|/Jto yieldγˆ.
5) For each peak ofγˆ, execute the postprocessing by (19) to output the ultimate DOA estimations.
It should be noticed that the Khatri-Rao DictionaryB
hasM2rows, which indicates the proposed method has the potential to detect more sources than sensors. Theoretically, with a minimum redundancy linear array (MRLA) it can re-solve (M2−M)/2sources simultaneously at most.
Sub-tractingM is to delete the diagonal elements from the co-variance matrix since they are the same in noiseless situation and division by two is to remove the symmetric information since the covariance matrix is hermitian.
Regarding the computational complexity of the pro-posed method, the computational cost mainly lies in the SBL iteration process in step (4). Assuming L > M√J and L > M2, the computational complexity of SBL is O(L2M2)per iteration. However, since we adopt the fixed-point iteration and do not need to update the noise vari-ance, the iteration converges much faster than the stand SBL method in [14].
4. Simulation Results
In this section, some experiments are performed to evaluate the performance of our algorithm. An ULA of five elements with its inter-spacing being half wavelength corre-sponding to the center frequency is exposed to two uncorre-lated wideband sources which occupy the same20%
band-width. The array outputs are decomposed into 9 narrowband components in each segment (with 16 point FFT), i.e.J= 9.
The positive constant in (17) and the iteration termination threshold are set asς = 10−10andτ = 10−4, respectively.
The maximum iteration times is limited as 2000. The grid in-terval is1◦(i.e.L= 181) and the scan step size sis0.1◦. In
order to take into account the impact of pre-estimation on the performance, the pre-estimated DOAs are obtained by CBF in every single trial [16] . The simulation results are obtained by averaging 300 times Monte Carlo trials. The RSS, TCT and FKR-RSS method are chosen as the comparative algo-rithms. The wideband CRLB whose detailed derivation can be seen in [17] is also included. In order to make FKR-RSS work normally, the sources with non-flat power spectrum are selected to insure[HT,1J]being full column rank.
Firstly, we simulate the performance versus SNR. The DOAs of sources are set as[85.2◦,94.7◦]with the frequency
snapshot number being 50. The results are depicted in Fig. 1. Compared to the other methods, our method achieves the
-10 -8 -6 -4 -2 0 2 4 6 8 10 10 0 10 1 R M S E ( D e g ) SNR (dB) TCT RSS FKR-RSS proposed CRLB
Fig. 1.RMSE of wideband DOA estimation versus SNR.
10 20 30 40 50 60 70 80 90 100 10 0 10 1 R M S E ( D e g )
Frequency snapshot number TCT
RSS
FKR-RSS
proposed
CRLB
Fig. 2.RMSE of wideband DOA estimation versus frequency
snapshot number. 3 4 5 6 7 8 9 10 11 12 13 10 0 10 1 R M S E ( D e g )
Angle separation (Deg) TCT
RSS
FKR-RSS
proposed
CRLB
Fig. 3.RMSE of wideband DOA estimation versus angle
separation.
highest DOA estimation accuracy and reaches the CRLB at SNR =−4dB. Meanwhile, the FKR-RSS only surpass the traditional methods under low SNR. The results here have confirmed our previous perspective that the new proposed method can also work with sources having non-flat power spectrum. Additionally, although there are errors in the pre-liminary DOAs, our method arrives the CRLB. It indicates that in the new method the sensitivity to the initial DOAs is decreased.
Fig. 2.RMSE of wideband DOA estimation versus frequency
snapshot number. is the beamwidth of the array) [3] and acquire the
focus-ing matrixTj, j= 1, . . . , Jby (5).
3) Form the multiple focused array covariance vectors
ˆ
Y = [yˆ1, . . . ,yˆJ]by(7) and (9) .
4) Follow the SBL method to iterate between (14) (15) and (17) with the initialization of γ(0) =
∑J
j=1|B
H(Θ)Yˆ
·j|/Jto yieldγˆ.
5) For each peak ofγˆ, execute the postprocessing by (19)
to output the ultimate DOA estimations.
It should be noticed that the Khatri-Rao DictionaryB
hasM2rows, which indicates the proposed method has the potential to detect more sources than sensors. Theoretically, with a minimum redundancy linear array (MRLA) it can re-solve (M2−M)/2 sources simultaneously at most. Sub-tractingM is to delete the diagonal elements from the co-variance matrix since they are the same in noiseless situation and division by two is to remove the symmetric information since the covariance matrix is hermitian.
Regarding the computational complexity of the pro-posed method, the computational cost mainly lies in the SBL iteration process in step (4). Assuming L > M√J and L > M2, the computational complexity of SBL is O(L2M2)per iteration. However, since we adopt the
fixed-point iteration and do not need to update the noise vari-ance, the iteration converges much faster than the stand SBL method in [14].
4. Simulation Results
In this section, some experiments are performed to evaluate the performance of our algorithm. An ULA of five elements with its inter-spacing being half wavelength corre-sponding to the center frequency is exposed to two uncorre-lated wideband sources which occupy the same20%
band-width. The array outputs are decomposed into 9 narrowband components in each segment (with 16 point FFT), i.e.J= 9.
The positive constant in (17) and the iteration termination threshold are set asς = 10−10andτ = 10−4, respectively. The maximum iteration times is limited as 2000. The grid in-terval is1◦(i.e. L= 181) and the scan step size sis0.1◦. In
order to take into account the impact of pre-estimation on the performance, the pre-estimated DOAs are obtained by CBF in every single trial [16] . The simulation results are obtained by averaging 300 times Monte Carlo trials. The RSS, TCT and FKR-RSS method are chosen as the comparative algo-rithms. The wideband CRLB whose detailed derivation can be seen in [17] is also included. In order to make FKR-RSS work normally, the sources with non-flat power spectrum are selected to insure[HT,1J]being full column rank.
Firstly, we simulate the performance versus SNR. The DOAs of sources are set as[85.2◦,94.7◦]with the frequency
snapshot number being 50. The results are depicted in Fig. 1. Compared to the other methods, our method achieves the
-10 -8 -6 -4 -2 0 2 4 6 8 10 10 0 10 1 R M S E ( D e g ) SNR (dB) TCT RSS FKR-RSS proposed CRLB
Fig. 1.RMSE of wideband DOA estimation versus SNR.
10 20 30 40 50 60 70 80 90 100 10 0 10 1 R M S E ( D e g )
Frequency snapshot number TCT
RSS
FKR-RSS
proposed
CRLB
Fig. 2.RMSE of wideband DOA estimation versus frequency
snapshot number. 3 4 5 6 7 8 9 10 11 12 13 10 0 10 1 R M S E ( D e g )
Angle separation (Deg) TCT
RSS
FKR-RSS
proposed
CRLB
Fig. 3.RMSE of wideband DOA estimation versus angle
separation.
highest DOA estimation accuracy and reaches the CRLB at SNR=−4dB. Meanwhile, the FKR-RSS only surpass the
traditional methods under low SNR. The results here have confirmed our previous perspective that the new proposed method can also work with sources having non-flat power spectrum. Additionally, although there are errors in the pre-liminary DOAs, our method arrives the CRLB. It indicates that in the new method the sensitivity to the initial DOAs is decreased.
Fig. 3.RMSE of wideband DOA estimation versus angle
sepa-ration.
timation error of no more than3◦under angle separation of
larger than4◦ while other methods reach this performance
under angle separation of at least larger than8◦. In addition,
when angle separation is larger than6◦, our method arrives
the CRLB.
At last, we demonstrate the ability to resolve more sources than sensors. A four elements MRLA whose el-ements locate at [0, λ,2.5λ,3λ] is exposed to six sources from the direction of[51◦,60◦,83◦,93◦,115◦,125◦]. λis
the wavelength corresponding to the center frequency. The simulation condition is the same as the previous except for SNR= 10dB. The noise variance is assumed to be known and the preliminary DOAs are given by step (2) in Section 3. The spatial spectrum is shown in Fig. 4. It can be seen that all sources are correctly resolved.
5. Conclusion
Wideband DOA estimation is more complex than the narrowband counterpart. In this paper, we estimate the DOAs by exploiting the MMV based SBL framework and sparsely representing the focused array covariance vectors over the Khatri-Rao dictionary. The simulation results
RADIOENGINEERING, VOL. 18, NO. 1, APRIL 2009 5
0 30 60 90 120 150 180 0.0 0.2 0.4 0.6 0.8 1.0 N o rm a li z e d s p a ti a l sp e c tr u m Azimuth (Deg)
Fig. 4.Resolving six sources with four sensors.
Secondly, we address the estimation performance un-der different frequency snapshot number. The simulation conditions are the same as above except for SNR = 0dB. The results are revealed in Fig. 2 from which we can notice that when the frequency snapshot number is as low as 20, our method reachs the CRLB. The FKR-RSS gets the similar performance as in Fig. 1. It exceeds the traditional methods with small frequency snapshot number and fall behind when snapshot number becomes larger.
Thirdly, we vary the angle separation to evaluate an-gle resolution performance. SNR= 0dB and the DOAs of sources are set as[85.2◦,85.2◦+ ∆θ]where∆θis the angle
separation. Fig. 3 demonstrates the results. Compared to the other methods, the proposed method possesses the highest angle resolution. The proposed method achieves the estima-tion error of no more than3◦under angle separation of larger
than4◦ while other methods reach this performance under
angle separation of at least larger than8◦. And when angle
separation is larger than6◦, our method arrives the CRLB.
At last, we demonstrate the ability to resolve more sources than sensors. A four elements MRLA whose el-ements locate at [0, λ,2.5λ,3λ] is exposed to six sources
from the direction of[51◦,60◦,83◦,93◦,115◦,125◦]. λis
the wavelength corresponding to the center frequency. The simulation condition is the same as the previous except for SNR= 10dB. The noise variance is assumed to be known
and the preliminary DOAs are given by step (2) in section 3. The spatial spectrum is shown in Fig. 4. It can be seen that all sources are correctly resolved.
5. Conclusion
Wideband DOA estimation is more complex than the narrowband counterpart. In this paper we estimate the DOAs by exploiting the SBL framework and sparsely representing the focused array covariance vectors over the Khatri-Rao dictionary. The simulation results have demonstrated sev-eral advantages of the new method, e.g. higher resolution and accuracy, reaching the CRLB under relative demanding scenario and resolving more sources than sensors. However,
due to the way of model formulation the correlated scenario, especially coherent, will lead to a deteriorated performance. So how to extend the proposed method to the above situation is the future work .
Acknowledgements
This work was supported in part by the National Natu-ral Science Foundation of China under Grant no. 61302141. The authors would like to thank the anonymous reviewers for the improvement of this paper.
References
[1] WAX, M., SHAN, T. J., KAILATH, T. Spatio-temporal spectral anal-ysis by eigenstructure methods.IEEE Transactions on Acoustics, Speech, and Signal Processing, 1984, vol. ASSP-32, no. 4, p. 817 - 827.
[2] WANG, H., KAVEH, M. Coherent signal-subspace processing for the detection and estimation of angles of arrival of multiple wide-band sources.IEEE Transactions on Acoustics, Speech, and Signal Processing, 1985, vol. ASSP-33, no. 4, p. 823 - 831.
[3] HUNG H., KAVEH, M. Focussing matrices for coherent signal-subspace processing.IEEE Transactions on Acoustics, Speech, and Signal Processing, 1988, vol. 36, no. 8, p. 1272 - 1281.
[4] VALAEE, S., KABAL, P. Wideband array processing using a two-sided correlation transformation.IEEE Transactions on Signal Pro-cessing, 1995, vol. 43, no. 1, p. 160 - 172.
[5] FENG, D., BAO, M., YE, Z., GUAN, L., LI, X. A novel wideband DOA estimator based on khatri-rao subspace approach.Signal Pro-cessing, 2011, vol. 91, no. 10, p. 2415 - 2419.
[6] MALIOUTOV, D., CETIN, M., WILLSKY, A. S. A sparse signal reconstruction perspective for source localization with sensor ar-rays.IEEE Transactions on Signal Processing, 2005, vol. 53, no. 8, p. 3010 - 3022.
[7] LIU, Z. M., HUANG, Z. T., ZHOU, Y. Y. An efficient maximum like-lihood method for direction-of-arrival estimation via sparse Bayesian learning. IEEE Transactions on Wireless Communications, 2012, vol. 11, no. 10, p. 3067 - 3617.
[8] YIN J., CHEN, T. Direction-of-arrival estimation using a sparse rep-resentation of array covariance vectors.IEEE Transactions on Signal Processing, 2011, vol. 59, no. 9, p. 4489 - 4493.
[9] OTTERSTEN, B., STOICA, P., ROY, R. Covariance matching esti-mation techniques for array signal processing applications.Digital Signal Processing, 1998, vol. 8, no. 3, p. 185 - 210.
[10] MAGNUS, J. R., NEUDECKER, H.Matrix Differential Calculus with Applications in Statistics and Econometrics.3nded. Chichester:
Wiley, 1988.
[11] ROBERT, C. P. Simulation of truncated normal variables.Statistics and Computing, 1995, vol. 5, no. 2, p. 121 - 125.
[12] THEMELIS, K. E., RONTOGIANNIS, A. A., KOUTROUMBAS, K. D. A novel hierarchical Bayesian approach for sparse semisuper-vised hyperspectral unmixing.IEEE Transactions on Signal Process-ing, 2012, vol. 60, no. 2, p. 585 - 599.
[13] TIPPING, M. E. Sparse Bayesian learning and the relevance vector machine.Journal of Machine Learning Research, 2001, vol. 1, p. 211 - 244.
Fig. 4.Resolving six sources with four sensors.
demonstrate several advantages of the new method, e.g., higher resolution and accuracy, reaching the CRLB under relative demanding scenario, imposing no restriction on the pattern of signal power spectral density and resolving more sources than sensors. However, due to the way of model for-mulation the correlated scenario, especially coherent, will lead to a deteriorated performance. Possible future work might concern the extension the proposed method to the above situation.
Acknowledgments
This work was supported in part by the National Natu-ral Science Foundation of China under Grant no. 61302141. The authors would like to thank the anonymous reviewers for the improvement of this paper.
References
[1] WAX, M., SHAN, T.-J., KAILATH, T. Spatio-temporal spectral analysis by eigenstructure methods.IEEE Transactions on Acous-tics, Speech, and Signal Processing, 1984, vol. 32, no. 4, p. 817–827. DOI: 10.1109/TASSP.1984.1164400
[2] WANG, H., KAVEH, M. Coherent signal-subspace processing for the detection and estimation of angles of arrival of multi-ple wide-band sources.IEEE Transactions on Acoustics, Speech, and Signal Processing, 1985, vol. 33, no. 4, p. 823–831. DOI: 10.1109/TASSP.1985.1164667
[3] HUNG H., KAVEH, M. Focussing matrices for coherent signal-subspace processing.IEEE Transactions on Acoustics, Speech, and Signal Processing, 1988, vol. 36, no. 8, p. 1272–1281. DOI: 10.1109/29.1655
[4] VALAEE, S., KABAL, P. Wideband array processing using a two-sided correlation transformation.IEEE Transactions on Signal Pro-cessing, 1995, vol. 43, no. 1, p. 160–172. DOI: 10.1109/78.365295 [5] FENG, D., BAO, M., YE, Z., GUAN, L., LI, X. A novel
wide-band DOA estimator based on khatri-rao subspace approach. Sig-nal Processing, 2011, vol. 91, no. 10, p. 2415–2419. DOI: 10.1016/j.sigpro.2011.04.014
RADIOENGINEERING, VOL. 24, NO. 2, JUNE 2015 557
[6] YAMADA H., SHIRAI S., YAMAGUCHI, Y. DOA Estimation of wideband signals using extended virtual array. In Proceedings of 3rdAsia-Pacific Conference on Antennas and Propagation. Harbin
(China), 2014, p. 802–805. DOI: 10.1109/APCAP.2014.6992620 [7] MALIOUTOV, D., CETIN, M., WILLSKY, A. S. A sparse signal
reconstruction perspective for source localization with sensor ar-rays.IEEE Transactions on Signal Processing, 2005, vol. 53, no. 8, p. 3010–3022. DOI: 10.1109/TSP.2005.850882
[8] LIU, Z. M., HUANG, Z. T., ZHOU, Y. Y. An efficient max-imum likelihood method for direction-of-arrival estimation via sparse Bayesian learning. IEEE Transactions on Wireless
Com-munications, 2012, vol. 11, no. 10, p. 3067–3617. DOI:
10.1109/TWC.2012.090312.111912
[9] LIU, Z. M., HUANG, Z. T., ZHOU, Y. Y. Sparsity-inducing direction finding for narrowband and wideband signals based on array covariance vector. IEEE Transactions on Wireless
Communications, 2013, vol. 12, no. 8, p. 3896–3907. DOI:
10.1109/TWC.2013.071113.121305
[10] WIPF, D. P., RAO, B. D. An empirical Bayesian strategy for solv-ing the simultaneous sparse approximation problem.IEEE Transac-tions on Signal Processing, 2007, vol. 55, no. 7, p. 3704–3716. DOI: 10.1109/TSP.2007.894265
[11] LIU, Z. M., HUANG, Z. T., ZHOU, Y. Y. Direction-of-Arrival esti-mation of wideband signals via covariance matrix sparse representa-tion.IEEE Transactions on Signal Processing, 2011, vol. 59, no. 9, p. 4256–4270. DOI: 10.1109/TSP.2011.2159214
[12] GAN, L., WANG, X. DOA estimation of wideband signals based on slice-sparse representation.EURASIP Journal on Advances in Signal Processing, 2013, vol. 2013, no. 18, p. 1–10. DOI: 10.1186/1687-6180-2013-18
[13] YIN, J., CHEN, T. Direction-of-arrival estimation using a sparse representation of array covariance vectors.IEEE Transactions on Signal Processing, 2011, vol. 59, no. 9, p. 4489–4493. DOI: 10.1109/TSP.2011.2158425
[14] OTTERSTEN, B., STOICA, P., ROY, R. Covariance matching es-timation techniques for array signal processing applications. Dig-ital Signal Processing, 1998, vol. 8, no. 3, p. 185–210. DOI: 10.1006/dspr.1998.0316
[15] MAGNUS, J. R., NEUDECKER, H.Matrix Differential Calculus with Applications in Statistics and Econometrics.3nded. Chichester:
Wiley, 1988.
[16] ROBERT, C. P. Simulation of truncated normal variables. Statis-tics and Computing, 1995, vol. 5, no. 2, p. 121–125. DOI: 10.1007/BF00143942
[17] THEMELIS, K. E., RONTOGIANNIS, A. A., KOUTROUM-BAS, K. D. A novel hierarchical Bayesian approach for sparse semisupervised hyperspectral unmixing. IEEE Transactions on
Signal Processing, 2012, vol. 60, no. 2, p. 585–599. DOI: 10.1109/TSP.2011.2174052
[18] TIPPING, M. E. Sparse Bayesian learning and the relevance vector machine.Journal of Machine Learning Research, 2001, vol. 1, p. 211–244.
[19] ZHANG, Z., RAO, B.Clarify Some Issues on the Sparse Bayesian Learning for Sparse Signal Recovery, technical report. San Diego (CA, USA): University of California. [Online] Cited 2011. Available at: https://sites.google.com/site/researchbyzhang/.
[20] YOON, Y. S., KAPLAN, L. M., MCCLELLAN, J. H. Tops: new DOA estimator for wideband signals. IEEE Transactions on Sig-nal Processing, 2006, vol. 54, no. 6, p. 1977 - 1989. DOI: 10.1109/TSP.2006.872581
[21] FRIEDLANDER, B., WEISS, A. Direction finding for wide-band signals using an interpolated array.IEEE Transactions on Signal Pro-cessing, 1993, vol. 41, no. 4, p. 1618–1634. DOI: 10.1109/78.212735
About the Authors . . .
Yujian PANwas born in 1987. He received his M.S. degree in Electronic Science and Technology from National Univer-sity of Defense Technology in 2012. Currently he is working towards the Ph.D. degree in College of Electronic Science and Engineering, National University of Defense Technol-ogy, Changsha, Hunan, China. His research interests include array signal processing and microwave circuit design. Ning TAIwas born in 1989. He received his M.S. degree in Electronic Science and Technology from National Univer-sity of Defense Technology in 2013. Currently he is work-ing towards the PhD degree in College of Electronic Science and Engineering, National University of Defense Technol-ogy, Changsha, Hunan, China. His research interests include radar signal processing and radar system simulation. Naichang YUANwas born in 1965. He received his M.S. and Ph.D. degree in Electronic Science and Technology from University of Electronic Science and Technology of China in 1991 and 1994, respectively. He is currently a professor with the College of Electronic Science and Engineering, Na-tional University of Defense Technology, Changsha, Hunan, China. His research interests include array signal processing, SAR imaging processing and singal processing in radar.