3.13
Energy
Conservation
Overview
of
Impacts
The analytical approach taken by this Subsequent EIR is described in Section 3.0 (Introduction to Environ‐
mental Analysis). The following section provides a description of energy resources and energy conserva‐
tion as they pertain to the SSJID area and services. An analysis of cumulative impacts from other past,
present and reasonably foreseeable projects is included in Section 5 (Cumulative Impacts) of this Subse‐
quent EIR.
The 2006 Final EIR for the plan to provide retail electric service did not include analysis of energy use. In
late December 2009, the California Natural Resources Agency adopted certain amendments to the State
CEQA Guidelines for reviewing the environmental impacts of energy use. These amendments became
effective in mid‐March 2010, and became requirements for most agencies to follow roughly 120 days
later. (See CEQA Guidelines, §15007, subd. (d).) In light of these amendments, this section describes how
the proposed project would not cause any adverse impact due to inefficient, wasteful, or unnecessary
consumption of energy.
This table summarizes the impacts to energy resources for each of the four actions evaluated in this EIR. Energy Resources Municipal Services Review Expanded Sphere of Influence Proposed 80-acre Annexation Updated Plan to Provide Retail Electric Service Impact 3.13-1: Result in substantial new
energy requirements or energy use inefficiencies No Impact No Impact No Impact No Impact
Impact 3.13-2: Cause an adverse effect on
local and regional energy supplies and require-ments for additional capacity because of ineffi-cient, wasteful, or unnecessary energy use
No Impact No Impact No Impact No Impact
Impact 3.13-3: Cause an adverse effect on
peak and base period demands for electricity and other forms of energy because of inefficient, wasteful, or unnecessary energy use
No Impact No Impact No Impact No Impact
Impact 3.13-4: Disrupt compliance with
existing energy standards No Impact No Impact No Impact No Impact
Impact 3.13-5: Cause an adverse effect on
energy resources because of inefficient, wasteful, or unnecessary energy use
No Impact No Impact No Impact No Impact
Impact 3.13-6: Result in inefficient, wasteful,
or unnecessary transportation energy use No Impact No Impact No Impact No Impact
3.13.1
Existing
Setting
3.13.1.1
Scope
of
Analysis
for
Energy
Conservation
The proposed plan to provide retail electric service could cause changes in how electrical energy and
other energy resources are used in the SSJID territory. In order to assure that energy implications are con‐
sidered in public agency decisions, CEQA requires that EIRs include a discussion of the potential energy
unnecessary consumption of energy (see Public Resources Code section 21100(b)(3)). According to Appen‐
dix F of the State CEQA Guidelines, the goal of conserving energy implies the wise and efficient use of
energy including: (1) decreasing overall per capita energy consumption; (2) decreasing reliance on nat‐
ural gas and oil; and (3) increasing reliance on renewable energy sources. Some aspects of the energy
use analysis are limited by the CEQA Guidelines (Section 15145), which allows the lead agency to find
that certain impacts may be too speculative for evaluation.
Baseline
Energy
Consumption
Currently (2011) the average annual energy requirement in the SSJID territory is approximately 571,900
megawatt‐hours (MWh) of electricity.1 PG&E and MID generate and/or purchase electricity to meet the
demand in the SSJID territory. Future (2040) average annual energy demand across all customer classes
within the SOI is projected to increase to about 1,006,000 MWh (MSR Table 4‐5, 2011). This forecast of
projected energy demand is likely to over‐predict demand somewhat based on California Energy Com‐
mission (CEC) historic data and forecasts. As such, the MSR provides a conservatively high forecast of
future energy demand because more existing and new customers would use energy conservation tools
(e.g., home/business energy management systems) and some customers may install on‐site electricity
generation technologies (e.g., distributed generation using solar, wind, or methane digestion, or geo‐
thermal heat pumps).
Table 3.13‐1 shows the electrical energy demand in the SSJID territory.
Table 3.13‐1. Baseline and Projected Population and Energy Demand inside SSJID Boundary
Year Population Projected Energy Demand in SSJID (MWh) Overall Per Capita Demand (MWh/person)
2011 102,998 571,906 5.55 2015 113,117 618,098 5.46 2020 127,358 681,174 5.35 2025 143,393 750,751 5.24 2030 161,446 827,502 5.13 2035 181,772 912,171 5.02 2040 204,657 1,005,578 4.91
Source: Sphere Plan/MSR, Table 3-2 and Table 4-5 (2011). Note: Estimates include all customer classes.
Table 3.13‐2 shows the baseline electricity consumption in San Joaquin County. It also shows the propor‐
tion of PG&E’s total that is consumed within the County. San Joaquin County represents one‐sixth to
one‐fifth of PG&E’s agricultural demand. Industrial demand also is disproportionately high; mining and
construction consumption is relatively low. Each residential household in San Joaquin County uses about
650 to 700 kWh per month, on average, based on the residential consumption in Table 3.13‐2 and the
U.S. Census Bureau identification of 207,667 households in the County (2005‐2009; US Census, 2011).
1
The baseline electricity demand in the SSJID territory cannot be determined with certainty because the data is
Table 3.13‐2. Electricity Consumption in San Joaquin County (MWh)
Percent of PG&E Sales
Sector 2006 2007 2008 2009 2006 2007 2008
Agricultural & Water Pump 870,121 887,766 909,905 --- 21.6% 16.9% 16.0%
Commercial Building 1,685,607 1,654,622 1,627,277 --- 5.5% 5.3% 5.2%
Commercial Other 253,099 271,284 267,592 --- 6.2% 6.3% 5.7%
Industry 934,096 982,927 983,203 --- 7.6% 8.2% 8.3%
Mining & Construction 44,454 50,064 38,509 --- 2.4% 2.4% 1.8%
Residential 1,694,343 1,693,239 1,735,552 1,732,374 5.5% 5.5% 5.5%
Streetlight 28,049 28,763 29,128 --- 6.3% 6.4% 6.3%
2009 Report: Non-Residential --- --- --- 3,731,461 6.3% 6.4% 6.3%
Total San Joaquin County
Usage (MWh) 5,509,768 5,568,666 5,591,165 5,463,835 6.5% 6.5% 6.3%
Source: CEC, 2010a; CEC, 2011. Note: Sector detail not reported for 2009.
Table 3.13‐3 shows the baseline electricity consumption for the entire PG&E territory.2 While demand rose
over the 2006 to 2008 period, more recent data filed in PG&E’s 2011 General Rate Case under consider‐
ation by the California Public Utilities Commission (CPUC dockets for A.09‐12‐020 and A.10‐03‐014) indi‐
cate that consumption declined in 2009.
Table 3.13‐3. Electricity Consumption in Entire PG&E Territory (MWh)
Sector 2006 2007 2008 2009
Agricultural & Water Pump 4,029,580 5,240,695 5,685,737 5,820,641
Commercial Building 30,642,666 31,458,952 31,579,782 30,596,611
Commercial Other 4,098,340 4,335,763 4,697,334 4,431,287
Industry 12,313,866 11,933,823 11,816,005 10,629,273
Mining & Construction 1,863,310 2,099,845 2,158,907 2,149,269
Residential 30,822,780 30,797,140 31,727,296 31,535,580
Streetlight 443,740 447,085 458,769 462,519
Total PG&E Usage (MWh) 84,214,282 86,313,302 88,123,830 85,625,179
Source: CEC, 2011.
SSJID estimates peak power demand for the customers it proposes to serve in its territory and in areas
served by the facilities extending outside the SSJID territory to be 172 MW, with potential growth to
432 MW by 2040. These estimates were based on the population and customer demand growing along
with growth in the peak demand to plan for adequate engineering of the proposed SSJID system (MSR
Table 4‐6, 2011). Table 3.13‐4 summarizes the current and forecasted peak period demand data for the
SSJID territory.
2
Note that this includes both bundled and direct access sales, which differs from the bundled‐only deliveries
shown elsewhere in this EIR (Section 3.12, Greenhouse Gas Emissions). Direct access allows certain large, non‐
residential customers to choose an alternative electric supplier to replace the supplier provided by the utility.
Table 3.13‐4. Projected Peak Power Demand (MW) By Substation
Year Population Manteca Ripon Jack Tone Clough (MID) Stockton (MID) Total SSJID (MW)
2010 105,319 94.8 27.0 25.6 23.5 1.3 172.2 2015 118,579 110.5 31.4 29.8 27.4 1.5 200.6 2020 133,508 128.8 36.7 34.7 31.9 1.8 233.9 2025 150,316 150.6 42.7 40.5 37.2 2.1 273.1 2030 169,241 175.1 49.8 47.2 43.3 2.4 317.8 2035 190,122 204.1 58.1 55.0 50.5 2.8 370.5 2040 214,539 238.0 67.7 64.2 58.9 3.3 432.1
Source: Sphere Plan/MSR, Table 4-6 (2011).
Baseline
Reliance
on
Fossil
Fuels
Electricity delivered to the SSJID territory is generated by a mix of fossil, nuclear, and renewable sources,
and transportation fuels and natural gas are nearly completely derived from fossil fuels. Users of elec‐
tricity and transportation fuels have few options for managing or controlling their reliance on fossil
fuels, generally limited to improving energy efficiency or in some cases self‐generating electricity from
renewable resources. The fuel mix of the PG&E electricity supply is more particularly described in Sec‐
tion 3.12, Greenhouse Gas Emissions.
Baseline
Reliance
on
Renewable
Energy
Sources
The fuel mix of the PG&E electricity supply is described in Section 3.12, Greenhouse Gas Emissions. As
noted in Section 3.12, PG&E has a requirement to achieve a 20% renewable portfolio standard (RPS) by
2010 under Public Utilities Code (PUC) Section 25740, but it only received 14.1% from “qualifying renew‐
able” resources in 2009 and about 18% in 2010 (PG&E, 2010b; CPUC, 2010a; PG&E, 2011). One‐third of
the renewable energy is from various biomass resources.3 PG&E receives around 13% of its electricity
from large hydropower (larger than 30 MW), which cannot be counted towards the RPS by PG&E. PG&E
projects meeting its 20% RPS target some time in 2011; the actual date is held as confidential (PG&E,
2011).
SSJID generates about 320,000 MWh of electricity annually for the wholesale market through its hydro‐
electric facilities. SSJID owns portions of hydroelectric facilities at the three dams (Tulloch, Beardsley,
and Donnells) and power projects comprising the Tri‐Dam Project, at the Sand Bar facility owned by the
Tri‐Dam Power Authority, and at Woodward Reservoir. SSJID also owns and generates about 3,000 MWh
annually at the Robert O. Schulz Solar Farm to supply power to the Nick C. DeGroot Water Treatment
Plant. Hydroelectric power generated by the Tri‐Dam Project is currently sold by SSJID into the Northern
California power markets through a contract with Shell Energy North America. SSJID’s ownership of gene‐
ration includes 8 MW of “qualifying renewable” small hydro‐electric assets (Woodward Reservoir), and a
50 percent ownership in another 120 MW of non‐carbon hydroelectric generation, of which 48 MW is
“qualifying renewable” power (portions of the Tri‐Dam Project and the Sand Bar facility). The power
from the Woodward and Sand Bar facilities is currently (2011) sold exclusively to PG&E. Table 3.13‐5 sum‐
marizes the renewable generation capacity owned by SSJID.
3
To qualify as eligible for California’s RPS, a generation facility must use a designated renewable resource or
fuel, as in the Overall Renewable Energy Program Guidebook (CEC Publication # CEC‐300‐2007‐003‐ED2‐CMF,
Table 3.13‐5. SSJID Electricity Generation
Generation Facility Generation Capacity (MW)
Average Annual Energy Generation (MWh) SSJID Ownership of Average Annual Generation (MWh) Tri-Dam Project 102 486,000 234,000
Sand Bar Project 18 114,000 57,000
Woodward Reservoir 8 20,000 20,000
Robert O. Schulz Solar Farm 1.4 3,000 3,000
Total Generation 129.4 623,000 323,000
Source: Sphere Plan/MSR, Table 4-4 (2011).
Baseline
Customer
Energy
Management
Programs
California has mandated and implemented aggressive energy‐use reduction programs for electricity and
other resources. The CPUC and CEC plan and oversee these programs. The California Long Term Energy
Efficiency Strategic Plan reflects the goals set for PG&E, and the CPUC has issued a series of decisions
and resolutions to implement the Plan.
Demand
Response
Programs
PG&E currently offers programs for customers to reduce their peak and base period demands for elec‐
tricity. PG&E’s demand response programs encourage commercial and industrial customers to partici‐
pate both through tariffed rates (e.g., Schedule E‐BIP – Base Interruptible Program) and through directly
managed load interruption programs. In addition, PG&E runs an air conditioning cycling program for res‐
idential and small commercial customers. Also, PG&E is implementing peak day pricing (PDP) to encour‐
age reduced demand from all customers on the dozen days per year with the highest expected total sys‐
tem load. Finally, PG&E allows third‐party aggregators to pool customers so that those customers can
qualify for certain incentives from PG&E. A detailed overview of the baseline programs currently available
to PG&E’s customers is in Appendix F of this EIR (see Appendix F‐1, PG&E’s Demand Response Programs).
Energy
Efficiency
and
Conservation
Programs
PG&E currently manages a wide array of energy efficiency programs that customers within the SSJID ser‐
vice territory can access (see Appendix F of this EIR). The programs can be separated by targeted cus‐
tomer groups or applications. The CPUC in Decision 09‐09‐047 adopted a budget of $1.928 billion for
PG&E to spend over three years, 2009 to 2011. Of that, $417 million is allocated to Low Income Energy
Efficiency. A detailed overview of the baseline programs currently available to PG&E’s customers is in
Appendix F of this EIR (see Appendix F‐2, PG&E Energy Efficiency and Demand Response Programs).
PG&E also implemented a tariffed program (AG‐ICE) to convert diesel agricultural pump engines to elec‐
tricity over a two‐year period beginning in 2007, ending in 2008. While the program converted over
1,700 engines across PG&E’s service territory (Geis, 2010), the CPUC adopted a cap of 100 engines within
SSJID’s boundaries out of a population of 420 eligible engines county‐wide (in CPUC Decision 05‐06‐016
at Conclusion of Law 11).
SSJID’s
Existing
Energy
Management
Programs
SSJID’s past and existing efforts for fostering use of renewable resources and increasing energy efficiency
grams that promote physical improvements for customers, water measurement, and irrigation manage‐
ment practices, which enhance the control and efficient use of surface water (SSJID, 2011). Efficient dis‐
tribution of surface water to agricultural customers improves the availability of water for other uses,
reducing the need for energy‐intensive water transfers or groundwater pumping.
SSJID’s past and existing energy management efforts include (p. 1‐15 of SSJID, 2009a):
SSJID contracted with Lathrop Irrigation District (“LID”) to assist in the establishment of a retail elec‐
tric distribution enterprise for the River Islands development. Under the terms of a Mutual Aid Agree‐
ment, SSJID will assist in services that LID would need in order to assume “utility responsibility” for
the provision of electric service in the LID service area. LID received authorization from the LAFCo to
offer retail electric service in January 2005.
SSJID developed a demand response program within the City of Manteca in cooperation with BPL
Global, Ltd. Known as Easy Green, this program offers customers the opportunity to reduce their peak
electric usage. The program installed controls in the homes of more than 1,650 customers and has the
potential to reduce peak electrical usage during periods of demand by as much as 2 MW. SSJID installed a 1.4 MW solar generation facility to offset demand at its Water Treatment Plant. SSJID is expanding the electric generation capacity at its Tulloch Hydroelectric Project, in cooperation
with Oakdale Irrigation District. The addition of a third generation unit will add an additional 7.5 MW
of qualifying‐renewable capacity.
Comparison
of
SSJID’s
Proposed
Public
Purpose
Programs
with
PG&E’s
Baseline
Programs
The proposed retail electric service plan includes SSJID allocating funds from its retail electric revenues
to implement energy management programs that would be comparable to those offered by other pub‐
licly owned utilities in the area. SSJID has not yet proposed specific measures, including measures for
industrial and agricultural customers, linkages to state‐run programs such as codes and standards, or
measures to stimulate technology innovation and diffusion. Therefore, at this time, a direct comparison
of proposed SSJID and current PG&E programs cannot be made.
SSJID would be required to provide Public Purpose Programs funded through a public goods charge to
reduce energy usage (improve efficiency), promote clean energy, and provide low income assistance.
SSJID proposes to focus the programs on local customers’ preferences. The specific programs would
need to be adopted in future actions by the SSJID Board of Directors following a review of the appropriate‐
ness, cost effectiveness, and other implications of the options. Based on a review of program offerings from
other nearby publicly owned electric utilities, SSJID anticipates offering the types of programs shown in
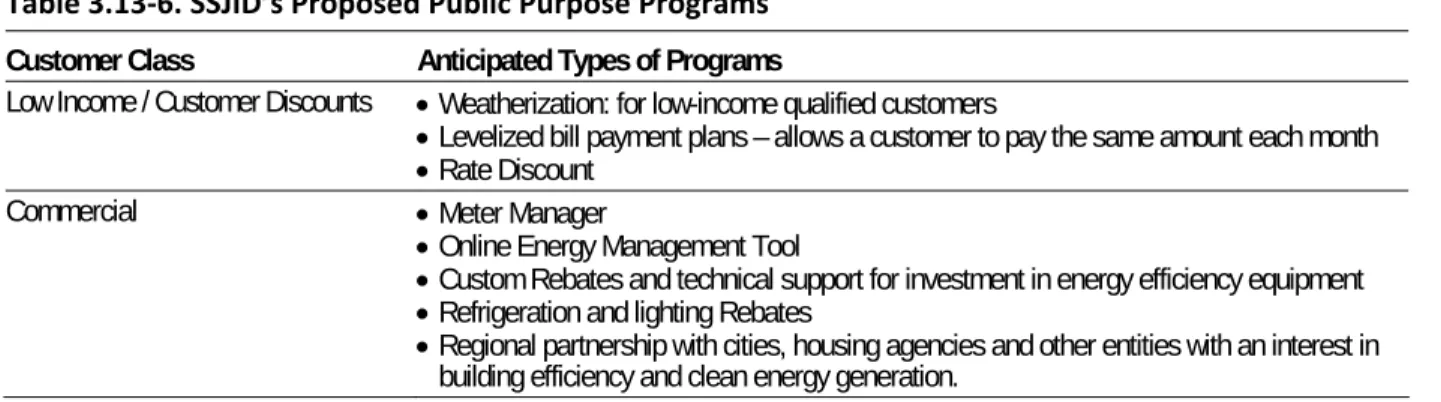
Table 3.13‐6 based on the Project Description, in Section 2, Table 2‐7 of this EIR (SSJID, 2009a).
Table 3.13‐6. SSJID’s Proposed Public Purpose Programs
Customer Class Anticipated Types of Programs
Residential Energy Audits
Rebates for installation of energy efficiency measures and solar
Refrigerator recycling program
CFL (compact fluorescent light bulb) rebate
New Construction Rebate
Energy Savings Kits for school children
Table 3.13‐6. SSJID’s Proposed Public Purpose Programs
Customer Class Anticipated Types of Programs
Low Income / Customer Discounts Weatherization: for low-income qualified customers
Levelized bill payment plans – allows a customer to pay the same amount each month
Rate Discount
Commercial Meter Manager
Online Energy Management Tool
Custom Rebates and technical support for investment in energy efficiency equipment
Refrigeration and lighting Rebates
Regional partnership with cities, housing agencies and other entities with an interest in building efficiency and clean energy generation.
Source: SSJID, 2009a (p. 6-3).
Baseline
Electricity
Rates
All other factors held equal, higher electricity rates will lead to lower consumption per customer. How‐
ever, there is no widespread agreement on the magnitude nor timing of these responses. Customers are
least responsive in the near term because they have fewer options for changing their energy consumption.
However, over time, customers can choose more energy efficient appliances and other devices.
Each retail electric service provider sets its electricity rates depending on, among other considerations, a
given customer’s usage, the type (class) of customer, baseline allowances, and seasonal schedules, and
these rates change over time as the costs of supplying electricity change. SSJID proposes to reduce the
average rate paid by its customers compared to PG&E’s current rates (SSJID, 2009a). The magnitude of
the rate reduction would be determined at a later date, but providing a 15% reduction would be consis‐
tent with the differences between California’s investor‐owned utilities and California’s publicly owned
utilities. PG&E has the lowest average retail price of California’s three major investor‐owned utilities at
13.62 cents per kWh in 2009; PG&E’s average price is greater than the average retail price of California’s
publicly owned utilities at 11.69 cents per kWh in 2009 (US EIA, 2011). PG&E’s average price is also
greater than that of MID at 11.87 cents per kWh in 2009 (US EIA, 2011).
Table 3.13‐7 shows the average electricity prices and typical monthly bills for residential customers
served by the two existing retail electric utilities in the SSJID territory. Over the year, residential
customers in San Joaquin County consume an average of between 650 to 700 kWh per month. Summer
use for customers with heavy air‐conditioning loads is typically at least 20% greater than winter use, but
some customers relying on electric baseboard heating may have higher winter use.
Table 3.13‐7. Current Electricity Prices and Typical Monthly Bills for Residential Customers
Monthly Residential Usage Summer PG&E Winter PG&E Summer MID Winter MID
600 kWh $76 $98 $113 $96
750 kWh $120 $144 $140 $118
1000 kWh $198 $229 $185 $156
1500 kWh $369 $400 $276 $231
Average Retail Price (all customer classes) $0.1362 per kWh $0.1187 per kWh
Source: PG&E Rate Schedule E-1, effective June 20, 2011; MID Rate Schedule D, effective January 1, 2011; US EIA, 2011. Note: Average retail price is for all customer classes.
3.13.1.2
Applicable
Regulations
and
Policies
State CEQA Guidelines. On December 31, 2009, the California Natural Resources Agency adopted certain
amendments to the State CEQA Guidelines to change how public agencies review the environmental
impacts of greenhouse gas emissions (GHG) and energy use. These amendments, which were approved
by the Office of Administrative Law on February 16, 2010, became effective on March 18, 2010, and became
mandatory for most public agencies approximately 120 days later (see CEQA Guidelines, §15007, subd.
(d)(2)). The topic of GHG is addressed in Section 3.12 of this EIR. Section 3.12 also provides a discussion
on the effects of the project on energy resources that provide the electricity supply.
California Code of Regulations (CCR) Title 24. New buildings in California are required to conform to
energy conservation standards specified in Title 24 of the CCR. The standards establish “energy budgets”
for different types of residential and non‐residential buildings, with which all new buildings must com‐
ply. The State Building Energy Efficiency Standards, embodied in Title 24 of the CCR regulate energy con‐
sumed for heating, cooling, ventilation, water heating, and lighting. Local building permits and approval
processes require all new buildings to meet Title 24 standards.
California Renewable Portfolio Standard (RPS). In 2002, California established its RPS through Senate
Bill 1038 (Sher, 2002), with the goal of increasing the percentage of renewable energy procured by investor‐
owned utilities such as PG&E in the State's electricity mix to 20% by 2017. That was accelerated to 2010
in 2006 by SB 107 (Simitian and Perata, 2006); however, no utility has yet achieved that goal. State
energy agencies recommended extending that goal, and in November 2008, the Governor signed Exec‐
utive Order S‐14‐08 requiring that California utilities reach the 33% renewable electricity goal by 2020.
The AB32 Scoping Plan (CARB, 2008) includes the 33% RPS by 2020. In April 2011, the statewide 33% RPS
target became law with Senate Bill 2 of the 1st Extraordinary Session (SB X1‐2). This extends the 33% RPS
requirement to all electric service providers, including municipal utilities. The recently adopted RPS would
become binding on SSJID in largely the same manner as for PG&E, with differences allowed for determining
which renewable resources are deemed “qualified.”
SSJID is committed to achieving the RPS targets established by SB X1‐2 (Pub. Util. Code, §399.30). SSJID
proposes to comply with RPS requirements through wholesale power supply contracts with generators
in the deregulated marketplace. SSJID could also comply with the standard through the purchase of
Renewable Energy Credits (RECs), although the statewide 33% RPS law limits the use of RECs, or through
the use of SSJID‐owned hydroelectric generation, depending on its availability and economic circum‐
stances although using the SSJID‐owned hydroelectric power is not part of the proposed business plan.
SSJID would be required annually submit to the CEC documentation regarding eligible renewable energy
resources procurement contracts that it executed during the prior year as part of the RPS law and the
statewide Power Source Disclosure program (SB 1305 of 1997).
Public Purpose Requirements (AB 1890). With the passage of Assembly Bill 1890 (Brulte, 1996), both
investor‐owned utilities such as PG&E, and publicly owned electric utilities, as SSJID would be, are required
to collect and spend a specific amount of its revenues on alternative and renewable generation resources,
energy management programs such as energy efficiency and demand response, and low‐income support
programs. PG&E’s overall requirements are dictated by Public Utilities Code Sections 381 and 399.8,
with more specific elements listed elsewhere in state law, with the funds collected through a nonbypass‐
able public goods charge. The total amount to be collected and spent each year by PG&E is specified in
those sections. That charge is set to expire January 1, 2012. The CPUC directs these programs with numer‐
AB 1890 set a minimum expenditure target for publicly owned utilities such as SSJID as well in PUC Sec‐
tion 385(a):
Each local publicly owned electric utility shall establish a nonbypassable, usage based
charge on local distribution service of not less than the lowest expenditure level of the
three largest electrical corporations in California on a percent of revenue basis, calcu‐
lated from each utility's total revenue requirement for the year ended December 31, 1994,
and each utility's total annual expenditure under paragraphs (1), (2), and (3) of subdivision
(c) of Section 381 and Section 382, to fund investments by the utility and other parties in
any or all of the following:
(1) Cost‐effective demand‐side management services to promote energy‐efficiency and
energy conservation.
(2) New investment in renewable energy resources and technologies consistent with exist‐
ing statutes and regulations which promote those resources and technologies.
(3) Research, development and demonstration programs for the public interest to advance
science or technology which is not adequately provided by competitive and regulated
markets.
(4) Services provided for low‐income electricity customer, including but not limited to,
targeted energy efficiency service and rate discounts.
The California Municipal Utilities Association reports that this minimum level is 2.85% using the 1994
data (CAT, 2005).
SSJID would provide, as part of its proposed plan for retail electric service, a service planning group to
ensure that the customer’s new business and energy efficiency needs are met and to meet SSJID’s legal
requirement to provide “public goods” (as required by AB 1890, SSJID, 2009a). However, SSJID may ini‐
tially work with MID to administer the Public Benefits Program to ensure implementation of important
efficiency and renewable investments consistent with those of MID. SSJID’s proposed Public Purpose
Programs are identified in the Project Description (see Section 2, Table 2‐7) and Table 3.13‐6.
Public Purpose Requirements (SB 1037). Senate Bill 1037 (Kehoe, 2005) imposed additional resource
planning requirements on both investor‐owned and publicly owned utilities. PUC Section 454(a)(9)(C)
states that PG&E “will first meet its unmet resource needs through all available energy efficiency and
demand reduction resources that are cost effective, reliable, and feasible.” The CPUC enforces this mea‐
sure in approving PG&E’s Long‐Term Procurement Plans (LTPP).
SSJID would be similarly required to meet statewide efficiency goals. PUC Section 9615, enacted in
2005 by SB 1037, and amended by AB 2021 in 2006, has the following requirements:
(a) Each local publicly owned electric utility, in procuring energy to serve the load of its retail end‐
use customers, shall first acquire all available energy efficiency and demand reduction resources
that are cost effective, reliable, and feasible.
(b) On or before June 1, 2007, and by June 1 of every third year thereafter, each local publicly
owned electric utility shall identify all potentially achievable cost‐effective electricity efficiency
savings and shall establish annual targets for energy efficiency savings and demand reduction for
the next 10‐year period. A local publicly owned electric utility's determination of potentially
minimum investments undertaken pursuant to Section 385. A local publicly owned electric utility
shall treat investments made to achieve energy efficiency savings and demand reduction
targets as procurement investments.
(c) Within 60 days of adopting annual targets pursuant to subdivision (b), each local publicly owned
electric utility shall report those targets to the State Energy Resources Conservation and Devel‐
opment Commission, and the basis for establishing those targets.
(d Each local publicly owned electric utility shall report annually to its customers and to the
State Energy Resources Conservation and Development Commission. The report shall contain,
but is not limited to, both of the following:
(1) Its investments in energy efficiency and demand reduction programs.
(2) A description of programs, expenditures, cost‐effectiveness, and expected and actual
energy efficiency savings and demand reduction results.
(e) Each local publicly owned electric utility shall also annually develop and submit to the State Energy
Resources Conservation and Development Commission a report containing all of the following:
(1) The sources of funding for its investments in energy efficiency and demand reduction pro‐
gram investments.
(2) The methodologies and input assumptions used to determine cost‐effectiveness.
(3) The results of an independent evaluation that measures and verifies the energy efficiency savings
and reduction in energy demand achieved by its energy efficiency and demand reduction programs.
These reporting requirements are similar to the CPUC’s Evaluation, Measurement and Verification (EM&V)
process for PG&E’s programs.
Public Utilities Code Section 385 requires a minimum expenditure of 2.85% of revenues on public pur‐
pose programs, as discussed above, and Section 9615 supersedes this requirement and changes the focus
to project energy savings. Public Resources Code 25310 imposes a similar requirement on PG&E. As with
all other ratemaking and investment actions by any public utility, authority over this provision is trans‐
ferred from the CPUC to the public utility’s governing board. Under the proposed project, SSJID would
be required to report on the expenditures on and performance of its energy efficiency programs to the
California Energy Commission under SB 1037.
The proposed retail electric service plan includes SSJID implementing various energy management pro‐
grams (see the Public Purpose Programs in Table 2‐7 of this EIR and Table 3.13‐6; SSJID, 2009a). How‐
ever, the specific programs would need to be adopted in future actions by the SSJID Board of Directors
following a review of the cost effectiveness of the options.
3.13.2
Environmental
Impacts
and
Mitigation
Measures
3.13.2.1
Significance
Criteria
CEQA requires that EIRs include a discussion of the potential energy impacts of proposed projects where
there is a possibility of “wasteful, inefficient, and unnecessary consumption of energy.” (See Public
Resources Code Section 21100(b)(3).) Appendix F of the State CEQA Guidelines specifically requires con‐
sideration of any potentially significant energy implications of a project in an EIR and directs lead
decreasing overall per capita energy consumption,
decreasing reliance on fossil fuels such as coal, natural gas and oil, and increasing reliance on renewable energy sources.
For this analysis, impacts would be considered potentially significant if the proposed Project would cause
inefficient, wasteful, and unnecessary consumption of energy. This analysis addresses the following potential
energy‐related impacts outlined in CEQA Appendix F:
Would the project result in substantial new energy requirements or significant energy use inefficiencies
for any stage of construction, operation and/or maintenance?
Would the project cause a significant adverse effect on local and regional energy supplies and on require‐
ments for additional capacity?
Would the project cause a significant adverse effect on peak and base period demands for electricity
and other forms of energy?
Would the project disrupt compliance with existing energy standards? Would the project cause a significant adverse effect on energy resources?
Would the project result in significant adverse effects related to transportation energy use?
3.13.2.3
Impacts
and
Mitigation
The following section analyzes the impacts to energy resources of the four separate actions: Sphere Plan and Municipal Services Review,
Proposed Expanded Sphere of Influence, Proposed 80‐acre annexation, and
Updated Plan to Provide Retail Electric Service.
Sphere
Plan
and
Municipal
Services
Review
Adoption of the Sphere Plan and MSR would not in itself influence per capita energy consumption within
the SOI or cause a change in the reliance on fossil fuels or renewable resources by SSJID or its customers.
The infrastructure improvements likely to be necessary to provide an adequate level of service within
the SOI are described in Section 2.3.1, and the MSR provides determinations as to the ability of SSJID to
provide adequate public services. However, infrastructure improvements that have been previously
approved or planned are not part of the proposed project, and the existing services provided by SSJID as
described in the Sphere Plan and MSR are part of the baseline and environmental setting. No construc‐
tion activities are proposed for approval with the potential adoption of the Sphere Plan and MSR.
Providing retail electric service would be a separate action from adoption of the MSR; as such, the poten‐
tial effects are described separately below. If the MSR is adopted without implementing the plan for
retail electric service, PG&E and MID would continue to provide electricity and continue to sponsor their
existing public purpose programs for reducing per capita electricity use. With retail electric service pro‐
vided by PG&E and MID in the future, existing trends on power purchases and existing efforts to comply
with the RPS would continue unchanged.
Adoption of the MSR would not affect the existing energy supplies within the SOI nor would it change
lines and electricity transmission or distribution facilities). Similarly, as in the baseline conditions, SSJID
would continue to use transportation fuels for mobilizing crews and equipment. The Sphere Plan and MSR
would not change SSJID’s practices of transportation fuel use for infrastructure improvements or for
providing public services.
Adopting the Sphere Plan and MSR would not cause inefficient, wasteful, or unnecessary consumption
of energy and, it would not have any effect on the energy conservation goal delineated in the State
CEQA Guidelines. Therefore, the Sphere Plan and MSR would not impact energy conservation.
Proposed
Sphere
of
Influence
The expanded sphere of influence (SOI) would make the SOI boundaries consistent with the Manteca
city limits. This proposed expanded SOI requires no construction or operation activities, and no change in
retail electric service. Because there would be no energy‐consuming activities or electricity service modifi‐
cations related to the SOI expansion, this would not influence per capita energy consumption within the
SOI or cause a change in the reliance on energy resources by SSJID or its customers. Adopting the
expanded SOI would not cause inefficient, wasteful, or unnecessary consumption of energy.
Proposed
80
‐
Acre
Annexation
The proposed 80‐acre annexation would involve minor construction activity to install a sprinkler sump
from the existing SSJID irrigation facilities. This construction would require some energy consumption. How‐
ever, it would be limited in nature, and it would rely exclusively on existing energy resources. Delivering
irrigation water to the proposed annexation through existing SSJID facilities would reduce the energy
use of the landowner by providing a surface water supply alternative to groundwater pumping, which is
more energy‐intensive than surface delivery. Because there would be no notable change in energy‐
consuming activities and no change in electricity service providers related to the annexation, this would
not influence per capita energy consumption within the SOI or cause a change in the reliance on energy
resources by SSJID or its customers. Annexing the 80‐acre property would not cause inefficient,
wasteful, or unnecessary consumption of energy. This annexation has been proposed as a separate
action wholly independent of and for distinctly different reasons than SSJID’s proposed plan to provide
retail electric services, and it is not dependent in any way upon SSJID’s separate proposal to provide
such electric services.
Updated
Plan
to
Provide
Retail
Electric
Service
Approval of the plan to provide retail electric service would allow SSJID to replace PG&E in making power
purchasing decisions and implementing programs that may influence the per capita energy consumption
by SSJID customers. The following analysis discusses whether the retail electric plan could have an effect
on the energy conservation goals delineated in the State CEQA Guidelines.
Public Utilities Code Section 399.8(b) requires investor‐owned utilities to devote a specific amount of
retail revenues to their respective Public Purpose Programs, such that “ (t)his rate component may not
exceed, for any tariff schedule, the level of the rate component that was used to recover funds authorized
pursuant to Section 381 on January 1, 2000.” PG&E is required to spend at least $368 million on renew‐
ables, energy efficiency and research. Low‐income assistance is an additional element that is dictated by
other formulas in state law. However, PG&E’s current spending on Public Purpose Programs is greater
than what is legally required. Reporting required by PUC Section 747 indicates that $592 million, or 4.7%
Low Income Energy Efficiency, Affordable Solar Housing, and administration of PG&E’s rate discount for
low‐income customers (California Alternate Rates for Energy or CARE) (CPUC, 2011). This amount
represents a benchmark for energy‐efficiency expenditures by the current serving utility. Another 3.4%
goes to PG&E’s rate discount for low‐income customers in the CARE program. In total, PG&E is projected
to collect $939 million or 8.1% of current retail revenues (PG&E, 2010a) for Public Purpose Program
funds and CARE subsidies.
SSJID considers Public Purpose Programs to be third in the hierarchy of what is important to customers,
after service reliability and service costs. Reducing electric rates is a key objective of SSJID (Section 2.2 of
this Subsequent EIR), and rate reductions would provide a direct public benefit to all SSJID’s customers.
In addition to lower rates, SSJID’s plan to provide retail electric service would allocate 4% of gross reve‐
nues to energy‐efficiency Public Purpose Programs. This would exceed the minimum of 2.85% required
under state law for publicly owned utilities. SSJID’s level of spending would be comparable to PG&E’s
average spending across its entire territory on energy efficiency and renewable energy programs (4.7%
of PG&E retail revenues).
SSJID’s proposal to reduce rates for all customers would provide the greatest benefits to lower‐income
customers. SSJID does not explicitly propose matching PG&E’s funding of its CARE rate discount (3.4% of
PG&E retail revenues). However, SSJID proposes to implement a comparable low‐income rate discount
(see Table 3.13‐6), and SSJID’s overall rate design proposes to reduce customer rates across all classes,
which would provide assistance to low‐income customers similar to that provided by PG&E’s existing
CARE discount. Comparing the benefits would require a complex analysis of CARE customers within
SSJID’s boundaries, taking into account customers’ income, household size, and energy usage, most of
which data is confidential and held by PG&E. Thus, a full direct comparison of PG&E’s and SSJID’s pro‐
posed public purpose program spending is not possible. SSJID’s proposal for Public Purpose Programs is
shown in the Project Description and in Table 3.13‐6.
SSJID has no immediate plans to annex areas within Area “D” or Area “E” (Figure 2‐2 in the Project
Description) or to provide retail electric service in these areas. These areas are outside the current SSJID
territory, but inside its current and proposed SOI. However, if the current proposal for retail electric ser‐
vice is approved and if the areas are annexed in the future, SSJID would likely expand this service to Area
“E” within 10 years and to Area “D” within 30 years. Foreseeable future impacts from this possible
expansion of SSJID’s retail electric service are addressed generally as programmatic impacts. Specific
proposals for annexations or service beyond SSJID’s existing territory may need to undergo the project‐
level environmental review process and other required approvals should SSJID decide to pursue such an
annexation or service expansion in the future.
Impact
3.13
‐
1:
Result
in
substantial
new
energy
requirements
or
energy
use
inefficiencies
Changes in the overall per capita energy consumption associated with the proposed plan to provide
retail electric service would stem directly from the proposed changes in energy efficiency, and energy
conservation programs resulting from the replacement of PG&E as the primary electric service provider
in the SSJID territory. This discussion focuses on the proposed changes of replacing PG&E, because exist‐
ing MID customers in the SSJID territory would experience no change in program offerings from MID.
Energy Efficiency and Conservation
Energy efficiency programs generally aim to assist homeowners and business owners in providing more
energy efficiency programs guided by CEC and CPUC oversight (see Appendix F‐2, PG&E Energy Effi‐
ciency and Demand Response Programs).
SSJID would offer Public Purpose Programs for residential and commercial customers that would be similar
to those established by PG&E. SSJID also proposes to emphasize and focus on providing local govern‐
ments with cooperative opportunities to improve energy efficiency (p. 6‐3, SSJID, 2009a).
No detail is available on the potential effectiveness of SSJID’s proposed Public Purpose Programs in reduc‐
ing per capita energy use. Each service territory and program is unique, so extrapolating from other utilities’
programs would be speculative. SSJID expects that its public benefit program costs will represent approxi‐
mately 4% of its retail revenues.
It is difficult to compare PG&E’s energy efficiency programs with those proposed by SSJID. As discussed previ‐
ously, data on the effectiveness of PG&E’s programs is public (CPUC dockets for Order Instituting Rule‐
making 06‐04‐010 and Application 08‐07‐021), but public data is not available at a detailed‐enough level
to discern the baseline success of the programs for customers in the SSJID territory. Systemwide aver‐
ages may not be indicative of program effectiveness at the local level because of diversity of customer
types across PG&E’s service area. Without more specifics about the nature of and participation rates in
PG&E’s programs in the SSJID territory, it would be speculative to draw conclusions as to whether energy
efficiency programs of the proposed retail electric service plan would result in changes in energy conser‐
vation and per capita energy consumption.
Energy Conservation
SSJID expects to provide electric service at customer rates that will be lower than PG&E’s rates. Overall,
customers served by SSJID may consume more electricity under the proposed electric plan because of
SSJID’s lower rates. Absent final rate forecasts for the SSJID customers, this analysis does not quantify
whether the change in retail electric service provider would cause customers to consume more elec‐
tricity because of lower rates. Without knowing the specifics of the amount and the timing of the rate
reductions and how the rate design for specific customers will differ from PG&E’s current and
prospective rate designs, it is speculative to estimate the magnitude of any change. The state has not
established any other standards for what constitutes “inefficient” use beyond specific demand response
and energy efficiency targets. See Section 3.13.1.2 for Applicable Regulations and Policies.
Publicly owned utility energy efficiency programs tend to be cost‐effective and provide high benefits per
cost. According to the most recent SB 1037 Report on publicly owned utility energy efficiency programs,
the average total resource cost (TRC) ratio for benefits compared to costs was 3.15 for the 2009‐10 fiscal
year (CMUA, 2011). The largest fifteen publicly owned utilities averaged a TRC of 3.8 in 2009 (CEC,
2010c). SSJID proposes to base its programs on other successful publicly owned utility programs such as
at MID and SMUD (SSJID, 2009a, p. 6‐2). The ratios for MID’s and SMUD’s programs vary from year‐to‐
year, and for 2008 were 2.71 and 1.93, respectively. Comparing these cost‐effectiveness metrics to PG&E’s
data would be misleading due to differences in key assumptions (CEC, 2010c). For informational pur‐
poses, PG&E’s TRC for its programs in 2009 was 1.62 (PG&E, 2010c) and 1.28 for its 2006‐2008 programs
(CPUC, 2010b). Based on this data, SSJID might expect to achieve similar or greater energy savings per
dollar expended compared to PG&E. Due to the complexity of the relationships between utility pro‐
grams and demand, the lack of detail available about energy efficiency and demand response programs
(identified under Impact 3.13‐1), and the limited effect the utility may have on demand, it would be
speculative to conclude that the proposed retail electric service plan would result in less energy conservation
Without a full energy efficiency program plan and determining its relationship to future demand, it would
be speculative to assess how SSJID will comply with the AB 2021 energy efficiency goals. Developing a
plan to comply with the AB 2021 goals is specifically required under state law.
Conclusion on Significance of Energy Use Inefficiencies
The SSJID retail electric service plan would include changes in energy efficiency and conservation pro‐
grams, but forecasting the effectiveness of the programs is difficult due to their preliminary natures.
Likewise, data on the effectiveness of PG&E’s programs is public but not available at a detailed‐enough
level to analyze potential impacts within the customer base in the SSJID territory.4 The local charac‐
teristics are not comparable because of the diversity of customer characteristics within PG&E’s service
territory and geographic clustering of certain types of customers such as the agricultural and heavy air
conditioning loads. Consumption may increase or remain unchanged with the change in providers and
resulting changes in rates, while energy use reduction measures may be more or less effective than
those currently managed by PG&E. Note that SSJID would be required to ensure access to feasible energy
efficiency and conservation measures through its proposed Public Purpose Programs (in Table 2‐7 of this
EIR and Table 3.13‐6; SSJID, 2009a) and to comply with state‐level public purpose requirements that
apply to all publicly owned utilities. Implementing the proposed programs in compliance with state law
would avoid inefficient, wasteful, or unnecessary consumption of energy.
The impacts of the possible future expansion of SSJID’s retail electric service to Area “D” or Area “E”
(Figure 2‐2 in Chapter 2, Project Description) would be similar to these impacts described for the pro‐
posed project; however, there are no plans for this possible expansion currently under consideration.
Impact
3.13
‐
2:
Cause
an
adverse
effect
on
local
and
regional
energy
supplies
and
requirements
for
additional
capacity
because
of
inefficient,
wasteful,
or
unnecessary
energy
use
The proposed plan to provide retail electric service would expand the capacity of the existing electric
distribution system, as needed to ensure that the distribution substations can reliably accommodate
load within the SSJID territory and in areas served by proposed SSJID facilities outside the SSJID territory.
Modifications to distribution substations and circuits presently owned by PG&E and MID would be nec‐
essary to separate the system and to provide the capacity to SSJID’s customers. No other energy
delivery systems would be affected. SSJID proposes no new power plants or electric generating facilities.
By changing the owner and operator of the local electric distribution facilities, the retail electric service
plan would not change any other energy delivery infrastructure (such as petroleum or gas pipelines or
electricity transmission facilities).
The Project Description (see Table 2‐1, Section 2) describes the existing PG&E and MID transmission and
distribution facilities for areas within the District. With the proposed retail electric service plan, power
would continue to be delivered to substations within SSJID’s territory over the existing transmission
lines owned by PG&E and MID. To assure coordinated transmission system planning and compliance,
SSJID intends to participate in the Western Electricity Coordinating Council (WECC) and North American
Electric Reliability Council (NERC).
4
To analyze the current effectiveness of PG&E’s programs within SSJID’s proposed service area prior to estab‐
lishing the new utility would require that SSJID be able to access PG&E’s customer data. This in turn would require
gaining permission to see confidential customer data from each individual customer. This legal requirement
San Joaquin LAFCo requested an opinion from the CPUC on the effect of SSJID’s proposal to provide retail
electric service within PG&E’s service territory. The CPUC issued Resolution E‐4301 on December 17, 2009,
and the CPUC opinion provides a finding that SSJID’s proposed service could raise rates for PG&E’s
remaining ratepayers but the magnitude of the estimated increase is small relative to PG&E’s current
system average rates, and thus does not substantially impair PG&E’s ability to provide adequate service
at reasonable rates.
Local and regional energy supplies would not be directly affected. PG&E and MID currently ensure ade‐
quate electricity supplies for customers in the SSJID territory. By entering into retail electric service, SSJID
would alleviate the need for PG&E to acquire power for the departing customers; SSJID would assume
that responsibility. SSJID would take steps to plan and expand the capacity of the distribution system as
needed to respond to load growth. The overall availability of local and regional energy supplies would
not change. The proposed retail electric service plan would not cause inefficient, wasteful, or unneces‐
sary energy use that could have adverse effects on local and regional energy supplies or requirements
for additional capacity.
The impacts of the possible future expansion of SSJID’s retail electric service to Area “D” or Area “E”
(Figure 2‐2 in Chapter 2, Project Description) would be similar to these impacts described for the pro‐
posed project; however, there are no plans for this possible expansion currently under consideration.
Impact
3.13
‐
3:
Cause
an
adverse
effect
on
peak
and
base
period
demands
for
electricity
and
other
forms
of
energy
because
of
inefficient,
wasteful,
or
unnecessary
energy
use
Peak load periods in the SSJID territory coincide with high temperatures in the San Joaquin Valley and
subsequent air conditioner usage. The San Joaquin Valley load substantially contributes to the summer
peak demand for electricity relative to PG&E’s system average. This means that with the proposed elec‐
tric plan, the need for PG&E to provide future generation capacity for summer peak loads would be
reduced in areas served by facilities acquired by SSJID. SSJID would assume this responsibility for serving
the peak demand in its territory.
The peak and base period energy demand can be influenced by: retail rate levels and design (i.e., usage
demand and energy charges, customer connection charges), inclusion of low income rate assistance,
energy efficiency and demand response program implementation and participation, and changes in socio‐
economic patterns. SSJID has experience in helping electric customers in the SSJID territory to reduce
their peak electric usage by installing controls in Manteca residences through the Easy Green program.
This kind of demand response program could be used by SSJID along with rate design to influence peak
period demand. However, demand would remain primarily driven by the climate and customer base.
Demand Response Programs
Demand response consists of an electric service provider’s capability to reduce energy usage of customers
to provide electric load relief in the event of energy shortages or local or regional system emergencies.
PG&E has a long history of providing demand response programs designed to curtail energy use. PG&E
relies on its tariffed rates to encourage commercial and industrial customers to participate in inter‐
ruptible load programs. Examples of existing demand response are the Schedule E‐BIP – Base Interruptible
Program and residential air conditioner cycling (see Appendix F‐1, PG&E’s Demand Response Programs).
Prior to applying for approval of the updated retail electric plan, SSJID developed a demand response