VTI rapport 645A Published 2009
www.vti.se/publications
The effect of milled rumble strips versus virtual
rumble strips on sleepy drivers
A driving simulator study
Anna Anund Albert Kircher Andreas Tapani
Publisher: Publication:
VTI rapport 645A
Published: 2009 Project code: 40557 Dnr: 2003/0170-23
SE-581 95 Linköping Sweden Project:
IN-SAFETY
Author: Sponsor:
Anna Anund, Albert Kircher and Andreas Tapani Swedish Road Administration and EU
Title:
The effect of milled rumble strips versus virtual rumble strips on sleepy drivers – a driving simulator study
Abstract (background, aim, method, result) max 200 words:
This report describes the method, results and conclusions from a driving simulator experiment with the aim to evaluate the effect of two scenarios of importance selected on a theoretical framework within IN-SAFETY. One additional aim was to investigate consequences of driver state (alert/sleepy) on system effectiveness.
One out of two scenarios was related to lane departure warning in terms of milled rumble strips or as a driver support system. In relation to “lane departure warning”, the experiment considered possibilities and consequences of replacing the infrastructure element milled rumble strips with a haptic in-vehicle system. The case of centre and shoulder line rumble strips on a two-lane highway was studied and compared with a baseline.
The second scenario was focusing on the effect of an in vehicle warning system about school bus ahead simulating a system based on vehicle to vehicle information. In-vehicle “School bus ahead warning” was considered as an example of in-vehicle information used to inform the driver of upcoming events. In total 20 (10 male and 10 females) participated in the experiment. Two conditions were used: one after a night sleep (alert) and one after a night awake (sleepy). The alert condition was after a night sleep; the sleepy condition was after a night awake. The order was balanced for gender and condition.
The results showed that there is a potential to substitute the infrastructure measure rumble strips with an in-vehicle assistance system. Moreover, in-vehicle information was found to be an effective way of reducing the subjects’ speeds during temporary safety critical situations.
Keywords:
Driver sleepiness, milled rumble strips, virtual rumble strips, driving simulator
ISSN: Language: No. of pages:
Utgivare: Publikation:
VTI rapport 645A
Utgivningsår: 2009 Projektnummer: 40557 Dnr: 2003/0170-23 581 95 Linköping Projektnamn: IN-SAFETY Författare: Uppdragsgivare:
Anna Anund, Albert Kircher och Andreas Tapani Vägverket och EU
Titel:
Effekten av frästa räfflor jämfört med virtuella på pigga och sömniga förare – en simulatorstudie
Referat (bakgrund, syfte, metod, resultat) max 200 ord:
Föreliggande rapport beskriver metod, resultat och slutsatser från ett simulatorförsök där syftet var att utvärdera effekten av två olika scenarion som på teoretisk basis valts ut inom projektet som potentiella lösningar i framtida transportsystem. Syfte var vidare att utvärdera betydelsen av förarens tillstånd (pigga och sömniga) för givna situationer.
Sammanlagt deltog 20 försökspersoner lika fördelade på män och kvinnor och i balanserad ordning. Två scenarion ingick. Det ena scenariot var ”lane departure warning” i termer av frästa räfflor jämfört med motsvarande åtgärd, men som förarstöd. Syftet var att utreda om den infrastrukturbaserade räfflan har samma effekt på förares beteende som den fordonsbaserade varningen, i vilka räfflan inte syns. I försöket var vägen försedd med räfflor både i mitten av vägen och på vägkanten. Jämförande scenario var inga räfflor alls. Det andra scenariot var ett fordonsbaserat varningssystem som varnar om det finns en stillastående skolbuss längre fram. Systemet var tänkt att utgå från en kommunikation mellan fordon. Skolbussen var tänkt som ett exempel på händelsebaserad information i fordonet.
Resultaten visade att det finns en potential i att byta infrastrukturbaserade räfflor mot system som genererar samma effekt, men som ett förarstöd. Det kunde även konstateras att fordonsbaserad
information om en händelse längre fram t.ex. stannad skolbuss reducerade förbipasserandes hastighet. Hastighetsreduceringen var ett faktum såväl när försökspersonerna var utvilade som när de led av sömnbrist.
Nyckelord:
Trötthet, frästa räfflor, virtuella räfflor, simulatorstudie
Foreword
This study has been possible to perform thanks to the Swedish Road Administration and to the EU project IN-SAFETY.
I would like to thank Beatrice Söderström, Andreas Tapani and Anne Bolling for their excellent work in most of the topics related to the planning of the experiment. I would also like to thank Andreas Tapani and Albert Kircher for their valuable work during analysing and writing of the report. Last but not least I would like to thank all
participants coming to VTI twice, once after a good night’s sleep and once after a night without sleep. Without you the study had not been possible.
Linköping October 2008
Quality review
Review seminar was carried out on Marsh 7, 2008 where Anne Bolling reviewed and commented on the report. Anna Anund has made alterations to the final manuscript of the report. The research director of the project manager, Lena Nilsson, examined and approved the report for publication on October 31, 2008.
Kvalitetsgranskning
Granskningsseminarium genomfört 2008-03-07 där Anne Bolling var lektör. Anna Anund har genomfört justeringar av slutligt rapportmanus. Projektledarens närmaste chef, Lena Nilsson, har därefter granskat och godkänt publikationen för publicering 2008-10-31.
Table of contents
List of Figures... 5 List of Tables ... 6 List of abbreviations ... 7 Summary ... 9 Sammanfattning ... 11 1 Introduction ... 132 Aim and Hypotheses... 16
2.1 Aim ... 16
2.2 Hypotheses... 16
3 Method... 17
3.1 Subjects ... 17
3.2 Experimental design ... 18
3.3 Experimental setting – moving base driving simulator ... 19
3.4 Scenario, driving task ... 21
3.5 Measures ... 22
3.6 Procedure ... 29
3.7 Statistical analysis ... 30
4 Results... 32
4.1 Rumble strips... 32
4.2 Normal night with sleep vs. not having slept during the night ... 40
4.3 School bus – in vehicle information system ... 51
5 Discussion and conclusions... 56
5.1 Method... 56
5.2 Results... 57
List of Figures
Figure 1 Moving base driving simulator at VTI. ... 20
Figure 2 Base line and scenario without rumble strips. ... 21
Figure 3 Information on LCD display about school bus ahead. ... 22
Figure 4 Mean scored KSS for each 5 minutes during drive (bars represent SE of mean). The first score represents the KSS-value when starting to drive. ... 26
Figure 5 The Vitaport 2 digital recorder. ... 27
Figure 6 Placement of EOG electrodes... 27
Figure 7 4-split DVD-screen... 28
Figure 8 At the laboratory putting on electrodes for the EOG before driving... 29
Figure 9 Driver seated and ready to drive the 90 km... 30
Figure 10 Very low distance to car ahead before overtaking. ... 34
Figure 11 Subjects opinion about the sound (n=20). One subject did not answer the question... 37
Figure 12 Subjects opinion about the vibrations. There was one subject that did not answer the question. ... 37
Figure 13 Usefulness and acceptance of milled rumble strips... 38
Figure 14 Usefulness and acceptance of virtual rumble strips... 38
Figure 15 Results of question: “Do you think that your willingness to overtake will be influenced during the described conditions (alert/sleepy– milled rumble strips/virtual rumble strips)?”... 39
Figure 16 The subjects’ average rate of usefulness for different warning signals related to real rumble strips or virtual rumble strips. SE=standard error of mean. ... 40
Figure 17 Number of overtakings distributed over sections with no rumble strips, real rumble strips and virtual rumble strips (All overtakings included – n=20)... 41
Figure 18 Time used for overtaking. Design: 1= no rumble strips (NRS); 2=real r umble strips (RRS) and 3= virtual rumble strips (VRS); condition: 1= Night sleep; 2=no sleep (n=20)... 42
Figure 19 Minimum distance to car ahead - while not overtaking ... 43
Figure 20 Minimum lateral distance to car ahead during overtaking. ... 44
Figure 21 Average speed - no overtaking chance or no overtaking (n=20)... 45
Figure 22 Maximum speed - no overtaking chance or no overtaking (n=20). Night sleep and no sleep condition... 46
Figure 23 Standard deviation in average speed without overtaking/overtaking chance. ... 46
Figure 24 Average speed only during overtaking... 47
Figure 25 Average speed only during overtaking... 48
Figure 26 Average lateral position without overtaking or not during overtaking chance. ... 49
Figure 27 Standard deviation in lateral position – no overtaking/overtaking chance... 49
Figure 28 Minimum lateral position during the total drive (closest to outer margin of the road). ... 50
Figure 29 Speed development in bus situation without warning. ... 52
Figure 30 Speed development bus situation with warning. ... 52
Figure 32 Speed development for night sleep and no sleep condition in bus situation
with and without warning. ... 54
Figure 34 Lateral position is measured from the middle lane to the centre of the car. Lateral position= 0 means car is driving exacly on the middle line. When driving normally in the right lane the lateral position is approx. -2 meters. .. 1
Figure 35 Overtaking a car ahead. ... 1
Figure 36 Typical overtaking plotted. Lateral position of own car, distance to car ahead and speed of own car are shown... 2
Figure 37 Overtaking algorithm with points used. ... 3
List of Tables Table 1 Experiment design table ... 18
Table 2 Technical data about the VTI Driving simulator III... 20
Table 3 Recorded basic measurements... 23
Table 4 Calculated measures ... 24
Table 5 Karolinska sleepiness scale (KSS) ... 25
Table 6 Number of overtakings separated for subject, condition and design... 32
Table 7 Number of overtakings. ... 33
Table 8 Average time for overtaking manoeuvre in the three rumble strip modes. .. 33
Table 9 Average number of overtakings and sd (n=12). ... 41
Table 10 Average time for overtaking (n=12)... 42
Table 11 Paired samples t-test results for speed in warning versus no warning condition. ... 54
List of abbreviations
ADAS Advanced Driver Assistance Systems
EU European Union
ESS Epworth Sleepiness Scale
FRE Forgiving Road
HMI Human Machine Interface
RLS Rest less legs syndrome – Questionnaire
IST Information Society Technologies
ITS Intelligent Transport Systems
IVIS In Vehicle Information Systems
KSS Karolinska Sleepiness Scale. A self rated sleepiness score.
LCD Liquid crystal display
NRS No rumble strips
RRS Real milled rumble strips (visible)
SER Self Explaining Roads
TH Time headway (time necessary to reach the point where the
car ahead is when keeping constant speed with actual distance to car ahead.
TMIC Traffic Management Information Centre
TTC Time to collision (time necessary to touch car ahead when
both are keeping actual speed and distance).
V2V Vehicle to Vehicle
VRS Virtual rumble strips (not visible)
The effect of milled rumble strips versus virtual rumble strips on sleepy drivers – a driving simulator study
by Anna Anund, Albert Kircher and Andreas Tapani
VTI (Swedish National Road and Transport Research Institute) SE-581 95 Linköping Sweden
Executive summary
The aim of the EU project IN-SAFETY is to create effective combinations of traditional infrastructure measures combined with new technology to increase the self-explanatory and forgiving nature of the road traffic system.
This report describes the method, results and conclusions of a driving simulator experiment with the aim to evaluate the effect of two scenarios of importance selected on a theoretical framework within IN-SAFETY: lane departure warning in terms of milled rumble strips or as a driver support system, and the effect of an in-vehicle warning system informing there is a school bus ahead, simulating a system based on vehicle to vehicle information.
Concerning the “lane departure warning”, the experiment considered possibilities and consequences of replacing the infrastructure element milled rumble strips with a haptic in-vehicle system. Both centre and side line rumble strips on a two-lane highway were studied and compared with a baseline. In-vehicle “School bus ahead warning” was considered as an example of in-vehicle information used to inform the driver of upcoming events. Both rumble strips and school bus warning was studied for drivers after not having slept the night before driving as well as after a night’s sleep in order to investigate consequences of driver state on system effectiveness.
The results showed that there is a potential to substitute the infrastructure measure rumble strips with an in-vehicle assistance system. Moreover, in-vehicle information was found to be an effective way of reducing the subjects’ speeds during temporary critical situations concerning traffic safety.
Effekten av frästa räfflor jämfört med virtuella på pigga och sömniga förare – en simulatorstudie
av Anna Anund, Albert Kircher och Andreas Tapani VTI
581 95 Linköping
Sammanfattning
EU projektet IN-SAFETY hade som syfte att genom att kombinera traditionella infrastrukturella åtgärder med ny teknik få en väg som är mer självförklarande och förlåtande jämfört med dagens vägar.
Föreliggande rapport beskriver metod, resultat och slutsatser från ett simulatorförsök där syftet var att utvärdera effekten av två olika scenarion som på teoretisk basis valts ut inom projektet som potentiella lösningar i framtida transportsystem. Det ena var ”lane departure warning” i termer av frästa räfflor jämfört med motsvarande åtgärd men som förarstöd. Det andra var ett fordonsbaserat varningssystem som varnar om det finns en stillastående skolbuss längre fram. Systemet var tänkt att utgå från en kommunikation mellan fordon.
Avseende “lane departure warning”, så fokuserade försöket på att utreda om den infrastrukturbaserade räfflan har samma effekt på förares beteende som den fordons-baserade varningen, i vilka räfflan inte syns. I försöket var vägen försedd med räfflor både i mitten av vägen och på vägkanten. Jämförande scenario var inga räfflor alls. Skolbussen var tänkt som ett exempel på händelsebaserad information i fordonet. Såväl ”lane departure” som skolbuss studerades då förarna var dels pigga, dels sömniga. Syftet var att utvärdera betydelsen av förarens tillstånd för givna situationer. Sammanlagt deltog 20 försökspersoner lika fördelade på män och kvinnor och i balanserad ordning.
Resultaten visade att det finns en potential i att byta infrastrukturbaserade räfflor mot system som genererar samma effekt, men som ett förarstöd. Det kunde även konstateras att fordonsbaserad information om en händelse längre fram till exempel, stannad
skolbuss reducerade förbipasserandes hastighet. Hastighetsreduceringen var ett faktum såväl när försökspersonerna var utvilade som när de led av sömnbrist.
1 Introduction
Over 42,000 road users are killed in European Union (EU) countries annually and around 3.5 million are injured, when under-reporting is taken into consideration. This accounts for an annual cost of over 160 billion Euros and untold pain and suffering of the victims and their relatives. Looking at fatality numbers, car occupants are the largest single casualty group. They comprise 57% of total EU road deaths, with the majority of car occupant casualties sustained in side and frontal impacts. Looking at fatality risk however, the traffic system is less safe for the more vulnerable road users, where the risk of death on EU roads is substantially higher than for car occupants. Indeed, for pedestrians and cyclists the risk is 8–9 times higher and for motorcyclists it is 20 times higher than for car drivers.
Thus, infrastructure improvements and enforcement campaigns are not expected to significantly contribute towards the 50% reduction of road fatalities, as is the target by the EU for 2010. The use of new technologies may become the catalyst towards
achieving this goal, especially since the combination of new technologies with existing infrastructure, or with limited improvements of it, may lead to much more cost-effective solutions. However, the rather high cost of traditional infrastructure construction / adaptations is a prohibiting factor. The combination of new technologies with existing infrastructure may lead to much more cost-efficient solutions.
IN-SAFETY project aims to use intelligent, intuitive and cost-efficient combinations of new technologies and traditional infrastructure best practice applications, in order to enhance the forgiving and self-explanatory nature of roads, by:
• Building consensus on priorities for regulation and standardisation processes and assessing the potential and cost-effectiveness of combined use of such new technologies (ADAS, IVIS) and innovative HMI concepts.
• Developing and testing new simulation models (micro- and macro-) and risk analysis tools, in order to estimate the safety of road environments.
• Developing training tools and curricula for road and TMIC operators, focusing on the use of new technologies.
• Harmonising / optimising vertical and horizontal signing and adapting their information to the specific needs and wants of each user.
• Issuing priority implementation scenarios, guidelines for further research and policy recommendations for cost-efficient road environment development, road safety assessment and inspection, including new technological elements. Except for two work packages focusing on Administration and
Dissemination/Exploitation the EU project IN-SAFETY has five work packages focusing on:
• Implementation scenarios and concepts towards forgiving road environments
• Implementation scenarios and concepts towards self-explaining road environments
• New models, tools and guidelines for road safety assessment
• Pilots implementation and tests
Here a self-explaining road was defined as: “A road designed and built is such a way as to induce adequate behaviour and thereby avoid driving error”. An example is: roads have a recognisable road layout dependent on the road category [in accordance to CROW, 1997]. The definition of a forgiving road was a road designed and built in such a way as to interfere with or block the development of driving error, to avoid or mitigate negative consequences of driving error, therefore allow the driver to regain control and either stop or the return to the travel lane without injury or damage. For instance:: roads have structural layout elements that reduce the consequences of accidents once they happen [in accordance to CROW, 1997]
Within the IN-SAFETY a categorisation of errors (resulting in accidents) was made in order to establish a transparent estimation of the effects of a forgiving road environment on the basis of these errors. A total of 18 alternative systems contributing to the creation of a forgiving road (FOR) and a self-explaining road (SER) environment have been identified. These 18 systems were obtained by combining the six most important causes of errors identified in accident statistics (excessive speed in unexpected sharp bends, speeding in general, violation of priority rules, wrong use of the road, failure when overtaking and insufficient safety distance), with three dimensions along which systems can be developed (the vehicle, the infrastructure and the coordination between the vehicle and the infrastructure). From this a final selection of scenarios was done. Within the IN-SAFETY project these would be in focus at four different test sites: Germany (Stuttgart), Italy (Torino), Greece (Athens) and in a moving based driving simulator in Sweden (Linköping).
Scenario 1: VMS information into vehicle (e.g. speed)
• Description: Self-explaining system that assists drivers with special information (here for example speed)
• Referred error: inappropriate speed where VDS/VMS is implemented
• Type of system: Warning is displayed on VMS at roadside and information is emitted into car.
Scenario 2: School bus ahead warning
• Description: Self-explaining system that informs about e.g. school buses ahead
• Referred error: when there are unprotected road users
• Type of system: Warning is displayed in vehicle only.
Scenario 3: Safe curve speed warning
• Description: Self-explaining system that aids drivers when driving too fast in curves
• Referred error: Exceeding safe speed in curves
Scenario 4: Lane Departure Warning
• Description: Forgiving system that assists drivers when leaving the road unintended
• Referred error: Wrong use of the road
• Type of system: Vehicle autonomous
(in addition, also with roadside beacons emitting local conditions (e.g. road works).
Scenario 5:Overtaking Assistant with lane separation (Blind spot) • Description: Forgiving system that assists drivers while overtaking
• Referred error: Failure while overtaking
• Type of system: Vehicle autonomous.
Scenario 6: Overtaking Assistant without lane separation (rural roads)
• Description: Forgiving system that assists drivers while overtaking
• Referred error: Failure while overtaking
• Type of system: Vehicle autonomous.
This report will describe the results from the moving based driving simulator experiment. Forgiving Road Environment (FRE) – scenario group 2 and Self-Explanatory Road Environment (SER) – scenario group 4 was evaluated.
2
Aim and Hypotheses
2.1 Aim
Rumble strips
The aim of this driving simulator study was to study the effects of haptic in-vehicle HMI as a substitute for installed infrastructure elements to increase the forgiving and self-explanatory nature of rural road environments. The infrastructure elements considered are milled rumble strips. The effects of milled rumble strips and in-vehicle “virtual” rumble strips was studied for both night sleep (alert) and no sleep (fatigue) drivers since there is a need for knowledge taking into account the differences between driver status. This information will be used in order to improve the rural simulation model RutSim (Tapani, 2005) and take into account different driver behaviour when overtaking.
In vehicle information – in order to reduce speed
The aim was also to evaluate the effectiveness of in-vehicle information about temporarily oncoming events, for example when a school bus stops for taking on or leaving children at the road side.
2.2 Hypotheses
The aim of the driving simulator experiment was to test the following hypotheses.
Rumble strips:
Overtaking – Visible rumble strips will reduce the number of overtakings more than virtual non-visible (virtual) rumble strips.
Speed – Visible rumble strips will reduce speed and increase the speed variance more than non-visible rumble strips.
Vehicle position – Visible rumble strips at centre line will force vehicles more to the right with increased variance than non-visible rumble strips.
No sleep vs. night sleep:
Overtakings – No sleep drivers make fewer overtakings than night sleep drivers Overtakings – When overtaking, No sleep drivers have reduced safety margins compared to night sleep drivers.
Speed – No sleep drivers have increased speed variance compared to night sleep drivers.
In vehicle information about school bus ahead
Speed – when drivers receive an in vehicle warning about school bus ahead he/she will reduce speed more than without warning.
Lateral position – when drivers receive an in-vehicle warning about school bus ahead he/she will increase the safety distance to the bus when passing compared to without warning.
3 Method
3.1 Subjects
RecruitingIn total 20 subjects participated in the study, they were equally distributed between men and female. All were shift workers recruited by advertisement. The subjects drove twice; once after having worked during the night (no sleep) and driving just after getting of the night shift (5 am–8 am), and once after a night’s sleep (alert) (9 am–4 pm). For the night sleep condition the subjects should not have been working night shift the last 5 days, this to make sure they were in alert conditions. At the no sleep condition the subjects were picked up and driven home by taxi. The subjects’ reward was set to 220 Euro.
Subject description
In total 10 male and 10 female participated. Average age was 43.5 years (sd 7), average weight 76 kg (sd 13.8) and average height 173.4 cm (sd 9.6). In average the drivers had have their driving licences for 23.7 years (sd 7.12). They reported that they have been driving 2 273 km (sd 1 597 km) last year.
Medicine was used by three of the subjects. They used Levaxin or Bricanyl/Pulmicort. Most of the subjects (12 out of 20) reported that they use alcohol 2–4 times per month, 5 subjects reported a usage less than that and 3 subjects more (2–3 times per week). The majority of the drivers were none tobacco users (14 out of 20), 3 were smokers and 3 used snuff (smokeless tobacco). Most of the drivers drink coffee (19 out of 20), 40% (8 subjects) reported drinking 5 cups or more during working days. During their days off all reported taking coffee, the majority (70%) less then 4 cups per day.
The majority of the subjects did not have problems falling asleep (75%). Five subjects reported that they sometimes have problems falling asleep. Most of the subjects did not found it difficult to wake up (90%). Two subjects found it almost always difficult to wake up.
There were five subjects that self reported snoring, one subject reported having nightmare. Two subjects reported that they often sleep less than 6 hours, 11 subjects reported that they sometimes or always do not feel rested when waking up. Among the subjects 12 reported that they sometimes feel sleepy during daytime. In total three subjects reported that they have problems to keep awake while driving. The majority of the drivers report high sleep quality (19 out of 20), 4 subjects reported that they do not sleep enough. In total 7 out of 20 (35%) drivers had experience of sleep related
incidents, however none of the drivers had been involved in a sleep related crash. The experiment was approved by an ethical committee. (Regionala etikprövnings-nämnden i Linköping (EPN), 2006 dnr 179-06).
3.2 Experimental
design
The design was a within subjects design. The order between no sleep condition and night sleep condition were balanced for sex.
The road scenario consisted of total 9 laps of 9.4 km each. The laps were divided into groups of 3. For each of those groups there was a balanced order of no rumble strips, real milled rumble strips and virtual rumble strips. The order was the same for each subject during both conditions, see Table 1.
Table 1 Experiment design table.
Baseline=0 (20 minutes)
Real rumble strips =1 (20 minutes) Virtual rumble strips=2 (20 minutes) subject Gender 1=male 2=female Condition 1=Night sleep 2=No sleep 1st 2nd 3rd 1 1 1 0 1 2 1 1 2 0 1 2 2 1 1 0 2 1 2 1 2 0 2 1 3 1 1 1 2 0 3 1 2 1 2 0 4 2 1 1 0 2 4 2 2 1 0 2 5 1 1 2 0 1 5 1 2 2 0 1 6 2 1 2 1 0 6 2 2 2 1 0 7 2 1 0 1 2 7 2 2 0 1 2 8 2 1 0 2 1 8 2 2 0 2 1 9 2 1 1 2 0 9 2 2 1 2 0 10 1 1 1 0 2 10 1 2 1 0 2 11 2 1 2 0 1 11 2 2 2 0 1 12 1 1 2 1 0 12 1 2 2 1 0 13 1 1 0 1 2
Baseline=0 (20 minutes)
Real rumble strips =1 (20 minutes) Virtual rumble strips=2 (20 minutes) subject Gender 1=male 2=female Condition 1=Night sleep 2=No sleep 1st 2nd 3rd 13 1 2 0 1 2 14 2 1 0 2 1 14 2 2 0 2 1 15 1 1 1 2 0 15 1 2 1 2 0 16 2 1 1 0 2 16 2 2 1 0 2 17 1 1 2 0 1 17 1 2 2 0 1 18 2 1 2 1 0 18 2 2 2 1 0 19 2 1 0 1 2 19 2 2 0 1 2 20 1 1 0 2 1 20 1 2 0 2 1
3.3 Experimental setting – moving base driving simulator
The experiment was carried out using VTI’s third generation moving base driving simulator (VTI driving Simulator III), which consists of:
• Cut-off passenger car cab
• Computerised vehicle model
• Large moving base system
• Vibration table
• PC-based visual system
• PC-based audio system.
The driving simulator is shown in Figure 1 the driving simulator provides a realistic experimental driving condition which is fully controllable and with a high internal validity (same conditions for all subjects). Furthermore, the simulator makes it possible to carry out safety critical experiment which might very difficult to do as field studies. The external validity has been found to be very good in previous experiments carried out at VTI (Törnros, 1998).
Figure 1 Moving base driving simulator at VTI.
The simulated passenger car had a manual gearbox with 5 gears. The time delay introduced in the simulator is very short (40 ms), which is important when focusing on the control and manoeuvring aspects of driving. The noise, infra-sound and vibration levels inside the cabin corresponded to those of a modern vehicle. The car body used in this experiment was a Volvo 850. For technical specifications see Table 2.
Table 2 Technical data about the VTI Driving simulator III.
Technical data Specification Vibration table vertical motion ±6 cm longitudinal motion ±6 cm roll ±6° pitch ±3° Motion system pitch -9° to +14° roll ±24° lateral motion ±3.75 m
max. lateral acceleration 0.8 g
max. lateral speed 4 m/s
Visual system Real time PC-based graphic projection system
field of view 3 channels forward view 120° x 30°
resolution 1 280 x 1 024 pixels per channel at 60 Hz
Computer system PC
program language Fortran, C and C++
3.4
Scenario, driving task
Driving scenarioThe road was a two-lane rural road (9 m wide), each lane was 3.75 m wide, the rumble strips were 0.35 m wide and located 0.175 m outside the lane marking, and between the two lanes. Guard rails alternatively poles were present on the road. Before the start of the experiment all subject had to drive 10 minutes as training. During the drive overtaking was allowed and there was oncoming traffic. Theoretical three different scenarios were designed;
• Free driving: no slower vehicle on the road ahead
• Catching up a slower vehicle with and without visible oncoming vehicles
• Car following: following a slower vehicle.
Each group of 3 laps (~ 9.4 km each) consisted of approximately 20 minutes driving. As mentioned the drivers came once after a night awake (no sleep) and once after a night with sleep (night sleep). During one drive, which took approximately one hour, around 90 km were driven. A scene with free driving is shown in Figure 2.
Figure 2 Base line and scenario without rumble strips.
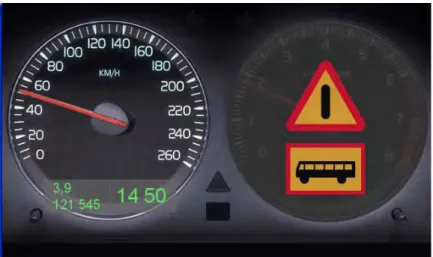
Furthermore a bus parked on the right hand side was passed twice. The first time with no information at all and the second time with an in-vehicle information beforehand. The in-vehicle information was received in the end of the first hour driven both after a night sleep and after no sleep. The information was presented in the dashboard, as shown in Figure 3. The subject did not receive information about this before the experiment started. The warning was presented before the driver could see the bus (570 meters before the bus was passed), seeing the bus was possible 447 meters before passing it. The warning was visible until overtaking the bus. As control condition a bus without driver information (warning) was at the road side earlier, and in a different rumble strip condition.
Figure 3 Information on LCD display about school bus ahead.
3.5 Measures
This chapter describes the data collected. Following data were recorded.
• Driving behaviour (see Chapter 3.5.1)
• Karolinska Sleepiness Scale (KSS) (see Chapter 3.5.2)
• General questionnaire as background, sleep and wake diaries
• Electrophysiological measures: EOG (see Chapter 3.5.3)
• Epworth Sleepiness Scale (see Chapter 3.5.4)
3.5.1 Driving behaviour data
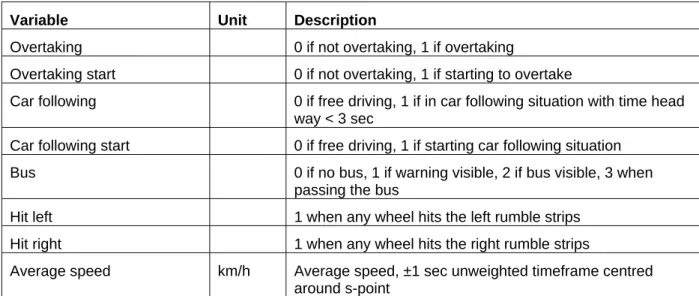
During the test the following variables were recorded with 10 Hz sampling frequency:
Table 3 Recorded basic measurements.
Variable Unit Description
Time msec Time on route
Lap Lap driven (9+2 training laps)
Distance Distance driven
Speed km/h Speed of car
Lateral position m Lateral position of car relative to road middle – negative
values to the left of centre line.
On rib Indicates if any wheel of the car is on the rumble strips
Rib Rumble strip mode (visible, not visible, not present)
Steering wheel angle deg Steering wheel angle
Longitudinal acceleration m/s^2 Longitudinal acceleration, forward positive
Lateral acceleration m/s^2 Lateral acceleration, left positive
Yaw deg Yaw (angle) related to road tangent
Yaw velocity deg/s Yaw velocity related to road tangent
Brake n Brake force
Acceleration pedal Acceleration pedal position (0 to1)
Curve m Road curve radius. Negative number indicates right turn
Slope deg Road slope
Dy m/s Speed in road radial direction
Ddy m/s^2 Acceleration in road radial direction
Rpm 2pi/min Engine revolution
Event Event identifier
Mode Mode within the event (ex: car following situation)
Distance car ahead m Distance to car ahead
Speed car ahead km/h Speed of car ahead
Side position car ahead m Side position of car ahead
Distance oncoming car m Distance to oncoming car
Left grip V Left grip sensor, rising voltage with pressure
Based on these measured data additional variables were calculated, see Table 4
Table 4 Calculated measures.
Variable Unit Description
Overtaking 0 if not overtaking, 1 if overtaking
Overtaking start 0 if not overtaking, 1 if starting to overtake
Car following 0 if free driving, 1 if in car following situation with time head
way < 3 sec
Car following start 0 if free driving, 1 if starting car following situation
Bus 0 if no bus, 1 if warning visible, 2 if bus visible, 3 when
passing the bus
Hit left 1 when any wheel hits the left rumble strips
Hit right 1 when any wheel hits the right rumble strips
Average speed km/h Average speed, ±1 sec unweighted timeframe centred
around s-point
A detailed description of the algorithms used to calculate the variables can be found in Annex 2. For details about lateral position see
Annex 3.
All measures in Table 4 were aggregated, in addition data calculated from the EOG was added as well (all with 10 HZ sampling frequency and synchronized). Calculated measures analyzed were:
• Number of overtakings
• Mean time for overtakings
• Max speed during free driving (no overtaking or car following)
• Mean speed during free driving (no overtaking or car following)
• Max speed only during overtaking (for each overtaking separately)
• Max speed only during car following situation(for each overtaking separately)
• Mean speed only during overtaking
• Mean speed only during car following situation
• Speed variance in car following situation
• Speed variance without overtaking or car following situation
• Mean lateral position without overtaking or car following situation
• Lateral position variance without overtaking or car following situation
• Min lateral position own car (to the right side of the lane)
• Min distance to car ahead
• Min distance to oncoming car while overtaking
• Distance to oncoming car when entering own lane after overtaking
• Number of times with wheel on left rumble strips (middle line) without overtaking.
Event data for bus passing were:
• Speed (control bus without warning) at different distances from bus
• Mean speed (control bus without warning) when passing bus
• Max speed (control bus without warning) when passing bus
• Speed (warning visible) at different distances from bus
• Mean speed (warning visible) when passing bus
• Max speed (warning visible) when passing bus
• Min lateral position when passing bus (control bus without warning)
• Average lateral position when passing bus (control bus without warning)
• Min lateral position when passing bus (warning visible)
• Average lateral position when passing bus (warning visible). 3.5.2 Karolinska sleepiness scale
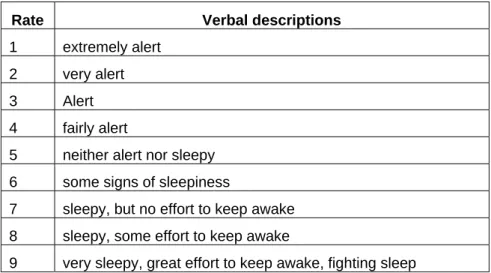
Subjective rating of sleepiness was obtained using the Karolinska Sleepiness Scale (KSS) (Åkerstedt & Gillberg, 1990). The scale consists of a 9-point scale with verbal anchors for every second step. However, the version used in this pilot was a modified version with verbal anchors for each step, see Table 5.
Table 5 Karolinska sleepiness scale (KSS).
Rate Verbal descriptions
1 extremely alert
2 very alert
3 Alert
4 fairly alert
5 neither alert nor sleepy
6 some signs of sleepiness
7 sleepy, but no effort to keep awake
8 sleepy, some effort to keep awake
The participants rated their sleepiness before and after the drive and each 5th minute during the drive. They were instructed to select a score that corresponds to how they have been feeling in average during the last 5 minutes.
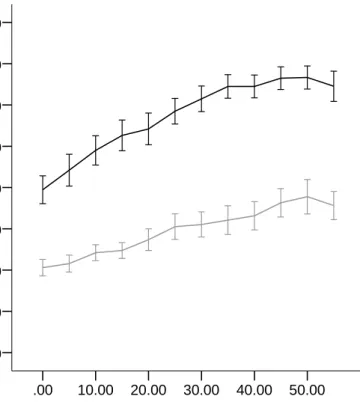
The self reported sleepiness differed between night sleep and no sleep condition (F(1,18)= 114.8 ; p<0.01) see Figure 4. Minute 50.00 40.00 30.00 20.00 10.00 .00 KS S 9,00 8,00 7,00 6,00 5,00 4,00 3,00 2,00 1,00 2.00 1.00 Condition
Figure 4 Mean scored KSS for each 5 minutes during drive (bars represent SE of mean). The first score represents the KSS-value when starting to drive.
No sleep
3.5.3 EOG data and blink behaviour
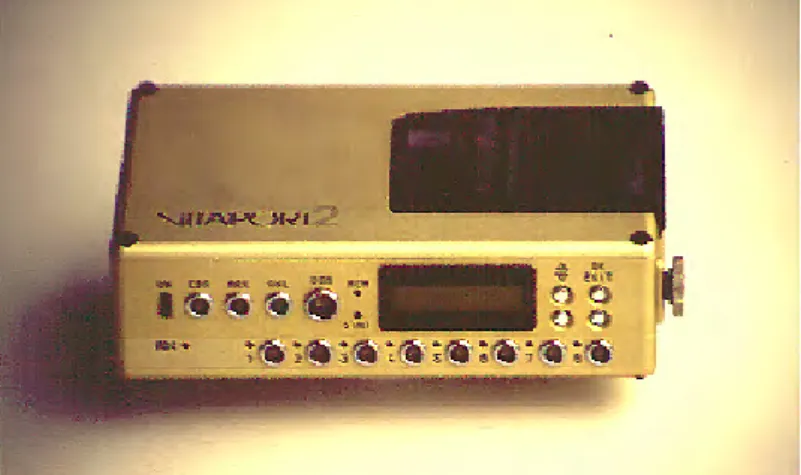
EOG was measured by a portable recoding system called Vitaport 2 from Temec Instruments BV (see www.temec.com). Vitaport 2 is digital recorder with a software-configurable number of channels for physiological measurements. The VTI Vitaport 2 has 17 individually configurable (software) channels for physiological measurements including a marker channel for data synchronisation. To the Vitaport the electrodes were connected (see Figure 5) as well as a marker signal used for synchronisation of data.
Figure 5 The Vitaport 2 digital recorder.
The analysis of EOG data was done with a Matlab script developed by CNRS/LAAS in SENSATION WP4.4. This analysis provides several blink parameters per each
identified blink (see Sensation Deliverable 4.4.2).
Horizontal and vertical electrooculogram (EOG) were measured through three channels. see Figure 6. The sampling frequency was 512 Hz, DC recording mode.
3.5.4 Epworth sleepiness scale (ESS)
The ESS consists of 8 statements regarding different situations in daily life (Johns, 1991). Subjects were asked to rate on a scale from 0-3 how likely they would be to doze off or fall asleep in those eight situations, based on their usual way of life recently. The situations they were asked to rate were the following;
• Sitting and reading
• Watching television
• Sitting inactive in public place (e.g. theatre, meeting)
• As passenger in a car (more than one hour driving without pause)
• Lying down to rest in the afternoon when circumstances permit
• Sitting and talking to someone
• Sitting quietly after lunch (no alcohol)
• In a car, while stopped for a few minutes in the traffic.
This was used in order to describe if the subjects sleep pattern was normal or not.
3.5.5 DVD recordings
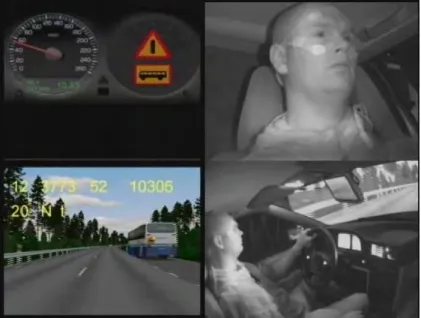
To make it possible to recall what happened during the drive e.g. looking for signs of fatigue, or to determine if a rumble strip hit was due to fatigue or something else, all driving sessions were recorded onto a DVD (one for each subject). The DVD recorder used was a Philips DVD-R 70 recorder. The screen was split into four windows showing the road, the driver’s face, a lateral view of the driver, and the LCD display (see Figure 7).
The subjects were asked to sign an agreement about being recorded on DVD while driving and that the recording could be used in the research.
3.6 Procedure
This chapter describes the procedure that the drivers went through, this includes both before arriving, at the laboratory before and after driving and of course the procedure during the drive.
3.6.1 Preparation before arriving at the laboratory
About one week before arriving at the laboratory the subject received documents describing how the experiment will be done and how they should prepare before arriving. The drivers were asked not to:
• drink alcohol 72 hours before the experimental days
• eat, drink coffee or tee 3 hours before arriving at the laboratory
• use make-up.
This was done in order to minimize individual differences caused by external
confounding factors. The drivers also received a sleep diary that they were asked to fill out the three days before the experiment day. Furthermore participants were asked to fill out the Epworth sleepiness scale (ESS) (see Annex 4) and Restless legs syndrome (RLS) questionnaire (see Annex 5). This is used in order to have knowledge of the drivers sleep habits and sleep behaviour, but mostly to control that the drivers did follow the instructions above.
3.6.2 Before driving
At arrival the drivers were taken to the laboratory in order to fill out pre-questionnaires and to put on electrodes for measuring EOG (see Figure 8).
Figure 8 At the laboratory putting on electrodes for the EOG before driving.
The background questionnaires (see
Annex 6) and informed consent (see Annex 7) were filled out at the laboratory before driving
3.6.3 Driving
The drivers were taken to the simulator, physiological measurement equipment was connected and instructions read to the driver. The driver was informed to:
• Adjust the seat
• Put on safety belt
• The vehicle is a Volvo 850 with manual gear box and front wheel drive
• Before the experiment starts there will be 10 minutes training
• Each 5 minutes they will receive a written question displayed at the screen asking “sleepy”. They should rate their sleepiness with help of the KSS. A reminder was visible in the centre of the steering wheel
• They are going to drive from Västervik to Linköping – in total 90 kilometres
• They should drive in correspondence to the law
• The test leader will observe the driver but not speaking to the driver during the experiment
• Finally that the driver has the right to stop the experiment when ever he/she wants to.
Figure 9 Driver seated and ready to drive the 90 km.
3.6.4 After driving
When 90 kilometres were driven the test ended. The subject went to the laboratory, electrodes where taken off and post-drive questionnaires filled out (see Annex 8). The aim with the questionnaires was to capture the drivers’ experience of the drive and especially overtakings and rumble strips. They also filled out the forms necessary for the reimbursement. During the no sleep condition the subjects were, for safety reasons, driven home by taxi after finishing.
3.7 Statistical
analysis
The design was a within subject design. For the analysis related to sections with no rumble strips, milled real rumble strips and virtual rumble strips Anova – repeated
measure design have been used. Huynh-Feldt correction for sphericity was used. This was also true for between effects test amid night sleep and no sleep conditions.
For the bus situation the speed for each driver was analyzed using the factor warning or no warning, and no sleep or night’s sleep in the distance 9 800, 10 000 and 10 321 meters. 9 800 meters is after receiving the warning but before seeing the bus, 10 000 m is after seeing the bus, but before passing it, and 10 321 m is just when starting to pass the bus. Since the data distribution was approximately normal parametric tests were used. First paired samples t-test was used to get a general overview. The lateral position when passing the bus was also analyzed. Here absences/presence of rumble strips (RRS/VRS) was used as between factor, and normal sleep vs. no sleep and warning as within factor. A repeated measure analysis for the minimal lateral position when passing the bus with the factors warning and normal sleep vs. no sleep was performed.
For test related to the questionnaires Friedmans’ non parametric test was used. All analysis have been done at a significant level of 5% (α=0.05).
4 Results
4.1 Rumble
strips
One main factor in the study design was the presence or absence of rumble strips on the road in order to make the driver aware of a lane departure. The rumble strips could have the form of a real milled rumble strips (RRS), which as well produced vibration and sound when hitting them, or of invisible (virtual) rumble strips (VRS), which only produced vibration and sound, and finally road stretches without rumble strips were present. The design was full factorial and balanced. The results are divided into section corresponding to the hypothesis about overtaking, speed and vehicle position.
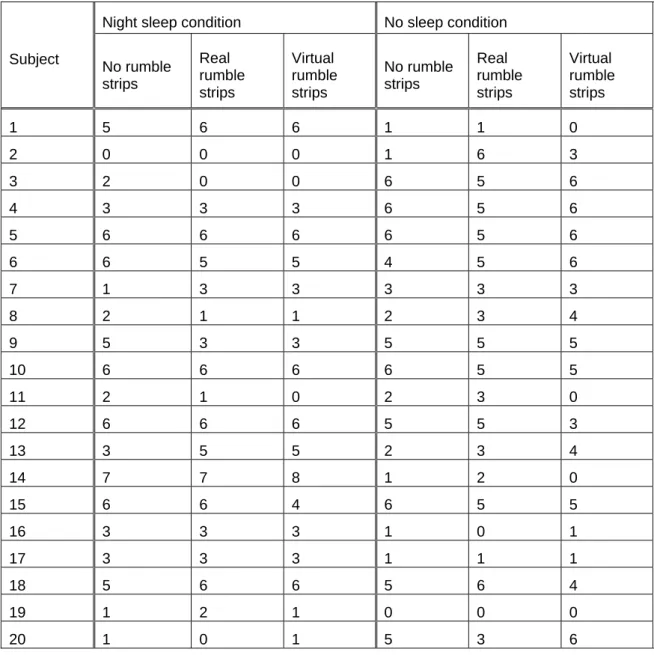
4.1.1 Overtaking
In total 12 out of 20 subjects did overtake in both conditions (night sleep/no sleep) and on all three designs, see Table 6. Out of 20 subjects, 18 did overtake both after a night’s sleep and after no sleep condition and 19 subjects did overtake in each design level.
Table 6 Number of overtaking separated for subject, condition and design.
Night sleep condition No sleep condition
Subject No rumble strips Real rumble strips Virtual rumble strips No rumble strips Real rumble strips Virtual rumble strips 1 5 6 6 1 1 0 2 0 0 0 1 6 3 3 2 0 0 6 5 6 4 3 3 3 6 5 6 5 6 6 6 6 5 6 6 6 5 5 4 5 6 7 1 3 3 3 3 3 8 2 1 1 2 3 4 9 5 3 3 5 5 5 10 6 6 6 6 5 5 11 2 1 0 2 3 0 12 6 6 6 5 5 3 13 3 5 5 2 3 4 14 7 7 8 1 2 0 15 6 6 4 6 5 5 16 3 3 3 1 0 1 17 3 3 3 1 1 1 18 5 6 6 5 6 4 19 1 2 1 0 0 0 20 1 0 1 5 3 6
The driver performed approximately seven overtakings for each rumble strip condition and approximately 20 overtakings for the complete driving session (and the same amount in the second driving session where the sleep deprivation factor was different). The range for the number of overtakings ranged from a minimum of zero overtakings to a maximum of 22 overtakings for a drive. Table 7 shows the number of overtaking for the rumble strip factor (without accounting for sleep deprivation). Note that each rumble strip condition was on 1/3 of the route distance.
Table 7 Number of overtakings.
Rumble strips Mean Std. Deviation N
NRS – Number of overtakings without rumble strips 7.05 3.605 20 RRS – Number of overtakings with real rumble strips
7.15 3.200 20 VRS – Number of overtakings with virtual rumble strips 6.90 3.323 20
The analysis showed no significant differences in the number of overtakings when driving without rumble strips, with milled real rumble strips or with virtual rumble strips (F(2,19) =.182, p>.05). The average time needed for the overtakings was analyzed
as well. No significant differences in the time needed for overtakings, which could be attributed to the presence or absence of rumble strips, were found (F(2,19) =1.003, p>.05).
In general, the time for an overtaking manoeuvre (as defined in the mentioned
algorithm) was approximately 17 seconds (see Table 8). There was a weak trend that the visible rumble strips led to a shorter overtaking time compared to the virtual rumble strips or no rumble strips.
Table 8 Average time for overtaking manoeuvre in the three rumble strip modes.
Rumble strips Mean Std. Deviation
Average overtaking time no rumble strips
17.8758 3.45341 Average overtaking time real rumble strips
16.6100 2.61977 Average overtaking time virtual rumble strips
18.2092 3.18192
Lateral space to car ahead during overtaking
In order to find safety critical behaviour the lateral space between own car and car being overtaken was calculated for each overtaking manoeuvre. This space is calculated from the outer margin of the own car to outer margin of the car overtaken, and represent the space between the cars; if this space is zero the cars would touch each other. For all overtakings the one with minimum value was extracted for each driver and each condition (night sleep and no night’s sleep, and for groups NRS, RRS and VRS). The analysis revealed that rumble strips did not have effect on the space between the two cars while overtaking. In average the drivers left about 1.5 meter between their car and
the car they overtook (lateral space between the cars). Minimal values of 0.77 meters were found, which is not considered safety critical.
Distance to car ahead while not overtaking
The distance to the car ahead during the drive was studied. Here only the driving when not in overtaking procedure was analyzed, thus situations where the drivers “prepared to overtake” were included. It has to be noted that estimating distances is difficult for a driver in a driving simulator. There was no significant effect on the minimum distance to car ahead during free driving when driving without rumble strips (NRS), with real rumble strips (RRS) or with virtual rumble strips (VRS). Minimal values of 4.8 to 1.6 meters were observed for various cases. A video analysis of the situations showed that indeed the drivers came very close to the vehicle ahead, trying to overtake it. In Figure 10 one of these situations, which can be considered safety critical is shown as example.
Figure 10 Very low distance to car ahead before overtaking.
Distance to oncoming car while overtaking
The distance to oncoming cars while overtaking is considered safety critical, as the extreme case of distance zero is equal to a collision with the oncoming car. All
overtaking situations in which an oncoming car was present while the subject’s car was still as much in the opposite lane to lead to a collision with an oncoming car were analyzed. The analysis showed no effect on the distance to oncoming car while
overtaking when comparing driving in the three different rumble strips situation. While the mean values ranged about 190 meters, some minimal values of distance to oncoming car of 50 meters were found. In a similar manner the distance to oncoming car when finishing to overtake (re-entering the own lane, but still with left side of the car in the opposite lane) could be analyzed, however, the low number of valid cases here disallow proper statistical analysis. Qualitative investigation led to a single value of distance to oncoming car being 12.8 meters while re-entering the own lane.
Centre line crossing being in a car following situation
This variable counts each occurrence of crossing the middle line of the road with at least the left car wheel before overtaking, but without concluding the overtaking manoeuvre.
It is explained as attempts to overtake which were not concluded for some reason (for example there was an oncoming car which was judged as being to close to allow safe overtaking). Repeated measures analysis showed no effect of NRS, RRS and VRS in the number of centre line crossings before overtaking. A trend towards less centre line crossing with visible rumble strips (VRS) was observed. The mean number of centre line crossing before overtaking was approximately four, with maximum count for the whole drive ranging up to 10.
4.1.2 Speed
Speed while not in overtaking chance or not during overtaking
First the maximal speed on route during free driving (not in car following condition with possibility to overtake or during overtaking) was examined: Maximal speed in free driving was approximately 120 km/h. The presence or absence of rumble strips did not have any significant effect on maximal speed, but there was an interaction between no sleep/night sleep and NRS, RRS and VRS ((F(2,19) =4.197, p<.05). A similar analysis for
average speed in free driving condition led to comparable results: no effect on
presence/absence of rumble strips on average speed; here no interaction between rumble strips and sleep deprivation was found. The average speed was approximately 96 km/h in free driving. Speed variation on route was thought to be affected by presence or absence of rumble strips. The analysis did not support this. Standard deviation of speed during not overtaking chance or during not overtaking was unaffected by rumble strip design.
Speed while overtaking
In this chapter speed while overtaking is analyzed. Since the participants performed a different number of overtakings in the experiment (some had over 18 overtakings per drive, others no overtakings at all), the analysis was somehow less straightforward than for the free driving condition. Here the maximum speed for all overtakings for a single participant was analyzed for sections with NRS, RRS and VRS. For all overtakings the one with highest speed were used. The analysis showed that presence or absence of either real or virtual rumble strips did not have an effect on the maximum speed while overtaking. It has to be noted that a high variance in maximum speed, together with the relatively low number of observations is a challenge in the statistical analysis. A trend towards higher maximum speed with virtual rumble strips, and lowest with no rumble strips was observable. The speed variation in car following situations was analyzed as well, but no effect of the rumble strip factor on speed variance was found.
4.1.3 Lateral position
Lateral position while not in overtaking chance or not during overtaking
The lateral position of the vehicles was recorded and analyzed in situations where the driver was in situations other than preparing to overtake and actually overtaking. First the free driving is looked at, i.e. when not overtaking and when not in car following situation with chance to overtake. There was no significant effect of the presence or absence of either real or virtual rumble strips on average lateral position of the car. Average lateral position was approximately -1.8 meters during free driving. The minimal lateral position to the right (closer to the outside lane of the road) was not
significantly affected by the rumble strip factor, although a trend towards keeping the vehicle further away from the right lane margin for the visible rumble strip road stretches could be seen. Minimal lateral position values ranged around -2.5 meters. Variation in lateral position in free driving was not affected by presence/absence of either real or virtual rumble strips.
Cases were observed where drivers had lateral position values well outside the road margins during free driving. A subsequent analysis of the video recordings showed that the drivers had fallen asleep several times during the drive. Two of the cases were for the same person, which was driving after a not having slept during the night, and showed clear signs of sleepiness. For this driver two road departures were while driving on visible rumble strips, and three departures while driving without rumble strips (note: the sequence here was first virtual rumble strips, then visible rumble strips, and finally no rumble strips). The driver was about -3.9 meters to the right, which means well outside the road with the right wheel, but not with the whole car. In two cases the driver had hit the guard rail. The driver departed as well to the opposite lane several times because of falling asleep. There was no collision with other vehicles, but in real traffic this drive could have been fatal.
4.1.4 Questionnaire
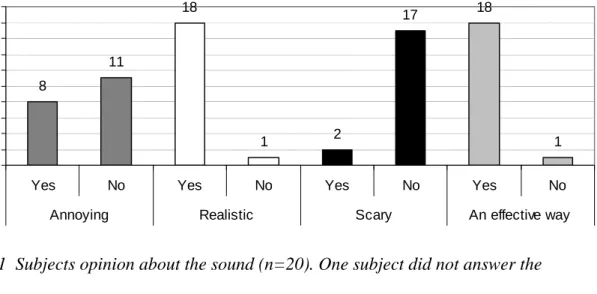
After the driving session all subjects were asked to fill in a questionnaire related to acceptance and usefulness of milled real rumble strip and virtual rumble strips. This was done both after driving after a night sleep and after a no sleep. There were no significant differences between these two conditions. The results are consequently based on the answers given after the drive when the drivers had slept normally during the night. Among the 20 subjects driving in a night sleep condition 19 were sure they had experienced rumble strips, one driver was unsure. In total 9 subjects (45%) found that the sound had been the main factor for the impression of driving on real rumble strips, 6 subjects (30%) found that it was a combination between sound and vibration and 2 subjects (10%) found the vibrations as the main source. One subject did not answer the question. The vibrations were sent to the drivers through the simulator vibration table and therefore they should be experienced in the entire vehicle. The majority (80%) of the drivers experienced the vibrations in the entire car.
The sound was heard by the driver from the left side if the lane departure was on the left and from the right if the lane departure was on the right side. This was noticed by 13 (65%) of the subjects. The subjects were asked about their “general opinion about the sound and the vibrations?” (See Figure 11 and Figure 12.) More than half of the drivers found the sound annoying, the majority found it realistic but not scary. Almost all drivers thought the sound will be an effective way of warning a sleepy driver.
Opinion about sound 8 11 18 1 2 17 18 1 0 2 4 6 8 10 12 14 16 18 20
Yes No Yes No Yes No Yes No
Annoying Realistic Scary An effective way
Fr e q ue nc y
Figure 11 Subjects opinion about the sound (n=20). One subject did not answer the question.
About 50% of the drivers did not found the vibrations annoying, the majority found them realistic but not scary. Almost all drivers thought the vibration will be an effective way of warning a sleep driver.
Opinion about vibrations
9 10 18 1 2 17 18 1 0 2 4 6 8 10 12 14 16 18 20
Yes No Yes No Yes No Yes No
Annoying Realistic Scary An effectiv way
Fr
e
qun
c
y
Figure 12 Subjects opinion about the vibrations. There was one subject that did not answer the question.
There is an interest to find out if there is a difference in opinion about the usefulness and acceptance between milled real rumble strips and virtual rumble strips. There is a special interest to analyse the differences regarding the potential of rumble strips in order to “...call for attention”, “…to motivate the driver to do something about the situation” but also the driver thoughts related to “…if thedrivers will accept rumble strips”, “...if there is a risk that the rumble strips will scare the driver”, “…cause risky situations”, “….if it they will make the drivers drive longer” or “…if the drivers will do less overtakings or more carefully choose situation for overtaking”.
The results are presented separately for milled rumble strips (Figure 13) and virtual rumble strips (Figure 14).
Usefulness and acceptance of milled rumble strips
0 2 4 6 8 10 12 14 16 ye s ma y b e do ubt ful ly no ye s ma y b e do ubt ful ly no ye s ma y b e do ubt ful ly no ye s ma y b e do ubt ful ly no ye s ma y b e do ubt ful ly no ye s ma y b e do ubt ful ly no ye s ma y b e do ubt ful ly no ye s ma y b e do ubt ful ly no ye s ma y b e do ubt ful ly no Usable to call attention Meningful in order to motivate Will rumble strips be accepted Risk of scaring drivers Create other risky situations Reduce accidents Drivers drive longer Less over takings Overtaking more carfully Fr e que nc y
Figure 13 Usefulness and acceptance of milled rumble strips.
There was a high acceptance for real milled rumble strips. All subjects found it more or less useful to call attention; almost all found it meaningful in order to motivate the driver. There were drivers that thought the rumble strip could be scaring and also some that thought it could create other risky situations. However, all drivers believed real milled rumble strips will reduce the number of accidents. There were no consensuses if the real milled rumble strips will lead to less overtakings and more carefully
overtakings.
Usefulness and acceptance of virtual rumble strip
0 2 4 6 8 10 12 14 16 ye s ma y b e doubt ful ly no ye s ma y b e doubt ful ly no ye s ma y b e doubt ful ly no ye s ma y b e doubt ful ly no ye s ma y b e doubt ful ly no ye s ma y b e doubt ful ly no ye s ma y b e doubt ful ly no ye s ma y b e doubt ful ly no ye s ma y b e doubt ful ly no ye s ma y b e doubt ful ly no Usable to call attention Meningful in order to motivate Will virtual RS be accepted Risk of scaring drivers Create other risky situations Accepted as support system Reduce accidents Drivers drive longer Less over takings Overtaking more carfully Fr e que nc y
Figure 14 Usefulness and acceptance of virtual rumble strips.
The acceptance for virtual rumble strips was high as well. All subjects found it more or less useful to call attention; almost all found it meaningful in order to motivate the
driver, there were drivers that thought the rumble strip could be scaring. The difference was not significant. However, all drivers except one believed virtual rumble strips will reduce the number of accidents. Also for virtual rumble strips there was no consensus if the virtual rumble strips will lead to less overtakings and more careful overtakings.
Overtaking
The subjects were asked about their willingness to overtake in relation to milled or virtual rumbles strips, see Figure 15. The question was divided for situations being alert/sleepy and rumble strips being milled or virtual.
Willingness to overtake 8 5 9 3 3 8 5 6 0 2 4 6 8 10
Yes No Yes No Yes No Yes No
Alert Sleepy Alert Sleepy
Milled rumble strips Milled rumble strips Virtual rumble strips Virtual rumble strips
F
requnc
y
Figure 15 Results of question: “Do you think that your willingness to overtake will be influenced during the described conditions (alert/sleepy-milled rumble strips/virtual rumble strips)?”
The reason for the high missing values could be explained by practical problems with the questionnaires (wrong version of the questionnaire was used).
Usefulness of different warning signals
The subjects were asked to “…rate on a five graded scale (1=not useful at all to 5=very useful) their opinion regarding the usefulness of…” vibrations in seat, sound of rumble strips and the visual impression of rumble strips, see Figure 16.
Usefulness of different warning signals 3.75 4.75 3.05 1 2 3 4 5 Vibrations in seat (SE 0.26) Sound of rumble strips
(SE 0.12) Vision of rumble strips
(SE 0.33)
Average rate (1=not useful - 5=very useful)
Figure 16 The subjects’ average rate of usefulness for different warning signals related to real rumble strips or virtual rumble strips. SE=standard error of mean.
The sound and vibrations in the seat were rated as useful. The difference in usefulness between seeing the rumble strips, hear the sound from them or feel vibrations in the seat was significant (Friedmans Χ2(2) = 18.698; p<0.001). The most useful signal was seen
to be the sound.
4.2
Normal night with sleep vs. not having slept during the night
One main factor in the study design was the driver’s condition: no sleep (sleepy) and night sleep (alert). The design was full factorial and balanced.
The results are divided into section corresponding to the hypothesis about overtaking, speed, vehicle position.
4.2.1 Overtakings
This chapter deals with the overtakings. The hypothesis was that the overtaking behaviour was different between the condition alert and sleepy.
The different indicators that are looked at are:
• Number of overtakings
• Average time used for overtakings
• Number of centre line crossings before overtaking
• Safety distance to car ahead when overtake
• Safety distance to oncoming car when overtake. In total there were 422 overtakings, see Figure 17.
Number of overtakings 73 68 72 71 70 68 65 66 67 68 69 70 71 72 73 74
Night sleep No sleep
F
re
que
nc
y No rumble strips
Real rumble strips Virtual rumble strips
Figure 17 Number of overtakings distributed over sections with no rumble strips, real rumble strips and virtual rumble strips (All overtakings included – n=20).
There were 12 out of 20 subjects that did overtake both after night sleep and after no sleep condition. The average number of overtakings (with standard deviation - sd) is presented in Table 9.
Table 9 Average number of overtakings and sd (n=12).
NRS RRS VRS
Night sleep 4.33 (sd 1.83) 4.42 (sd 1.73) 4.25 (sd 1.66)
No sleep 4.25 (sd 1.82) 4.25 (sd 1.42) 4.33 (sd 1.50)
There was no significant difference in number of overtakings after night sleep condition compared to no sleep condition (F(1,19)=0.05; p>0.05), neither on different types of
rumble strips ((F(2,38)=0.18; p>0.05). There was no interaction between condition and
presence/absence of real/virtual rumble strips. In Figure 18 the average time used for overtakings is presented.
Average time used for overtaking 16.64 18.06 16.13 17.09 17.35 18.03 15 15.5 16 16.5 17 17.5 18 18.5
Night sleep No sleep
S eco n d s NRS RRS VRS
Figure 18 Time used for overtaking. Design: 1= no rumble strips (NRS); 2=real rumble strips (RRS) and 3= virtual rumble strips (VRS); condition: 1= Night sleep; 2=no sleep (n=20).
In total there were 12 subjects that performed overtakings in each condition. The average time and sd is presented in
Table 10 Average time for overtaking (n=12).
NRS RRS VRS
Night sleep 18.27 (sd 4.34) 16.89 (sd 3.79) 18.59 (sd 3.62)
No sleep 18.57 (sd 2.66) 17.73 ( sd 1.83) 18.03 ( sd 2.60)
There was no significant difference in time used for overtakings after night sleep
compared to after the no sleep condition (F(1,11)=0.09; p>0.05). There was no significant
interaction between condition and design.
Distance to car ahead when not being in an overtaking situation
The distance to car ahead is a safety critical measure, as low distances leave less time to react for critical situations.
Minimum distance to car ahead - not overtaking 11.685 10.515 11.36 9.96 11.89 10.585 8 9 10 11 12 13 14 15 Alert SDP me te rs NRS RRS VRS
Figure 19 Minimum distance to car ahead – while not overtaking.
In Figure 19 it can be seen that there is a trend that after a no sleep (being sleepy) the driver have shorter distance to car ahead compared to driving after a night sleep. However, the difference was not significant (F(1,19)=2.766; p=0.113).There was no
interaction between condition and design.
Minimum distance to oncoming when starting to overtake
In the analysis only the first overtaking on each design for each driver are included. Overtakings without visible oncoming vehicles are not included. There were no critical interactions between the drivers and oncoming vehicles during overtaking. In average the minimum distance to oncoming vehicles when starting to overtake was 638 meter (sd 70.0) in no sleep condition; and 626 meter (sd 71.5) in night sleep condition. The difference was not significant (F(1,7)=2.16; p>0.05). An oncoming vehicle was possible
to recognize at a distance of about 600 meter.
Distance to oncoming car when entering the own lane again
In the analysis only the first overtaking on each design and for each driver are included. Overtakings without visible oncoming vehicles are not included. Distance to oncoming vehicle when entering the own lane could be a more sensitive event than average of minimum distance. Driving after night sleep condition the distance was 470 meter (sd 196 m); and after no sleep condition it was 418 meters (sd 206 m). The difference between the conditions was not significant (F(1,3)=4.88; p>0.05).
Minimum lateral distance to car ahead
The lateral distance to car ahead when passing the car (value when the driver’s car front bumper just passed the rear bumper of the car overtaken) was calculated and analyzed. There was a significant difference in lateral distance to car ahead when overtaking during night sleep and no sleep condition (F(1,11)=7.163; p>0.022). There was also a