NERA Conference Proceedings 2013 Northeastern Educational Research Association (NERA) Annual Conference
10-25-2013
Validation of the Secondary School Admission Test
(SSAT) Using GPA, PSAT, and SAT Scores
Meghan L. Kiley
The Wheeler School, mkiley@hotmail.com
Robert K. Gable
Johnson & Wales University, rgable@jwu.edu
Follow this and additional works at:https://opencommons.uconn.edu/nera_2013
Part of theEducation Commons
Recommended Citation
Kiley, Meghan L. and Gable, Robert K., "Validation of the Secondary School Admission Test (SSAT) Using GPA, PSAT, and SAT Scores" (2013).NERA Conference Proceedings 2013. 16.
Validation of the Secondary School Admission Test (SSAT) Using GPA, PSAT, and SAT Scores1
Meghan L. Kiley Admission Associate
The Wheeler School Providence, RI
Robert K. Gable,
Director, Center for Research and Evaluation College of Arts and Sciences
Johnson & Wales University
¹Research paper presented at the 44th annual meeting of the Northeastern Educational Research Association, October 25, 2013, Rocky Hill, CT.
Table of Contents
I. Introduction ... 1
Statement of the Problem... 2
Significance of the Problem... 4
Background of the Study ... 5
II. Literature Review ... 7
Introduction... 7
Beyond Standardized Test Scores... 7
Cognitive Domain... 16
Affective Domain... 19
Behavioral Domain ... 24
Data-Driven Decision Making... 25
Summary ... 27 III. Methodology ... 29 Introduction... 29 Purpose... 29 Research Questions... 29 Sample/Participants... 30
Student Test Data... 30
Instrumentation ... 32 Quantitative – SSAT ... 32 Content Validity... 32 Reliability... 33 Data Collection ... 33 Data Analysis ... 33 Quantitative... 33 Summary ... 34 IV. Findings ... 35 Introduction... 35 Research Question 1 ... 36 Research Question 2 ... 39 Research Question 3 ... 42 Research Question 4 ... 44 Research Question 5 ... .47 Research Question 6 ... 50 Summary ... 61
V. Summary, Conclusions, and Recommendations... 63
Review of the Methodology... 63
Summary of the Results ... 63
Recommendations for Further Areas of Study ... 65
Summary ... 66
REFERENCES ... 67
APPENDIXES ... 73
List of Tables
Table 1: Student Demographic Data ... 34
Table 2: Intercorrelations of SSAT Scores (N=110) ... 39
Table 3: Correlations of SSAT Scores with End of Grade 9 GPA, Grade 11 PSAT Scores, and Grade 12 SAT Scores ... 40
Table 3a: Effect Sizes for Correlations of SSAT Scores with End of Grade 9 GPA, Grade 11 PSAT Scores, and Grade 12 SAT Scores ... 41
Table 4: Relationship of Demographic Variables to the End of Grade 9 GPA, Grade 11 PSAT Scores, and Grade 12 SAT Scores ... 45
Table 5: Stepwise Multiple Regression of SSAT Scores on Grade 9 GPA ... 47
Table 6: Hierarchical Multiple Regression of SSAT Scores on Grade 9 GPA... 50
Table 7: Stepwise Multiple Regression of SSAT Scores on Grade 11 PSAT Scores ... 52
Table 8: Stepwise Multiple Regression of SSAT Scores on Grade 12 SAT Scores ... 53
Table 9: Hierarchical Multiple Regression of SSAT Scores on PSATR ... 56
Table 10: Hierarchical Multiple Regression of SSAT Scores on PSATQ... 58
Table 11: Hierarchical Multiple Regression of SSAT Scores on PSATW... .59
Table 12: Hierarchical Multiple Regression of SSAT Scores on SATR ... 62
Table 13: Hierarchical Multiple Regression of SSAT Scores on SATQ ... 63
List of Figures
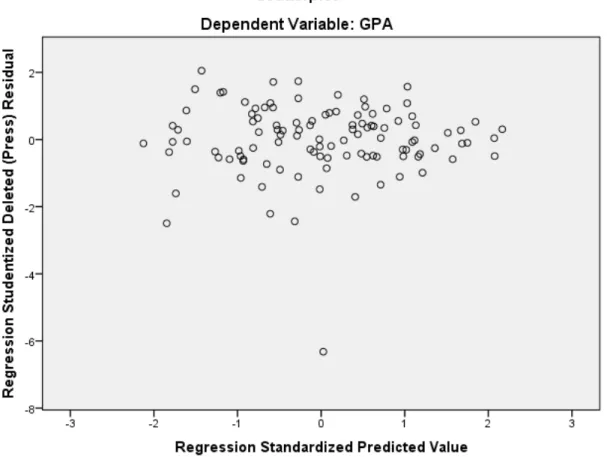
Figure 1: Scatterplot for Predicted GPA Scores and Regression
Residuals ... 79 Figure 2: Scatterplot for Predicted PSATR Scores and Regression
Residuals ... 80 Figure 3: Scatterplot for Predicted SATR Scores and Regression
Abstract Independent schools use Secondary School Admission Test scores in grade 9 admissions decisions. Six validity research questions examined the relationship of SSAT scores to end of grade 9 GPA, grade 11 PSAT scores, and grade 12 SAT scores. Correlations and multiple regression were used. Strong support was found for the validity of SSAT scores (p<.001, medium to large r2 effect sizes) in relation to grade 9 GPA (r range .51 to .54), grade 11 PSAT (r range .41 to .76), and grade 12 SAT (r range .32 to .80) scores before and after controlling for student demographics.
I. INTRODUCTION
The purpose of this report is to examine the validity of the Secondary School Admission Test (SSAT). Since 1957, the Secondary School Admission Test Board (SSATB) has been offering a competitive exam to students interested in attending an independent secondary school. The SSAT is offered in over 1,085 locations and in more than 100 countries around the world. It is administered each year to over 60,000 students applying to independent schools. According to the SSAT Interpretive Guide (2011), the SSAT is “intended to provide a common measure for evaluating the abilities of all students seeking admission to independent schools, from whatever background or
experience base, and to assess the possible success of these students in grades 6 to 11” (p. 3). Many independent schools across New England require that their applicants provide admission test scores, along with family background information, transcripts, teacher recommendation letters, a school visit, and a formal interview with an admission counselor to be considered for admission.
Evidence suggests that standardized tests could be inaccurate predictors of student academic success. Kohn (2000) believes that standardized test results are highly correlated with socioeconomic status, so much so that they tell reviewers less about the child’s potential and more about the size of the house in which the child lives in. Kohn (2000) also suggests that standardized tests measure the skill of test taking, which he believes is not related to the intellectual qualities that most educators care about, including depth of thinking and critical thinking skills. On the other hand, a study by Bridgeman, Pollack, and Burton (2004), based on data from 41 college level institutions, showed that even for students with similar high school grades and course backgrounds,
SAT scores contributed substantially to the prediction of college “success,” defined as the attainment of a college GPA above a particular criterion level. Another reason that admission tests can be valuable at the college level is that high school grades alone, without test scores, tend to produce predictions of freshman grades that are systematically off target for some ethnic groups, a problem that can occur despite the sizable correlation between high school and college grades (Zwick, 2007). Test scores and high school grades used in combination to predict college performance often reduce these systematic distortions.
Sternberg (2009) believes we need to teach toward successful intelligence, which is the use of an integrated set of abilities, including analytical, practical, and creative virtues, to find success in life. If independent schools wish to cultivate students for success in both school and life, it would be advantageous to identify students who possess the all-encompassing virtues for successful intelligence.
The purpose of this research study was to determine if there is a relationship between SSAT scores and student academic success in an independent high school.
Statement of the Problem
The SSAT is one of two tests (the other is the Independent School Entrance Exam) that are commonly required for students applying to independent schools across the country. Although the SSAT has been found to be useful in identifying academically talented elementary school children (Lupkowski-Shoplik & Assoline, 1983; Mills & Barnett, 1992), and when administered in modified form, can be useful with
accommodations provided for students with learning disabilities (Beattie, Grise, & Algozzine, 1983), its ability to predict student success in high school is limited. The
most recent data available is a 1978-79 correlational study of 21 SSATB schools illustrating correlations of Reading scores with English/Literature grades ranging from .14 to .63 and Quantitative scores with Mathematics grades ranging from .07 to .56 (SSAT Interpretive Guide, 1985). Although equally limited, there is more recent evidence demonstrating the impact of modifying existing standardized tests or
eliminating the requirement of test scores all together (Grigorenko et al., 2009; Kohn, 2000; Sternberg, 2006).
Based on a study by Grigorenko et al. (2009), prediction of school success can be enhanced by thinking more broadly about the skills that are measured during the application process. Their study focuses on modern psychological theories such as Wisdom, Intelligence, and Creativity Synthesized (WICS) (Sternberg, 2003), self-regulated learning (Schunk, 2005), and self-efficacy (Bandura, 1993). At the college level, Sternberg and The Rainbow Project Collaborators (2006) discovered that using broader tests for admission, including assessment of analytical, practical, and creative skills, enhances academic excellence.
In a competitive independent school setting, it is common for applicants to display strong tests scores, glowing teacher recommendations, and impressive transcripts, making the decision-making process difficult for Admission Counselors. Additional research is needed to determine the SSAT’s ability to predict success in high school. Data-driven decision making (DDDM) gives us another tool, something a bit more concrete than our gut feelings and anecdotes, to justify our decisions (Chaffer Schroeder, 2011).
Significance of the Problem
“Through the recruitment, selection, and enrollment of students, admission and enrollment management professionals play a critical role in their schools’ vitality and educational culture” (NAIS, 2012, para. 2). According to the Principles of Good
Practice, stated by NAIS (2012), through the admission process schools seek to ensure an appropriate match between prospective students/families and the school. For admission professionals to make the most effective decisions for both the school and applicant, they gather materials to get to know the student on a deeper level. These materials include, but are not limited to, a formal application, transcripts (often from the past 2 ½ years), two or more teacher recommendations from current teachers, a school visit, on-campus interview, and admission test scores.
There is a cost incurred by the applicant family during the application process, which comes from the application fee (this ranges from $50 to $100), and the admission tests. The SSAT currently costs $116, and the Independent School Entrance Exam (ISEE) costs $98. The application provides biographical information about the applicant to the
admission office. The application may also include information about the applicant’s family, applicant interests, and in some cases short-answer questions to be completed by the applicant. This information is typically clear and straightforward. The validity and reliability of the admission tests are less clear. The last validity study for the SSAT was a 1978-79 correlational study to determine the relationship between test scores and student grades in related classes (SSAT Interpretive Guide, 1985).
Background of the Study
While there is limited research to support the relationship between student academic success and standardized test scores in the high school admission process, there is a great deal of literature that supports the importance of data-driven decision making in
education. The importance of strong attributes within the cognitive, behavioral, and affective domains for student academic success in school and life is also prevalent in the literature. Examples of these attributes range from critical thinking and problem solving skills, to self-efficacy, collaborative skills, and even humor. The following is a brief summary of the literature supporting the research for validation of the SSAT and the importance of cognitive, behavioral, and affective student attributes for success in high school, as well as support of data-driven decision making.
The SSAT is an aptitude, or ability test, as opposed to an achievement test. An aptitude test measures the ability to learn or to develop proficiency in an area, if provided with appropriate education or training. An achievement test is a test of knowledge or proficiency based on something already learned or taught. It measures the extent to which a person has achieved something, acquired certain information, or mastered certain skills. The SSAT “acts as a common denominator for schools in measuring a student’s academic capabilities, regardless of school record” (SSAT, 2013, Taking the Test: About the Test section, para 5). The last validity study on record to determine the relationship between SSAT scores and academic grades in both English and Mathematics was obtained from a correlation study conducted in 1978-79 (SSAT Interpretive Guide, 1985). While this study did find a correlation between reading scores with
English/Literature grades and quantitative scores with mathematics grades, it is dated material. Email correspondence between the researcher and individuals at the SSATB
indicated that the SSATB was in the process of conducting a current validity study, but no evidence was available at the conclusion of this research. The SSATB offers a free validity study service to all member schools. The SSAT Interpretive Guide (2011) indicates that because the validity of the SSAT depends on how it is used by the individual school, the user school should conduct its own validity study whenever possible.
Concrete evidence was available to support the importance of attributes to student success within the cognitive, affective, and behavioral domains. One of the primary sources used to support the research across all three domains was Sternberg’s work in areas such as successful intelligence; broadening college admission testing to include analytical, practical, and creative skills; and the Wisdom, Intelligence, and Creativity Synthesized (WICS) model of leadership and assessment (Sternberg, 2006, 2007, 2010).
Sternberg (2006, 2007, 2010) suggests that the assessments used in the admission process (for both secondary and postgraduate schooling) should better reflect the qualities that matter most throughout life and not just during a student’s education. Admission Counselors should identify the competencies that are essential to student success and assess applicants in a way that will portray those competencies.
Ultimately, data-driven decision making is an important tool to help improve the success of students and schools (Marsh, Pane, Hamilton, et al., 2006). It is the schools responsibility to establish a procedure for quantifying even the most qualitative attributes, allowing for the most accurate and effective admission decisions. “We all know that there are some things that cannot ever be measured when evaluating students and their
potential to succeed in school. What we do is part art and part science” (Chaffer Schroeder, 2011).
II. LITERATURE REVIEW Introduction
According to the National Association of Independent Schools (NAIS), testing is used to evaluate a student’s ability to perform both in and out of the classroom and can help a school determine whether its program is appropriate for a particular applicant (NAIS, 2012). It is common practice for independent secondary schools to require test scores from prospective students during the admission process. Some schools assign significant value to test scores, while others regard ability tests as simply one part of the admission process. It is not uncommon for schools to place equal value on the applicant’s campus interview, the student’s record of achievement, teacher recommendations, and
student/parent written statements (NAIS, 2012). The following is a review of the literature describing the significance and validity of admission test scores at the high school, college, graduate, and post-graduate level, as well as literature supporting the importance of accessing students cognitive, affective, and behavioral attributes during the admission process. This review highlights particular competencies that the literature suggests are essential to student success.
Beyond Admission Test Scores
Although standardized achievement tests are relatively easy to understand and interpret, there is much less known about how students' background, motivation, interests, instruction, school climate, and numerous other factors influence academic
achievement (Alexander, 2000). There is also debate over what role admission tests are intended to fill and what they are ultimately measuring.
From the perspective of most testing professionals, achievement tests and aptitude tests can be viewed as end points of a continuum, with exams that focus on specific course material lying closer to the achievement test pole, while those that are less reliant on mastery of particular content falling near the aptitude test end. (Zwick, 2007, p. 11)
“The SSAT is not an achievement test but rather a test in the tradition of aptitude or ability” (SSAT, 2011, p. 3). It is specifically designed to measure basic skills that are important to learning in the academic context, but is not designed to measure the extent of knowledge in a specific curriculum or other characteristics such as motivation and creativity (SSAT, 2011).
Testing at the Collegiate Level
While there are studies to support that admission test scores increase the prediction of final grade point average (FGPA) at the college level (Bridgeman, Pollack, & Burton, 2004; Lohman, 2004), we also know that prior grades alone are more effective in predicting grades than admission tests alone (Zwick, 2007). When we add test scores to prior grades we increase the prediction of FGPA. Crouse and Trusheim (as cited in Zwick, 2007) argue that the typical SAT increment is so small that it makes the SAT useless. They felt as if SAT scores were redundant with high school grades. In contrast, an additional study including 41 institutions demonstrated that for students with similar high school grades and course background, SAT scores contributed substantially to the prediction of college success, which was defined as the attainment of GPA over a certain level (Bridgeman et al., 2004). “From an institutional perspective, even a small
schools that do not have the opportunity to interview candidates or review applications in elaborate detail” (Zwick, 2007, p. 14).
Predictive validity studies undertaken at a broad range of colleges and universities show that high school GPA is consistently the best predictor of freshman grades. Standardized test scores do add a statistically significant increment to the prediction, so that the combination of high school GPA and test scores predicts bette than high school GPA alone. But high school GPA account for the largest share of the predicted variation in freshman grade. (Geiser & Santekices, 2007, p. 4)
Noble and Sawyer (2002) conducted a study to predict different levels of academic success in college using high school GPA and the ACT (a national college admissions examination that consists of subject area tests in: English, math, reading, and science) composite score. Their study showed that high school GPA was slightly more accurate than ACT scores in predicting whether students earn a 2.00 or higher GPA during their first year of college. ACT composite score and GPA had the same accuracy for
predicting whether students earned a 3.00 college GPA or higher. “The typical percentage of accurate predictions was 79% using either predictor, and the typical percentage of correct classifications using a joint ACT composite/high school GPA model was 80%” (Noble & Sawyer, 2002, p. 7).
A meta-analysis of the validity of the Graduate Record Examination (GRE) for master’s and doctoral programs found considerable evidence for the validity of the GRE at both the master’s and doctoral levels (Kuncel, Wee, Serafin, & Hezlett, 2010). This meta-analysis, based on nearly 100 studies and 10,000 students, found that the validity of the GRE varied just .03 between master’s (.30) and doctoral (.27) programs. Both the verbal and quantitative components of the GRE were found to be valid predictors of graduate GPA and first year graduate GPA. Based on this evidence, “the GRE is a useful
decision-making tool for both master’s and doctoral level programs” (Kuncel et al., 2010, p. 350).
Alternative Assessments
Standardized ability, aptitude, and intelligence test scores are often the first indicator of academic success, although Sternberg’s “WICS” model of leadership and assessment, which is an acronym for Wisdom, Intelligence, and Creativity Synthesized (WICS) model of leadership and assessment, indicates that achievement comes from more than test scores and education alone. The advantage of assessing students through the lens of the WICS model is that it goes beyond traditional models, which focus on memory and analytical learning. WICS enables students to capitalize on their strengths and
compensate for their weaknesses (Sternberg, 2010). In a study carried out by Grigorenko, Diffley, Goodyear, Shanahan, Jarvin, and Sternberg (2009) at a private preparatory school, results indicated that when admission tests were augmented with additional wide-ranging measures (e.g., self-reporting, rating scales, creative writing samples, and practical reasoning through writing prompts presenting different everyday scenarios experienced by students) predictive validity of the combined assessments were significantly higher than the traditional admission tests alone.
Introduced in 2003, the Collegiate Learning Assessment (CLA) is another alternative to standardized admission testing at the college level (Wagner, 2008). The CLA is a “performance assessment” in which the students have to demonstrate their reasoning, problem-solving, and writing skills while attempting to solve a “real-world” problem (Wagner, 2008, pp.115-116). Several other forms of standardized tests have been created within the last decade to allow for a more broad evaluation of life-long skills. The cross
disciplinary PISA problem solving test and the ISkills Test are two tests that Wagner (2008) believes have the potential to tell us more about students, specifically critical thinking and problem solving skills, accessing and analyzing information, effective oral and written communication, and possibly even agility and adaptability.
Personality Traits
Noftle and Robins (2007) examined the relationship between the Big Five personality traits (Openness to Experience, Conscientiousness, Extroversion, Agreeableness, and Neuroticism) and academic outcomes at the college level, specifically GPA and SAT scores. As of 2005, the current version of the SAT was labeled the SAT Reasoning test, which according to the Educational Testing Service (ETS), assesses reasoning ability and not intelligence. Although ETS claims that the SAT is not an intelligence test, recent research suggests that the SAT measures something very close to general mental ability (Noftle & Robins, 2007). One study found that the SAT correlated .82 with a measure of “g” (or general intelligence), retrieved from the Armed Services Vocational Aptitude Battery in a large sample from the National Longitudinal Survey of Youth (Frey and Detterman, 2004). After collecting data from four samples and four different personality inventories, Noftle and Robins (2007) discovered a positive relationship between
Conscientiousness and college GPA, as well as a positive relationship between Openness to Experience and the SAT verbal scores. While some believe “the important qualities missing from standardized tests are usually qualities like curiosity and creativity (reflecting the broad trait of openness to experience)” (Dollinger, 2011, p. 331), Noftle and Robins (2007) found a robust relationship between Openness to Experience and SAT scores. This was true even after controlling for gender and students’ prior and concurrent
academic achievement. Conscientiousness emerged as the most robust predictor of GPA (mean r = .26). There was no consistent relationship found between the other Big Five factors and academic performance (mean r = -.04, .09, -.07, and .05 for Extroversion, Agreeableness, Neuroticism, and Openness, respectively), although Openness had significant positive effects in one fourth of the studies (Noftle & Robins, 2007) “Given the link between SAT scores and intelligence, research on the personality correlates of intelligence can provide one window into the possible relation between personality and SAT scores” (Noftle & Robins, 2007, p. 117). The SAT verbal section may be related more strongly to crystallized intelligence (information obtained and skills developed over time) because of its vocabulary related content, as opposed to the math SAT math section which may be related more strongly to fluid intelligence (ability to think and reason abstractly) based on its reasoning related content (Noftle & Robins, 2007).
When Duckworth (as cited in Tough, 2012) analyzed GPA and standardized test scores among middle and high school students, she found that scores on pure IQ tests predicted standardized test scores and that scores on self-control predicted GPA. Tough (2012) goes on say that a students ability to graduate from a decent college has less to do with how smart he or she is and more do with character strengths that produce high GPA’s in middle and high school.
High school grades reveal much more than mastery of content. They reveal qualities of motivation and perseverance - as well as the presence of good study habits and time
management skills - that tell us a great deal about the chances that a student will complete a college program. (Bowen, Chingos, & McPherson, as cited in Tough, 2013, p. 153)
Academic success can be attributed to many factors, including family, school, community, and individual characteristics. Hayes-Jacobs (2010) feels that educators
should be working toward educating for sustainability, including working with young people to develop the knowledge, skills, attitudes, and understanding required to
contribute to a healthy and sustainable future, as opposed to focusing on standardized test scores alone. “Twenty-first-century graduates are a new generation of leaders and global citizens who are self-directed, creative, collaborative, caring, and multilingual. They are Individuals who will flourish in a global, competitive twenty-first century” (Houle & Cobb, 2011, p. 95). Daniel Pink (2006) indicates that the qualities measured by standardized tests, such as analytical, textual, functional and literal thinking are still necessary, but no longer sufficient for students of today. He suggests that the more creative, aesthetic, contextual, and metaphorical thinkers will find greater success in school and in the future.
Using test scores
A common question being asked of admission counselors is how much weight is placed on test scores during the admission process? Although the evidence is limited to determine the weight placed on high school admission testing, there are two sources that share information on college admission testing. A survey conducted collaboratively by ACT, Inc., the Association for Institutional Research, the College Board, Educational Testing Service, and the National Association for College Admission Counseling (referred to by Zwick, 2007, as “the joint survey”), as well as the National Association for College Admission Counseling (NACAC) Admission Trends Survey indicate that test scores are the second most important factor during the admission process, after high school grades (Zwick, 2007; Hawkins & Lautz, 2005). In a report based on the NACAC Admission Trends Survey of Colleges, Hawkins and Lautz (2005) report that grades in
college preparatory courses and admission test scores were the two factors most likely to be identified as having “considerable importance” in admission decisions, with 80% giving this response for college preparatory courses and 60% giving this response for admission test scores.
Coming back to the high school level, the SSATB provides a useful tool to member schools called the Optimal Use Study (OUS). The purpose of the OUS is to analyze SSAT scores to determine their power to predict students' academic success in an independent school setting, as measured by first-year GPA. The OUS is a valuable tool to help admission teams make the best use of SSAT scores, specific to their student body, in a data-driven admission process. “An applicant’s SSAT Score attains its greatest relevance for a school when it is viewed in the context of the relationship between that Score and students’ success at the school as measured by overall first year GPA” (SSAT, Data Helps Predict, 2011, p. 22). To determine the relationship between the score and the school, the school provides data to SSAT, which is analyzed to establish the optimal weights of the three SSAT scores (verbal, quantitative, reading) based on previous test scores and students GPA at the end of grade 9. This is a helpful tool for generating school-specific scores, which allow admission teams to evaluate and compare applicants based on data. After using the OUS, The Cate School found that the SSAT Quantitative Score was by far the best indicator of first-year academic success, followed by the Reading Score, and followed far behind by the SSAT Verbal Score (SSAT, Data Helps Predict, 2011). The admission staff found that they were able to refine their use of SSAT scores, because the OUS information provided a comparison based upon the predicted performance in first-year overall GPA at their school.
According to Sternberg (2007) we need to teach toward successful intelligence, which is the use of an integrated set of abilities, including analytical, practical, and creative virtues, to find success in life. Bloom’s taxonomy of educational objectives established a similar set of learning objectives, including cognitive, affective, and psychomotor
domains (Bloom, 1956). One of the goals of Bloom's Taxonomy was to motivate educators to expand their focus to all three domains, allowing a more holistic view of education. Educators and admission counselors must consider a variety of attributes when trying to determine those that will find success in an independent school setting. “Human intelligence includes and goes well beyond conventional conceptions of academic ability and IQ. This is why the world is full of music, technology, art, dance, architecture, business, practical science, feelings, relationships, and inventions that actually work” (Robinson, 2011, p. 119). The Standards for Educational and Psychological Testing (American Educational Research Association, American Psychological Association, & National Council on Measurement in Education, 1999) cautions against over-reliance on test scores, but states that, “although not all tests are well-developed nor are all testing practices wise and beneficial, there is extensive evidence documenting the effectiveness of well-constructed tests for uses supported by validity evidence” (p. 1).
This review addresses features of the cognitive and affective domain, but rather than psychomotor, will refer to the last domain as behavioral. The term Behavioral seemed to encompass more than just the physical, fine motor skills defined by Bloom’s (1956) psychomotor learning.
Cognitive Domain
“Business leaders, educational organizations, and researchers have begun to call for new education policies that target the development of broad, transferable skills and knowledge, often referred to as 21st century skills” (National Research Council, 2012, p. 1-1). The National Education Association (NEA, 2012) defines 21st century skills as the skills students need to succeed in work, school, and life. They range from core
educational subjects such as mathematics and science to 21st century content including global awareness; financial, economic, business, and entrepreneurial literacy; civic literacy, and health and wellness awareness. Learning and thinking skills, such as critical thinking and problem solving skills, communications skills, creativity and innovation skills, collaboration skills, contextual learning skills, as well as information and communications technology (ICT) literacy are also included in the 21st century skill content. Life skills, including leadership, ethics, accountability, adaptability, personal productivity, responsibility, social skills, and self-direction are also important 21st century skills for today’s learners (NEA, 2012). Sternberg’s (2007) successful intelligence lends itself to supporting 21st century learners.
Wagner (2008) writes about seven survival skills for the 21st century, the first being critical thinking and problem solving. In his book, he connects with a mixed audience of business, community, and education leaders and shares a recurring theme - individuals who demonstrate less linear thinking, who have the ability to conceptualize, but who can also process the data, will find success (Wagner, 2008). Team-based leadership was also stressed as a core competency. The skill of being able to work with others and
collaborate is something worth identifying and fostering in our schools because it is a lifelong skill.
Standardized tests are known to measure intelligence, but Sternberg, formerly a Yale University psychology professor and currently a professor at Oklahoma State University, recently developed an alternative SAT, which includes measurement of various aptitudes such as creativity, curiosity, and problem solving (Pink, 2006). Sternberg’s Rainbow Project, a research study aimed at identifying a way to assess students beyond testing their analytical skills, supplemented the SAT, a college admission test, with creative and practical measures. Results from The Rainbow Project not only support the construct validity of the theory of successful intelligence, but also suggest its role in the college admission process as a supplement to the SAT (Sternberg, 2006). “Based on the multiple regression analyses, the triarchic measures approximately double the predicted amount of variance in college GPA when compared to the SAT alone (comparative R² values of .199 to .098, respectively)” (Sternberg, 2006, p. 344). The triarchic measures are the creative, analytical, and practical abilities that successfully intelligent people demonstrate and use to attain success in life (Sternberg & Grigorenko, 2000).
Dollinger (2011) conducted research based on the ACT (a college admission test) due to concerns that standardized admission tests penalize creative thinkers. His results determined that this was not true. “High ACT scores tended to devise the richest, most individualistic photo essays, giving multiple indications of creative thinking” (p. 337). Although the magnitude of effects were modest, what he found was that standardized admissions tests have a likely chance of selecting those who will be at least slightly more creative in college. We do know that admission tests do not predicative creativity as well
as they predict academic achievement and if admission committees wish to select those will the greatest creative potential then alternative assessments should also be used (Dollinger, 2011; Kaufman, 2010; Sternberg, 2007).
Grigorenko et al. (2009) found “the predictive validity of middle-school GPA and standardized tests can be enhanced by the introduction of additional theory-based measures, such as self-reports” (p. 980). In this study, students completed a PACE battery (named after the Psychology of Abilities, Competencies, and Expertise Center, at Choate Rosemary Hall school), which was a collection of self-reported characteristics based on the WICS and SRL (self-regulated learner) frameworks. “The measures of the PACE battery predict not only the mean value of GPA, but also its rate of growth. The magnitude of predictive validity is substantial, totaling up to 50% of the variance in Choate students’ GPA” (Grigorenko et al., 2009, p. 976). In addition, the study demonstrated that SSAT measures explain only about 15% of students’ GPA, with the SSAT Quantitative score being the only variable showing a statistically significant contribution to this prediction.
In a recent IBM survey of 1,500 CEO’s, creativity was identified as the single most important leadership competency for the complexity of the world that we live (IBM, as cited in Houle & Cobb, 2011). “In a world where lifelong employment in the same job is a thing of the past, creativity is not a luxury. It is essential for personal security and fulfillment” (Robinson, 2011, p.13). Although creativity is observed frequently in young children, Sternberg and Grigorenko (2000) believe it is more difficult to find among older children and adults because they suggest our society has suppressed their creative
writing sample or asking different questions during an interview, such as describing how you would react if faced with an ethical dilemma, Admission Counselors can get a better sense of a student’s creative ability, problem solving skills, and executive function capabilities. There are three crucial themes for understanding creativity: human intelligence is highly diverse, dynamic, and distinct (Robinson, 2011).
Cognitive abilities, so often believed to be measured by tests alone, can be assessed and measured through a variety of other facets such as descriptive writing or more creative interview techniques. Admission Counselors are cutting themselves and their schools short if they neglect to assess the attributes and skills necessary to be a successful 21st century learner. Ellen Kumata, who consults to senior executives at Fortune 200 companies, expresses that critical thinking skills can be seen in the questions that a person asks (Wagner, 2008). She says that you have to understand what the right questions are and not be afraid to ask the nonlinear, counterintuitive questions. Kumata believes that these are the questions that will take you to the next level and that
demonstrate a critical thinker. Simply mastering the basic skills of reading, writing, and math is no longer enough. Increasingly, almost any job that pays more than minimum wage today—both blue and white collar—requires employees who know how to solve a range of intellectual and technical problems (Wagner, 2008).
Affective Domain
Spady and Schwann (2010), suggest that educators should identify and develop a framework of life-performance learner outcomes, which essentially is a profile of learner (student) attributes that educators strive to cultivate among and within their student body. Although the descriptive terms were extensive, Spady and Schwann noted that there was
a recurrent theme around the terms “self-directed learner” and “inquisitive learner” as important qualities for students to embody. Costa and Kallick (2000) maintain that an individual’s capacity for developing their intellect is broadened through intentional and thoughtful reflection, in addition to appropriate emotion.
It is believed that self-efficacy can have a positive impact on academic outcomes as well (Bandura, 1977, 1986, 1993, 1994, 1997; Pajares, 1996; Schunk, 1982). In a study of freshmen students enrolled in a “for-profit” college, Becker and Gable (2009)
examined the relationship of self-efficacy with GPA, attendance, and college student retention. It was concluded that general self-efficacy was related to first term academic success. After controlling for age and gender, students’ perceptions of their general self-efficacy, in other words, their positive belief in their own capability to problem solve and achieve their intended goals, “was responsible for incrementing the explanation of variance in GPA by 5% (p < .01) beyond the variance explained by age and gender” (p. 15). Students with a high sense of efficacy will study harder and persist longer when they approach difficulties, whereas low efficacy students perform worse at learning tasks, tend to avoid difficult tasks, and lack regulation of their learning behaviors (Schunk, 1982). “Students’ belief in their capabilities to master academic activities affects their aspirations, their level of interest in academic activities, and their academic
accomplishments” (Bandura, 1994, School as an Agency section, para. 4).
People with low self-efficacy may believe that things are tougher than they really are, a belief that fosters stress, depression, and a narrow vision of how best to solve a problem. High self-efficacy, on the other hand, helps to create feelings of serenity in approaching difficult tasks and activities. As a result of these influences, self-efficacy beliefs are strong determinants and predictors of the level of accomplishments that individuals finally attain. (Pajares,1996, para. 4)
The degree to which students have a strong sense they can be successful in meeting academic and school demands has been referred to as academic self-efficacy (Jinks & Morgan, 1999). Academic self-efficacy reflects the level of confidence or competencies a student reports for completing or succeeding with academically related tasks and achievement (Roeser, van der Wolf, & Strobel, 2001). According to Bandura (1977), self-efficacy is cognitive and causes self-regulating decisions that determine a
combination of behavior, effort, and persistence. “Because academic (self-efficacy) belief is cognitive and not the same as behavior, self-efficacy can be measured separately from self-regulating behaviors and academic results; therefore, self-efficacy can be used to predict behavior, effort, persistence, and results” (Becker & Gable, 2009, p. 5). Pintrich and De Groot (as cited in Pajares, 1996) identified a correlation between self-efficacy and both cognitive strategy use and self-regulation through metacognitive strategies. They also reported that academic self-efficacy correlated with academic performances including semester and final year grades, classroom work, homework, test and quizzes, essays, and reports.
Humor is another quality that can be linked with high emotional intelligence and positive psychological functioning (Costa & Kallick, 2000; Pink, 2006). Research by Goleman and the Hay Group (as cited in Pink, 2006) found that within organizations, the most effective leaders were funny and actually had their employees laughing three times more often than their managerial counterparts. According to Costa and Kallick (2000), humor has the ability to unleash creativity and encourage higher-level thinking skills in areas such as anticipating, identifying novel relationships, making analogies, and visual imaging. Humor represents many aspects of the sophisticated thinking required in a time
of drastically increasing outsourcing and automation. It allows for a personal connection that a computer cannot provide. Laughter, on its own, can lead to joyfulness, which in turn can lend itself to greater creativity, productivity, and collaboration (Pink, 2006). Several studies support the theory that social and emotional competence play a strong role in academic achievement (Parker, Creque, Barnhart, Harris, Majeski, Wood, Bond, & Hogan, 2004; Parker, Summerfeldt, Hogan, & Majeski, 2004; Pasi, 1997). In a longitudinal study examining the transition from high school to college, Parker et al. (2004) found that various dimensions of emotional intelligence (EI) were predictors of academic success. Parker, Creque et al. (2004) conducted a follow-up study to determine if the same was true for a younger demographic, focusing their research on 9th through 12th grade students. “When the relationship between academic success and EI was examined using the total sample, overall EI was found to be a significant predictor of academic success” (Parker, Creque et al., 2004, p. 1327). For males, verbal IQ significantly predicts both Grade Point Average (GPA) and EI, and EI significantly predicted GPA (Hogan, Parker, Wiener, Watters, Wood, & Oke, 2010). Hogan et al. (2010) add that for male adolescents it is important to recognize the importance of both verbal IQ and EI abilities as indicators for academic success.
Students with higher levels of intrapersonal skills, adaptability, and stress
management capabilities are better able to cope with the social and emotional demands of making the transition from a secondary to a post-secondary school environment
compared to those students who score low in these areas (Parker, Creque et al., 2004). Poropat (2009) analyzed studies of the correlation between personality factors and school grades in primary, secondary, and higher education, and found a significant positive
association between conscientiousness (i.e., carefulness, self-discipline, thoroughness, deliberation, self-organization) and grades in elementary school though college.
According to Almlund, Duckworth, Heckman, and Kautz (as cited in National Research Council, 2012), conscientiousness predicts college grades to the same degree that SAT scores do, while personality measures predict performance on achievement tests and, to a lesser degree, performance on intelligence tests. Heaven and Ciarrochi (2012) “examined the significant predictors of academic performance using hierarchical regression
analysis” (p. 3). While intelligence in Grade 7 was the strongest predictor of academic success in Grade 10, Conscientiousness did reach significance as well. In keeping with previous research (e.g., Poropat, 2009), Heaven and Ciarrochi (2012) found
conscientiousness to be a significant predictor of academic performance for total GPA and most individual subjects as well, including Math, Science, History, Geography, and Religious Studies. The study consisted of 786 high school students who completed standardized cognitive ability tests in Grade 7 and provided both personality and school performance scores in Grade 10. “Among intrapersonal and interpersonal competencies, conscientiousness is most highly correlated with desirable outcomes in education and the workplace. Antisocial behavior, which has both intrapersonal and interpersonal
dimensions, is negatively correlated with these outcomes” (National Research Council, 2012, p. 3-19). According to Tough (2012), Brent Roberts, a professor at the University of Illinois at Urbana-Champagne, is the leading expert on conscientiousness.
What intrigues Roberts most about conscientiousness is that it predicts so many outcomes that go far beyond the workplace. People high in conscientiousness get better grades in high school and college; they commit fewer crimes; and they stay married longer. They live longer - and not just because they smoke and drink less. They have fewer strokes, lower blood pressure, and a lower incidence of Alzheimer’s disease. (Tough, 2012, p. 71)
Behavioral Domain
Costa and Kallick (2000) discuss the importance of not only focusing on how many answers a student knows, but also on how students behave when they don’t have the answer. “We want students to learn how to develop a critical stance with their work: inquiring, editing, thinking flexibly, and learning from another person’s perspective” (Costa & Kallick, 2000, p. 7). The necessity of these skills goes well beyond
adolescence. Soft skills, such as getting along with classmates, resiliency, grit, and the ability to communicate and advocate for oneself, are crucial life skills that experts are saying teens lack, but which are essential for college success (Adams, 2012). One study tested the importance of grit as a non-cognitive predictor of academic success. Grit, which is defined as perseverance and passion for long-term goals, accounted for an average of 4% of the variance in success outcomes, including educational attainment among two samples of adults (N=1,545 and N=690), grade point average among Ivy League undergraduates (N=138), retention in two classes of United States Military Academy, West Point, cadets (N=1,218 and N=1,308), and ranking in the National Spelling Bee (N=175) (Duckworth, Peterson, Matthews, & Kelly, 2007). They found that grit did not relate positively to IQ but was highly correlated with Big Five
Conscientiousness. Grit demonstrated incremental predictive validity of success measures over and beyond IQ and conscientiousness. Their findings suggest “the achievement of difficult goals entails not only talent but also the sustained and focused application of talent over time” (Duckworth et al., 2007, p. 1087). The skills that admission counselors
are measuring and that the literature supports as being vital to success are also being measured in the work force and are traits that are crucial for marketability for future jobs (Goleman, 1998).
There are many theories and beliefs surrounding intelligence and the many forms of intelligence. Sternberg (2000) differentiates between conventional intelligence and successful intelligence.
Successful intelligence is the integrated set of abilities needed to attain success in life, however an individual defines it, within his or her sociocultural context. People are successfully intelligent by virtue of recognizing their strengths and making the most of them at the same time that they recognize their weaknesses and find ways to
compensate for them. (Sternberg, 2000, p. 6)
Sternberg (2000) suggests that students can master successful intelligence if they adjust their behavior and thinking patterns, allowing them to adapt, shape, and select
environments in which they are most successful. At the same time, an individual’s willingness to identify and acknowledge their own weaknesses and modify their behavior and learning styles based on those weaknesses allows the opportunity to find success. In this age of overabundance, simply appealing to rational, logical, and functional needs are going to be insufficient. “Mastery of design, empathy, play, and other seemingly soft aptitudes is now the main way for individuals and firms to stand out in a crowded marketplace” (Pink, 2006, p. 34).
Data-Driven Decision Making
“Data drives the successful admission process within and beyond the walls of the admission office - providing the information required to work with families, colleagues, enrolled students, and other school constituents” (SSAT, Make Data Driven Decisions, 2011, para. 1). Chaffer Schroeder (2011) writes about two challenges associated with
data-driven decision making (DDDM) in the admission process: (1) examining effective predictors of success requires us to dig deep into the data, which is something most of us have not been trained to do; and (2) it can be uncomfortable. The quantitative data are important though, because it can show us things in a concrete way that qualitative data cannot. The use of data gets uncomfortable when the data show us that not everyone succeeds or that not everyone is the right fit for a particular school. “In the era of Millennials in which everyone wins, this can be an unpopular finding” (Chafer
Schroeder, 2011, para. 6). It is also important to keep in mind that data has the potential to become misinformation or can lead to invalid inferences if it is not understood
properly or if you are not working with high quality data (Marsh et al., 2006). In order to effectively chart progress and manage resources effectively in today’s world, admission personnel must gather and interpret more information than ever before.
The need to filter a plethora of data from a number of sources, to collect data (and the right data) from year to year, to interpret those data within a school- specific context, to provide data (and the right data) to other school departments, and to use data analysis to calibrate the admission process are particularly daunting tasks for any admission office. (SSAT, 2013, para. 2)
While it is important to acknowledge that quantitative data are part of the admissions equation, it is also important to keep in mind that students are not solely numbers, and we must rely on more than just quantitative data when making admissions decisions. “What we must do on an institutional level is examine our own data and how they inform our practice (or don’t) and how we may balance the qualitative and quantitative factors to best serve our students, families, and our institutions” (Chaffer Schroeder, 2011, para. 8).
Public schools have been collecting data for decades, but the passing of the No Child Left Behind (NCLB) Act in 2001 triggered school district leaders to begin using the data
for promoting school improvement (Sagebrush, 2004). This eventually forced public school systems to assume greater accountability and responsibility for tracking outcomes and improve performance across grade levels. While the NCLB act expired in 2008, schools and programs continue to reap significant benefits from using data as a constructive tool to continually improve student performance and to develop coherent instructional programs aligned with standards (Pathways to College, 2013).
SSATB has developed a new data-driven admission funnel, which illustrates the necessary and widespread use of data throughout the admission process to identify the students coming into the system and to define the students moving through the system (SSAT, 2013). “The original admission funnel was first introduced in the 1970s as a way of looking at the recruitment and admission process on a more systemic level; it presents a static view of customers (or prospects) as they “fall out” of interest in a
product/service” (Admissions Lab, 2005 as cited in SSAT, 2013). In the SSAT version of the new funnel, input describes the process of acquiring the necessary background data, and output describes the process for creating positive school and student outcomes. The new model reflects what is happening in the larger environment; takes into account the way technology has – and will continue to – change the ways in which families and schools interact; and, most important, focuses the attention needed on student outcomes (SSAT, 2013).
Summary
This section has contained evidence supporting the importance of finding a balance between the use of admission test data and assessing cognitive, affective and behavioral characteristics for academic success. Within the cognitive domain we talked about the
importance of 21st century skills for our current students, including, but not limited to, critical thinking skills, creativity, leadership, innovation, and adaptability. We also learned that thinking outside the box and finding new solutions to problems are attributes that demonstrate a student will find success in their academic setting. Self-efficacy, humor, and both social and emotional competence were all highlighted as important affective attributes to student success in school and beyond. Behaviorally, we learned that responsible risk-taking, motivation, and negative behaviors all have an impact on academic success as well.
Sternberg (2006, 2007, 2011) suggests that the assessments used in the admission process (for both secondary and postgraduate schooling) should better reflect the qualities that matter most throughout life and not just during a student’s education. Goleman’s work (as cited in Costa & Kallick, 2000) subscribes to the belief that intellect and emotions are “inextricably intertwined” (p. 6). If independent schools wish to enhance their selection process of topnotch students, they must identify the competencies that are essential to student success and assess applicants in a way that will portray those
competencies. By gathering the proper data and knowing how to use it most effectively, admission offices are allowing for accountability and transparency that is key to any schools success.
Readers interested in admission counselors’ perceptions of cognitive, affective, and behavioral attributes for success in an independent high school are referred to the results of a survey of 230 independent school admission counselors (Kiley & Gable, 2013).
III. METHODOLOGY Introduction
There are hundreds of independent high schools across the country that require admission tests scores as part of the admission process; however, there is limited
evidence as to the validity of these test scores in relationship to student academic success. This research was carried out to examine the relationship between Secondary School Admission Test scores and student GPA at the end of Grade 9, PSAT scores in Grade 11 and SAT scores in Grade 12 before and after controlling for student demographics.
Research Questions
1. What is the relationship of SSAT scores to end of grade 9 GPA, grade 11 PSAT scores, and grade 12 SAT scores?
2. What is the relationship of the following demographic variables to end of grade 9 GPA, grade 11 PSAT scores, and grade 12 SAT scores?
a. Educational support (no Individualized education program (IEP) vs. existing IEP)
b. Financial aid (no aid vs. receives aid)
c. Parental status (multiple parents vs. single parent)
d. Previous school (independent school vs. public school)
e. Ethnicity (Caucasian vs. other)
f. Gender (male vs. Female)
g. Entering year (2006-2008 vs. 2009-2011)
3. To what extent and in what manner can variation in end of grade 9 GPA be explained by the following grade 8 SSAT scores: verbal, quantitative, and reading?
4. After controlling for the student demographic variables, to what extent and in what manner can variation in end of grade 9 GPA be explained by the following grade 8 SSAT scores: verbal, quantitative, and reading? 5. To what extent and in what manner can variation in grade 11 PSAT
scores and grade 12 SAT scores be explained by the
following grade 8 SSAT scores: verbal, quantitative, and reading? 6. After controlling for the student demographic variables, to what extent and
in what manner can variation in grade 11 PSAT scores, and grade 12 SAT scores be explained by the following grade 8 SSAT scores: verbal, quantitative, and reading?
Sample Student Test Data
The sample for the research included 110 students who took the Secondary School Admission Test (SSAT) during eighth grade for entrance into one independent school setting. The data file included eighth grade test scores for new applicants, as far back as 2006, and students’ GPA at the end of Grade 9, for those that enrolled. A subset of 105 enrolled students who also took the PSAT in Grade 11 and 57 who took the SAT in Grade 12 were also identified. Demographic variables on each of the students included whether or not they had an existing educational support plan (no IEP vs. existing IEP), financial aid status (no financial aid vs. receives financial aid), previous school setting (private vs. public), parental status (single parent vs multiple parent), ethnicity (caucasian vs. other), gender (male vs. female), and year the student enrolled (2006-2008 vs. 2009-2011).
Table 1 describes the frequency and percent of the seven student demographic variables.
Table 1
Student demographic data
Demographic
Variable Frequency Percent
Educational Support (IEP)
no 96 87 yes 14 13 Financial aid no 74 67 yes 36 33 Previous school public 28 26 private 82 74 Parental status single parent 16 15 multiple parents 94 85 Ethnicity caucasian 88 80 other 22 20 Gender male 53 48 female 57 52 Year enrolled 2006-2008 58 53 2009-2011 52 47
Examination of the demographic data indicated that most students had no IEP and did not receive financial aid. The majority of students previously attended a private school and came from homes with multiple parents. The gender balance and year enrolled where equally balanced.
Instrumentation SSAT
The SSAT measures three content areas including verbal, quantitative, and reading comprehension. There are four multiple-choice sections with testing time of 30 minutes for two quantitative sections and one verbal section, and 40 minutes for the reading section. The test yields four scores: verbal, quantitative, reading, and total (verbal + quantitative + reading). The test also includes a 25-minute writing sample. According to the test specifications in the Interpretive Guide (2011), writing samples are not scored, but they are submitted to score recipients for the purpose of supplementing a student’s application. Standard administration of the SSAT allows for total testing time of 155 minutes.
Validity. Although the SSAT Interpretive Guide (2011) states, “previous validity studies of the SSAT have shown a positive correlation between school grades and SSAT scores” (p. 22), the SSAT Board (SSATB) indicated that the data were not currently available. In light of this, the researchers obtained the 1985 Interpretive Guide from the Educational Testing Service (ETS), the group who initially developed the assessment. The SSATB indicated through email correspondence with the researchers that the test content has remained the same since the 1985 Interpretive Guide was published. Therefore, information from the 1985 Interpretive Guide was adopted to support the content validity of the test development process. ETS test development specialists prepared the SSAT, and “each question contributing to a student’s score has been
pretested and statistically analyzed to determine its difficulty and discriminating power” (SSAT, 1985, p. 3).
The 1985 predictive validity evidence regarding relationships of the SSAT scores to GPA was reported by ETS for 1182 students from 21 schools. The multiple correlation of the SSAT scale scores and GPA was R=.56 (R2=. 31, effect size = large).
Reliability. Cronbach’s alpha internal consistency reliabilities for the data from the
verbal, quantitative, and reading scales ranged from .85 to .95. (SSAT Interpretive Guide, 2011).
Data Collection
Permission was requested by the researchers to the Head of School to obtain admission test scores, student GPA, racial identity, students’ previous school, parental status, financial aid status, and whether a student has an IEP by accessing student records. The sample of 110, was chosen based on those students who took the SSAT and were admitted to the school. The sample was determined by the year that the school began using its online database (2006). These data were gathered during the 2012-2013 school year.
Data Analysis
Correlations were generated to answer Research Questions 1 and 2. Research
Questions 3 and 5 were analyzed using stepwise multiple regression with the three grade 8 SSAT scores as independent variables and grade 9 GPA, grade 11 PSAT and grade 12 SAT scores as dependent variables in three separate regression analyses. Research Questions 4 and 6 used a hierarchical regression model, where the students’ demographic variables were first entered as a group. The three SSAT scale scores were then entered as
independent variables to examine the extent and manner in which they incremented the explanation of variance (R2) for each of three dependent variables: end of grade 9 GPA scores, grade 11 PSAT scores and grade 12 SAT scores. For all the regression analyses, tests of the required assumptions of normality, linearity, and homoscedasticity between the predicted dependent variable scores and errors of prediction were successfully examined using residual plots (Tabatchnick & Fidell, 2012). See Appendix A for examples of the residual plots.
Limitations & Delimitations
Students who do not do well on the Secondary School Admission Test will not be admitted to the school, and therefore were not included in the research study. The
student data were limited to students who were accepted and who attend one independent school setting. Given this potential restriction in the range of the Secondary School Admission Test scores, the derived correlations could be underestimates of the true relationships.
The delimitations include limiting the student data to one independent school setting and only examining one admission test, the SSAT.
IV. FINDINGS Introduction
The primary purpose of this study was to conduct a validation of the SSAT regarding it’s predictive validity for explaining end of grade 9 GPA, grade 11 PSAT, and grade 12 SAT.
Prior to presenting the SSAT validation data, the intercorrelations among the verbal, quantitative, and reading SSAT scores will be presented. Examination of the correlations in Table 2 indicates that all the correlations were significant at the p<.001 level and were associated with large effect sizes (r²). As expected, the highest correlation was found between SSAT verbal and SSAT reading (r=.75). The findings that follow are ordered by each research question.
Table 2
Intercorrelations of SSAT Scores (N=110)a
SSATV SSATQ SSATQ r=.51*** r²=.26 SSATR r=.75*** r=.52*** r²=.56 r²=.27
Note. Effect size guidelines are as follows: r²=.01, small; r²=.09, medium; r²=.25, large.
***
p<.001 a
Research Question 1
What is the relationship of SSAT scores to end of grade 9 GPA, grade 11 PSAT scores, and grade 12 SAT scores?
Table 3 contains the correlations of the SSAT with end of grade 9 GPA, grade 11 PSAT scores, and grade 12 SSAT scores. All correlations were significant at the p<.001 level except SSATV and SATQ (r=.32, p<.01). All the effect sizes were classified as medium to high. Table 3a contains the effect sizes for all the correlations in Table 3. The examination of the correlations of the SSAT scores with grade 9 GPA indicated that the SSAT had a high level of predictive validity for end of ninth grade GPA scores. The correlations ranged from r=.51 to r=.54. All of these relationships were associated with large effect sizes. The center portion of the table displays the relationship of the SSAT scores with grade 11 PSAT scores. The correlations for SSATV and PSATR (r=.76) and SSATR and PSATR (r=.72) were quite high with large effect sizes. The lowest
correlation between the SSAT score and the PSATR was found between SSATQ and PSATR (r=.41). Two out of the three SSAT scores had moderate correlations with PSATQ. Those included the SSATV and SSATR (r=.41, r=.43). As we would expect, SSATQ correlated highly with PSATQ (r=.79) with a large effect size. Turning to the grade 12 students who had SAT scores and attended the school (N=57), the correlations were quite supportive for the relationship between SSATR and SATR (r=.71). While SSATQ had a high correlation with SATQ, as we would expect (r=.80, r²=.64), SSATV and SSATR were lower than expected (r=.32, r=.38) with moderate correlations to SSATQ.
Table 3
Correlations of SSAT Scores with End of Grade 9 GPA, Grade 11 PSAT Scores, and Grade 12 SAT Scoresa
PSAT Scoresc SAT Scoresd
SSAT Scoresb GPA PSATR PSATQ PSATW SATR SATQ SATW
SSATV .51 .76 .41 .63 .63 .32 .48 SSATQ .54 .49 .79 .49 .53 .80 .39 SSATR .51 .72 .43 .64 .71 .38 .49 SSATT .61 .76 .65 .69 .77 .64 .56
Note. Sample sizes were as follows: SSAT, N=110; PSAT, N=105; SAT, N=57 a
All correlations significant at the p<.001 level b
SSATV=Verbal, SSATQ=Quantitative, SSATR= Reading, SSATT=Total c
PSATR=Reading, PSATQ=Quantitative, PSATW=Writing d
Table 3a
Effect Sizes for Correlations of SSAT Scores with End of Grade 9 GPA, Grade 11 PSAT Scores, and Grade 12 SAT Scoresa
PSAT Scoresc SAT Scoresd
SSAT Scoresb GPA PSATR PSATQ PSATW SATR SATQ SATW
SSATV .26 .58 .17 ..40 .40 .10 .23 SSATQ .29 .25 .62 .25 .28 .64 .15 SSATR .26 .52 .18 .41 .50 .14 .24 SSATT .37 .58 .42 .48 .59 .41 .31
Note. Sample sizes were as follows: SSAT, N=110; PSAT, N=105; SAT, N=57 a
Effect size guidelines are as follows: r²=.01, small; r²=.09, medium; r²=.25, large. b
SSATV=Verbal, SSATQ=Quantitative, SSATR= Reading, SSATT=Total c
PSATR=Reading, PSATQ=Quantitative, PSATW=Writing d
Research Question 2
What is the relationship of the following demographic variables to end of grade 9 GPA, grade 11 PSAT scores, and grade 12 SAT scores?
a. Educational support (no IEP = 1, IEP = 2)
b. Financial aid (no FA = 1, receives FA = 2)
c. Parental status (single parent = 1, multiple parents = 2)
d. Previous school (public school = 1, private school = 2)
e. Ethnicity (caucasian = 1, other = 2)
f. Gender (male = 1, Female = 2)
g. Entering year (2006-2008 = 1, 2009-2011 = 2)
The demographic variables were collected and recorded from the total sample. These variables include whether or not a student receives educational supports, the request and award of financial aid, their previous school, parental status, ethnicity, gender, and entering year. These are gathered for all applicants during the admission process. The demographics were found in studies reviewed in Section II to relate to success in high school. Table 4 contains the correlations of the demographic variables with the end of grade 9 GPA, grade 11 PSAT scores, and grade 12 SAT scores. Examination of the correlations indicated that the highest degree of relationship for GPA was with IEP (r=-.48, r²=.23). That is, those students who had no IEP tended to have higher GPA’s at the end of grade 9. This same degree of relationship was found between having an IEP and the PSAT scores; PSATR (r=-.35, r²=.12), PSATQ (r=-.29, r²=.08), PSATW (r=-.43, r²=.18). Correlations between IEP and SAT scores were not calculated due to incomplete sample sizes (no IEP, N=52; IEP, N=5).
There was a low negative correlation (r=-.19, r²=.04) with students who receive financial aid and PSATW scores. Students who received financial aid tended to have
lower PSATW scores. This is a small/medium effect size. For parental status, previous school, ethnicity, and year entered the school no significant relationships were found. Regarding gender, males tended to have higher PSATQ (r=-.20) and SATQ (r=-.32) scores.