Merger and Its Effect on Performance of Indian Public Sector
Bank: A Case Study on Merger of Nedungadi Bank and Punjab
National Bank
Gopal Chandra MondalResearch Scholar, Dept. of Economics, Vidyasagar University, India& Chief Financial Officer,IDFC Foundation, New Delhi, India
Dr Mihir Kumar Pal
Professor,Dept. Of Economics, Vidyasagar University,India Dr Sarbapriya Ray*
Assistant Professor,Dept. of Commerce, Vivekananda College, Under University of Calcutta, Kolkata,India Abstract
The study tries to assess analytically the effect of merger of Nedungadi bank and Punjab National Bank on their operating performance in terms of different financial parameters by means of Ordinary least square technique and financial ratios considering database for the period from 2000-01 to 2014-15. Most of the financial indicators of Nedungadi bank and Punjab National Bank display significant improvement in their operational performance during post merger period. Post merger regression analysis suggests that impact of various performance parameters on profitability (ROA) parameter have improved much in comparison with entire study period’s regression analysis(both pre and post merger). It can be concluded from the regression analysis that merger of Nedungadi bank with PNB has significant impact on profitability performance of the Bidder Bank (PNB).
Keywords: Merger, India, Nedungadi bank, Punjab National Bank. 1. Introduction
Mergers and Acquisitions are important corporate strategic measure that assists the merged entity in external growth and afford it competitive advantage. The banking sector has been one of the major sectors that have received renewed interest from researchers and economists owing to the key role played by banks in the development of an economy, especially emerging economy like India. The Indian financial sector has witnessed a drastic transformation during the nineties with the opening up of the financial sector in 1990 followed by RBI’s reform program. It aimed at creating a competitive and efficient banking system in India with the entry of many private banks both Indian as well as foreign banks and increased competition among the commercial banks in India. Moreover, the government and policy makers have adopted various policies and measures out of which consolidation of banks emerged as one of the most preferable strategy. Merger of two banks, either in form of merger of two weaker banks or in the form of merger of one healthy bank with another weak bank, is the most commonly adopted form of consolidatation. One of the key motives behind the merger and acquisition (M&A) in the banking industry is to achieve economies of scale and scope. This is because the size increases the efficiency of the system which helps in the diversifications of the products and assists in reducing the risk as well.
The main objective of the study is to ascertain the impact of M&A on performance of bank after merger taking place between Nedungadi Bank Ltd(NBL) and Punjab National Bank (PNB) on February 1, 2003.The study has been under taken considering database for the period from 2000-01 to 2014-15 to evaluate the effectiveness of merger of the Nedungadi Bank Ltd. (NBL) with Punjab National Bank (PNB) on the basis of selected variables.
2. Brief review of Literature:
Quite a few studies have examined the various facets of Merger and Acquisitions (M&As) on banking sector as well as on Indian financial services sector that have been outlined below.
Alövsat (2002) examined that synergy is one of the core factor behind the merger and took 56 mergers from US industry, and the cash flows improvement in the productive usage of assets and increasing the sales and showed the surviving firm improvement in operating cash flows. The post merger situation create additional value and shows the improvement of bidder firm with price to book ratio, used non-parametric test as most suitable method of testing post merger performance.
DeLong (2003) examined a sample of 54 bank mergers announced between 1991 and 1995, tests several facets of focus and diversification. The study found that upon announcement, the market rewards the merger of partners that focus their geography and activities and earning stream. Only of these facets, focusing
earning streams enhances long-term performance.
Paul (2003) studied the merger of Bank of Madura with ICICI Bank where it has been evaluated the valuation of the swap ratio, the announcement of the swap ratio, share price fluctuations of the banks before the merger decision announcement and the impact of the merger decision on the share prices. and concluded that synergies generated by the merger would include increased financial capability, branch network, customer base, rural reach, and better technology. However, managing human resources and rural branches may be a challenge given the differing work cultures in the two organizations.
Shanmugam & Nair (2004) identified factors in their study on mergers and acquisitions of banks in Malaysia and suggested that globalization, liberalization and information technology developments have contributed to the need for a more competitive, resilient and robust financial systems.
Mehta Jay & Kakani Ram Kumar (2006) stated that there were multiple reasons for Merger and Acquisitions in the Indian Banking Sector and still contains to capture the interest of a research and it simply because of after the strict control regulations had led to a wave of merger and Acquisitions in the Banking industry and states many reason for merger in the Indian Banking sector. While a fragmented Indian banking structure may be very well beneficial to the customer because of competition in banks, but at the same time not to the level of global Banking Industry, and concluded that merger and Acquisition is an imperative for the state to create few large Banks.
Saraswathi (2007, p. 230) studied the merger of Global Trust Bank and Oriental Bank of Commerce and that this merger paved the way to several things in the transition period and pre merger strategy. It visualized the need for the diverse cultures to arrive at an understanding and to work hand in hand. Apart from the integration of diverse cultures, a way to inherit the advanced processes and expertise of the staff in a phased and systematic manner should be paved. It is also equally important and challenging for the transferee bank in handling the issues relating to continuance of the services of employees of the transferor bank and their career planning.
Murthy (2007) studied the case of five bank mergers in India viz. Punjab National Bank and New Bank of India, ICICI Bank and Bank of Madura, ICICI Ltd. and ICICI Bank, Global Trust Bank and Oriental Bank of Commerce and Centurion Bank with Bank of Punjab. It was observed that consolidation is necessary due to stronger financial and operational structure, higher resources, wider branch network, huge customer base, technological advantage, focus on priority sector, and penetration in rural market. Further, some issues as challenges in aforesaid mergers were identified as managing human resources, managing the client base, acculturation, and stress of bank employees.
Mantravadi Pramod & Reddy, A Vidyadhar (2007) evaluated the impact of merger on the operating performance of acquiring firms in different industries by using pre and post financial ratio to examine the effect of merger on firms. They selected all mergers involved in public limited and traded companies in India between 1991 and 2003 and their result suggested that there were little variation in terms of impact as operating performance after mergers. In different industries in India, particularly banking and finance industry had a slightly positive impact of profitability on pharmaceutical, textiles and electrical equipments sector and showed the marginal negative impact on operative performance. Some of the industries had a significant decline both in terms of profitability and return on investment and assets after merger.
Anand Manoj & Singh Jagandeep (2008) studied the impact of merger announcements of five banks in the Indian Banking Sector on the share holder bank. These mergers were the Times Bank merged with the HDFC Bank, the Bank of Madurai with the ICICI Bank, the ICICI Ltd with the ICICI Bank, the Global Trust Bank merged with the Oriental Bank of commerce and the Bank of Punjab merged with the centurion Bank. The announcement of merger of Bank had positive and significant impact on share holder’s wealth.
Devos, Kadapakkam & Krishnamurthy (2008) studied M&A as value creation, efficiency improvements as explanations for synergies and produced evidence which suggests that mergers generate gains by improving resource allocation rather than by reducing tax payments of increasing the market power of the combined firm.
Kuriakose Sony et al., (2009), focused on the valuation practices and adequacy of swap ratio fixed in voluntary amalgamation in the Indian Banking Sector and used swap ratio for valuation of banks, but in most of the cases, the final swap ratio is not justified to their financials.
Aharon David Y et al., (2010), analyzed the stock market bubble effect on Merger and Acquisitions and followed by the reduction of pre-bubble and subsequent, the bursting of bubble seems to have led to further consciousness by the investors and provide evidence which suggests that during the euphoric bubble period, investor take more risk. Merger of banks through consolidation is the significant force of change that took place in the Indian Banking sector.
Panwar (2011) studied ongoing merger trends in Indian banking from the viewpoint of two important stakeholders of a banking firm- stockholders and managers. The findings show that the trend of consolidation in Indian banking industry has so far been limited mainly to restructuring of weak banks and harmonization of
banks and financial institutions. Voluntary mergers demonstrating market dynamics are very few. She concluded that Indian financial system requires very large banks to absorb various risks emanating from operating in domestic and global environments.
Sinha Pankaj & Gupta Sushant (2011) studied a pre and post analysis of firms and inferred that it had positive effect as their profitability, in most of the cases deteriorated liquidity. After the period of few years of Merger and Acquisitions(M&As), it came to the point that companies may have been able to leverage the synergies arising out of the merger and Acquisition that have not been able to manage their liquidity. Study showed the comparison of pre and post analysis of the firms. It also indicated the positive effects on the basis of some financial parameter like Earnings before Interest and Tax (EBIT), Return on share holder funds, Profit margin, Interest Coverage, Current Ratio and Cost Efficiency etc.
Dutta and Dawn(2012) in a paper entitled “ Merger and Acqusition in Indian banks after liberalization” investigates the performance of merged banks in terms of its growth of total assets, profits, revenue, deposits and number of employees. The performance of merged banks is compared taking four years of prior merger and four years of post merger.The study findings suggest that the post merger periods were successful and witnessed a significant increase in total asset, profits, revenues, deposits and the number of employees of the acquiring firms of the banking industry of India.
V.Radha Naga Sai and Syed Tabassum Sultana(2013) evaluates the performance of selected two banks based on the financial ratios from the perspective of pre and post merger. In analyzing the impact, paired t test was applied to the various financial ratios for before and after merger data. It has been concluded based on the analysis of data that in net profit margin,operating profit margin, return on capital employed , return on equity and debt equity ratio, there is significant difference but there is no significant difference with respect to gross profit margin.
Suresh Kumar(2013) made an attempt to study the impact of consolidation on different profitability and efficiency parameters of the banks. In the study , attempt was made to compare the premerger and post -merger performance of Bharat Overseas bank and Indian Overseas bank by comparing different efficiency parameters like profit per employee, business per employee, investment and advances, interest income , return on assets, NPAs etc.The study concluded that after merger there is an improvement in all parameters of the bank.
However, there is slight published empirical literature on the impact of M&As on banks in India. This study is a preliminary attempt to fill this research gap .Therefore, the objective of the study is to critically analyze and evaluate the impact of merger of Nedungadi bank with Punjab National Bank on their operating performance in terms of different financial parameters. The results have been obtained analyzing the data five years before and after the merger took place. The study has further attempted to investigate and test whether there exist any significant deviations in the results achieved by the banks after merger.
3. Brief Profile of Punjab National Bank and Nedungadi bank: 3.1. Profile of Pubjab National Bank:
Pubjab National Bank, India’s first Swadesi Bank, commenced its operation ON April,12,1895 from Lahore with an authorized capital of Rs 2,00,000 and working capital of Rs 20,000. During the long history of over 121 years of the bank, 7 banks have merged with PNB and it has become stronger and stronger with a network of 6690 branches and 94636 ATMs as on 31 st March,2016. Today, the bank stands tall amongst nationalized banks in major financial parameters like Global Business, Domestic Business, Domestic Deposits, Domestic Advances, CASA Deposits, Savings Deposits and Operating Profit.The performance highlights of banks in terms of business and profit are shown below:
Table:1 : Profile of Pubjab National Bank Parameter(Rs in
crores)
Mar’,2011 Mar’,2012 Mar’,2013 Mar’,2014 Mar’,2015 Mar’,2016 YoY Growth Deposits 3,12,889 379588 391560 451397 501379 553051 10.3 Advances 2,42,107 293775 308796 349269 380534 412326 8.4 Total Business 5,54,996 673363 700356 800666 881913 965377 9.5 Operating Profit 9,056 10614 10907 11384 11955 12216 2.2 Net Profit 4,433 4884 4748 3343 3062 -3974 - Source:wwwpnbindia.in
During financial year,2016, the bank has crossed several landmarks i.e Rs 9.65 lakh crore global business,Rs 8.5 lakh crore domestic business,Rs 5.5 lakh crore global deposits,Rs 4 lakh crore net advances, Rs 2 lakh crore CASA deposits and Rs 12000 crore operating profit.
On liability side,with continuous focus on the low cost deposits, the bank has achieved the milestone of Rs 200000 crores during FY,2016. CASA deposit grew by 11.9% on YoY basis as on 31st March,2016.This growth was supported by Saving deposits which reached Rs 1.69 lakh crore (YoY growth 12.8%) and current deposits which touched Rs 36157 crore(YoY growth 7.7%).Within advances, the share of small ticket advances,
i.e retail, agriculture and MSME to Domestic Non-food credit increased from 55.6% in March,2015 to 56% in March,2016.
In terms of bottom line parameters, the bank’s operating profit at Rs 12216 crore during financial year,2016 stood highest among nationalized banks. In fact, PNB is the only bank amongst nationalized banks to have operating profit over Rs 10000 crore for consecutive five years.However, the increased provisioning requirement for NPAs resulted into net loss of Rs 3974 crore in FY,2016 as compared to net profit of Rs 3062 crore in FY,2015.
In terms of key financial ratios, the bank’s domestic net interest margin at 2.95% during FY,2016 was one of the highest among nationalized banks. Due to reduction in bulk deposits,cost of deposits moved downward from 6.09% in FY,2015 to 5.85% in FY,2016.Further, the cost to income ratio also improved from 46.74% in FY,2015 to 44.94% in FY,2016.The bank has been able to maintain its capital adequacy ratio above the regulatory requirement.The bank’s CRAR stood at 11.28% which constituted Tier-1 ratio of 8.41% and Tier –II ratio of 2.87%.The bank’s gross NPA and net NPA ratio stood at 12.9% and 8.61% respectively.
3.2. Profile of Nedungadi bank:
Rao Bahadur T.M. (Thalakodi Madathil) Appu Nedungadi established Nedungadi Bank in 1899 at Calicut in Kerala. It was first private sector commercial bank to be set up in South India. The bank was incorporated in 1913. In 1964 it acquired the Cochin National Bank in Trichur, and then the year after Nedungadi took over selected assets and liabilities of the Coimbatore National Bank (est. 25 January 1933). Cochin National Bank had three offices and Coimbatore National Bank had only one.Over time, Nedungadi established some 174 branches, including branches at all major metropolitan cities such as New Delhi, Calcutta, Chennai, Mumbai, Ahmedabad, etc.
Established in 1899 as a private sector bank in Calicut, NBL has been rendering financial assistance in a large way to small industries, peasants and traders since its inception. When the Reserve Bank of India Act, 1934 came into force, NBL was included in the Second Schedule.The bank traditionally focuses on the retail segment. It has introduced several schemes to meet the requirements of this segment. The schemes introduced by the bank are Shatabdi Suraksha Savings, Shatabdi Suraksha Current, Mahila Soubhagya (for resident Indian women) and Aiswarya deposit. Earlier, the bank engaged a renowned management consultancy firm, Pricewaterhouse Coopers, for framing a strategy and business planning programme for five years, aiming at redefining the bank's vision to incorporate the changing dynamics of the environment and to enable it to take a leadership position. The bank planned to increase its non-fund based income and income through treasury operations.Nedungadi Bank, which has 175 branches and 1,619 employees, reported a net loss of 678 million in the year ended March 31, 2001.
The country's central bank had placed Nedungadi Bank under a moratorium last year on charges that the new generation private bank had allegedly violated central bank norms while lending to stockbrokers.
Under the RBI moratorium, which will remain effective till February 1, 2003, depositors of Nedungadi Bank are restricted from withdrawing more than 5,000. For the third quarter ended 31 December 2002, NBL registered a 66.2% fall in net profit to Rs 2.02 crore, compared to Rs 5.98 crore in the corresponding period last year. Total income decreased by 19% to Rs 41.66 crore, from Rs 51.38 crore in DQ 2001. In 2002 the Joint Parliamentary Committee (JPC) probing a stock scam pointed out discrepancies in the conduct of business by Nedungadi Bank. In 2003 Punjab National Bank took it over. At the time of the merger with PNB, Nedungadi Bank's shares had zero value, with the result that its shareholders received no payment for their shares.
4. Methodology: 4.1. Collection of data:
The secondary data which has been collected was subjected to descriptive and inferential analysis. The financial and accounting data of banks has been mainly collected from banks’ Annual Report of several years to evaluate the impact of M&As on the performance of said banks. Financial data has also been collected from
www.moneycontrol.com for the study.
4.2. Method of Analysis:
For attaining the result, pre and post merger performance have been compared. The pre and post merger financial performance have been achieved in terms of Investment- Deposit Ratio, Priority sector advance as % to total advance, Deposit per employee, Advance per employee, Interest income as a % of total income, Non-interest income as a % of total income, Interest expenses as a % of total expenses, Establishment expenses as a % of total expenses, Other operating expenses as a % of total expenses, Spread as a % to Assets, Interest Income as % to average working funds, Non-interest Income as % to average working funds, Operating profit as % to average working funds, Return on Asset, Net NPA as % to net advances, Capita Adequacy Ratio [CAR(%) etc. This study has also attempted to test the hypotheses relating to the impact of M&A on the various performance
parameters and thus derive a conclusion about whether the event of M&A has made a positive impact on the performance of these banks-Punjab National Bank and Nedungadi bank . The software SPSS 20.0 , E.Views and MS Excel were used to compute and analyze the data.The ratios for each of the performance parameters were estimated for the above mentioned merger individually. Thereafter, we compared means of the performance parameter over time i.e. before the merger vs after the merger.
4.3Financial ratio used:
(i) Credit -Deposit Ratio=Total Advance/Total Deposit X 100
(ii) Investment- Deposit Ratio: Total Investment / Total Deposit X 100
(iii) Priority sector advance as % to total advance: Priority sector advance / Total Advance X 100 (iv) Deposit per employee: Total Deposit / no of employees X 100
(v) Advance per employee: Total Advance / no of employee X 100
(vi) Interest income as a % of total income: Interest earned / Total income X 100
(vii) Non-interest income as a % of total income: Non-interest earned / Total income X 100 (viii) Interest expenses as a % of total expenses= Total interest expended / Total expenditure (ix) Establishment expenses as a % of total expenses = Establishment expense / Total expenditure (x) Other operating expenses as a % of total expenses = Other operating expenses / Total expenditure (xi) Spread as a % to Assets =spread ( i.e.interest income minus interest expenses)/ Total assets (xii) Interest Income as % to average working funds =Interest earned/Average working fund(AWF)
(xiii) Non-interest Income as % to average working funds=Non-interest earned/ Average working fund(AWF) (xiv) Operating profit as % to average working funds= Operating profit/ Average working fund(AWF) (xv) Return on Asset(ROA)= Net profit/ Average assets
(xvi) Net NPA as % to net advances= Net NPA/ Net advances (xvii) CAR(%)=Tier-I Capital(%)+Tier-II Capital(%)
4.4. Hypotheses for testing the significant difference between Pre and Post merger financial indicators: Hypotheses have been formulated for testing the significant difference between Pre and Post merger financial indicators which have been depicted below:
H0 (Null Hypothesis): There is no significance difference between the pre and post merger financial indicators
like Investment- Deposit Ratio, Priority sector advance as % to total advance, Deposit per employee, Advance per employee, Interest income as a % of total income, Non-interest income as a % of total income, Interest expenses as a % of total expenses, Establishment expenses as a % of total expenses, Other operating expenses as a % of total expenses, Spread as a % to Assets, Interest Income as % to average working funds, Non-interest Income as % to average working funds, Operating profit as % to average working funds, Return on Asset, Net NPA as % to net advances, Capita Adequacy Ratio [CAR(%) etc.
H1 (Alternative Hypothesis): There is significance difference between the pre and post merger financial
indicators like Investment- Deposit Ratio, Priority sector advance as % to total advance, Deposit per employee, Advance per employee, Interest income as a % of total income, Non-interest income as a % of total income, Interest expenses as a % of total expenses, Establishment expenses as a % of total expenses, Other operating expenses as a % of total expenses, Spread as a % to Assets, Interest Income as % to average working funds, Non-interest Income as % to average working funds, Operating profit as % to average working funds, Return on Asset, Net NPA as % to net advances, Capita Adequacy Ratio [CAR(%) etc.
4.5. Key Variables under consideration for conducting regression analysis:
Dependent variable for the purpose of study is Return on Assets of banks. Bank profitability can be measured through various factors; return on assets (ROA) is one of the important measures (Paul Kupiec and Yan Lee, 2012). This ratio is connected with bank profit and the total assets. Return on assets is an indicator of how profitable a company is relative to its total assets. It gives an idea of the efficiency of the management in using its assets to generate earnings. The higher ratio indicates that the management is efficiently utilizing its assets. This ratio is calculated by profit before tax to total assets of the bank and it is expressed as a percentage. The Return on Assets is defined by the following formula. Return on Assets Ratio = Profit before Tax/ Total Assets X 100. This ratio indicates how many rupees of earnings the bank derive from each rupee of assets they control. Spread as a percentage of assets, Credit deposit ratio, investment deposit ratio, Capital adequacy ratio, operating expenses, provision for contingencies, net NPA as a percentage of net advances and non interest income of banks have been taken as independent variables.
1. Spread Ratio (STA) (Spread/Total Assets): Spread is the difference between interest earned and interest paid. The ratio is calculated as a percentage spread to total assets. The higher the ratio, the more will be the profitability.
depositor's money which helps banks to earn higher return on their assets. A high CDR indicates two things, firstly, the bank is issuing out more of its deposits in the form of interest bearing loans; secondly, the bank generates more income. Here the problem is failure in repayment of loan, in such a case, the banks are liable to repay the deposit money to their customers, therefore, too high ratio puts the bank at high risk. Alternatively, a very low ratio means bank is at low risk, at the same time, it is not using assets to generate income.
3. Capital Adequacy Ratio (CAR) (Capital/Risk weighted assets): In the adoption of risk management strategies by a bank, the ratio determines the cushion available to a bank against the credit risk, operational risk and market risk.
4. Operating Expense (OOETE) Ratio (Operating Expenses/Total expenses): The ratio has a negative relationship with profitability, and a high OE ratio highlights operational inefficiency of a bank.
5. Non-Interest Income (NIITI): (Non interest income /total assets) Non interest income refers to the Income of a bank from its allied and non-banking activities. Banks should aim to increase their non interest income to enhance their return on assets.
6. Net Non-Performing Asset (NNPANA) ratio (NNPA/Net Total assets): The ratio bears a negative relationship with profitability as it indicates the credit risk of a bank.
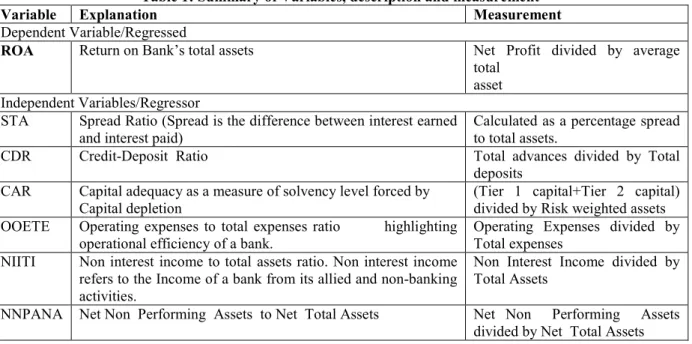
Table 1: Summary of Variables, description and measurement
Variable Explanation Measurement
Dependent Variable/Regressed
ROA Return on Bank’s total assets Net Profit divided by average total
asset Independent Variables/Regressor
STA Spread Ratio (Spread is the difference between interest earned and interest paid)
Calculated as a percentage spread to total assets.
CDR Credit-Deposit Ratio Total advances divided by Total
deposits CAR Capital adequacy as a measure of solvency level forced by
Capital depletion
(Tier 1 capital+Tier 2 capital) divided by Risk weighted assets OOETE Operating expenses to total expenses ratio highlighting
operational efficiency of a bank.
Operating Expenses divided by Total expenses
NIITI Non interest income to total assets ratio. Non interest income refers to the Income of a bank from its allied and non-banking activities.
Non Interest Income divided by Total Assets
NNPANA Net Non Performing Assets to Net Total Assets Net Non Performing Assets divided by Net Total Assets 4.6. Hypotheses for conducting regression analysis:
The present study attempts to test a number of hypotheses which as below:
H1: There is a positive relationship between spread as a % of total assets (STA) and ROA in post merger period. H2: There is a positive relationship between credit deposit ratio(CDR) and ROA in post merger period.
H3: There is a positive relationship between capital adequacy ratio (CAR) and ROA in post merger period. H4: There is a negative relationship between other Operating expenses as a percentage of total expenses and ROA in post merger period.
H5: There is a negative relationship between Net NPA as a % of net assets and ROA in post merger period. H6: There is positive relationship between Non interest income as a percentage of total interest and ROA in post merger period.
4.7.Ordinary least square method:
We framed a regression equation to assess the impact of various predictors on the RoA of the public sector bank in our study namely Punjab national bank as under. We have taken following six independent variables into our regression analysis because these variables are free from multicollinearity.
Y = α + β1X1+ β2X2+ β3X3+ β4X4+ β5X5+ β6X6+ ε Where,
Y = Return on Assets (RoA) X1= Spread Ratio (STA) X2 = Credit-Deposit Ratio(CDR) X3 = Capital Adequacy Ratio (CAR)
X5= Non-Performing Asset to Net Assets Ratio (NNPANA) X 6= Non-Interest Income to Total Interest Ratio (NIITI)
εt represents the “noise” or error term; α and βi represent the slope and coefficient of regression. The coefficient of regression, β indicates how a unit change in the independent variables [ in our study, Spread Ratio (STA), Credit-Deposit Ratio(CDR), Capital Adequacy Ratio (CAR), Operating Expense to Total Expenses (OOETE), Non-Performing Asset to Net Assets Ratio (NNPANA), Non-Interest Income to Total Interest Ratio (NIITI) etc] affects the dependent variable [Return on Assets (RoA)]. The error, εt, is incorporated in the equation to cater for other factors that may influence Return on Assets(RoA). The validity or strength of the Ordinary Least Squares method depends on the accuracy of assumptions. In this study, the Gauss-Markov assumptions are used and they include that the dependent and independent variables are linearly co-related, the estimators (α, β) are unbiased with an expected value of zero i.e., E (εt) = 0, which implies that on average the errors cancel out each other. The procedure involves specifying the dependent and independent variables. But it depends on the assumptions that the results of the methods can be adversely affected by outliers.
Backward multiple regression analysis was used to analyze the impact of determinants on the ROA of public sector banks. Therefore, Multiple regression will be conducted through SPSS package using Ordinary Least Square (OLS) Estimation Method to test the set of hypotheses or more clearly to test how the independent variables explain the Return on Assets (RoA). Before running the regression, investigation into the multicollinearity problem was carried out using the pairwise correlation matrix. First of all, bivariate (pair-wise) correlations among the independent variables were examined to find out the multicollinearity problem. The existence of correlation of about 0.90 or larger indicates that there is problem of multicollinearity.
When independent variables are highly correlated in a multiple regression analysis, it is difficult to identify the unique contribution of each variable in predicting the dependent variable because the highly correlated variables are predicting the same variance in the dependent variable. Some statisticians says correlations above 0.70 indicate multicollinearity and others say that correlations above 0.90 indicate multicollinearity. Multicollinearity is assessed by examining tolerance and the Variance Inflation Factor (VIF) which are two collinearity diagnostic factors that can help to identify multicollinearity. If a low tolerance value is accompanied by large standard errors and no significance, multicollinearity may be an issue. The variable’s tolerance is indicated by 1-R2. A small tolerance value indicates that the variable under consideration is almost a perfect linear combination of the independent variables already in the equation and that it should not be added to the regression equation. The Variance Inflation Factor (VIF) measures the impact of collinearity among the variables in a regression model. The Variance Inflation Factor (VIF) is 1/Tolerance, it is always greater than or equal to 1. There is no formal VIF value for determining presence of multicollinearity. A commonly given rule of thumb is that multicollinearity exists when Tolerance is below 0.1 and values of VIF that exceed 10 are often regarded as indicating multicollinearity. When those R2 and VIF values are high for any of the variables in regression model, multicollinearity is probably an issue.
5. Analysis of results:
The results suggest that the performance of banks has been improved in terms of Credit -Deposit Ratio, Investment- Deposit Ratio, Priority sector advance as % to total advance, Interest income as a % of total income, Operating profit as % to average working funds, Capita Adequacy Ratio , Establishment expenses as a % of total expenses, Other operating expenses as a % of total expenses but Regarding Non-interest income as a % of total income, Interest Income as % to average working funds, Non-interest Income as % to average working funds, Return on Asset, Deposit per employee, Advance per employee, Interest expenses as a % of total expenses, Net NPA as % to net advances ,these ratios show negative trend in post merger period.
Table 1:- Mean and Standard Deviation of Pre-merger and Post-merger Ratios of combined (Nedungadi Bank Ltd and Punjab national bank ) and Acquiring Bank (Punjab national bank)[considering two year pre and post]
Mean Mean
Difference
Change in ratios
Std.Deviation Credit -Deposit Ratio Pre-merger
Post-merger
51.40 1.988 I* 3.065
53.39 0.467
Investment- Deposit Ratio 41.45 4.955 I* 1.556
46.405 2.143
Priority sector advance as % to total advance
35.85 6.035 I* 0.396
41.885 2.864
Deposit per employee 247.25 108.26 D** 9.461
138.98 14.764
Advance per employee 127.78 53.54 D** 11.745
74.235 8.521 Interest income as a % of total income 82.59 0.585 I* 6.413 83.17 3.564 Non-interest income as a % of total income 17.42 0.585 D** 6.413 16.83 3.564 Interest expenses as a % of total expenses Pre-merger Post-merger 61.46 9.503 D** 2.507 51.96 4.653 Establishment expenses as a % of total expenses Pre-merger Post-merger 16.83 2.208 I* 1.128 19.035 0.474
Other operating expenses as a % of total expenses Pre-merger Post-merger 6.57 1.310 I* 0.382 7.875 0.728
Spread as a % to Assets Pre-merger Post-merger 1.93 1.655 I* 0.156 3.58 0.057 Interest Income as % to average working funds
Pre-merger Post-merger 9.52 0.783 D** 0.421 8.74 0.693 Non-interest Income as % to average working funds
Pre-merger Post-merger 2.13 0.243 D** 0.951 1.885 0.346 Operating profit as % to average working funds
Pre-merger Post-merger 1.51 2.040 I* 0.976 3.545 0.375
Return on Asset Pre-merger Post-merger
1.29 0.183 D** 1.213
1.11 0.099
Net NPA as % to net advances
Pre-merger Post-merger
16.04 13.618 D** 3.037
2.42 2.036
Capita Adequacy Ratio [CAR(%)]
Pre-merger Post-merger
6.22 6.345 I* 0.184
12.56 0.764
*I stands for Increase **D stands for Decrease
Source: Author’s own estimate using e.views.
While considering the case of Nadungadi Bank and Punjab National Bank merger, regarding Credit -Deposit Ratio, Investment- -Deposit Ratio, Priority sector advance as % to total advance, Interest income as a % of total income, Operating profit as % to average working funds, Capita Adequacy Ratio , Establishment expenses as a % of total expenses, Other operating expenses as a % of total expenses, Spread as a % to Assets , null hypotheses are rejected which lead us to conclude that there are significant differences between pre and post merger above mentioned financial indicators.
Regarding Non-interest income as a % of total income, Interest Income as % to average working funds, Non-interest Income as % to average working funds, Return on Asset, Deposit per employee, Advance per employee, Interest expenses as a % of total expenses, Net NPA as % to net advances, null hypotheses are rejected signifying that there are significant differences between pre and post merger above mentioned financial indicators.
Table 2 presents the pair wise correlation matrix for the variables used in our estimation. Prior to estimation, we examined the correlation among independent variables and we find that different independent variables are weakly correlated with each other. None of the pairwise coefficient of correlation was 0.90 or larger.
Table 2:- CORRELATION MATRIX AMONG INDEPENDENT VARIABLES
STA CDR CAR OOETE NNPANA NIITI
STA 1.000000 -0.631318 -0.116604 0.430527 0.038435 0.502426 CDR -0.631318 1.000000 0.284663 -0.397160 -0.430105 -0.561243 CAR -0.116604 0.284663 1.000000 0.423846 -0.804324 0.513715 OOETE 0.430527 -0.397160 0.423846 1.000000 -0.531193 0.584864 NNPANA 0.038435 -0.430105 -0.804324 -0.531193 1.000000 -0.286149 NIITI 0.502426 -0.561243 0.513715 0.584864 -0.286149 1.000000 Source: Author’s own estimate using e.views .
From our analysis to test whether there exist multicolinearity, it is found that correlations among independent variables are moderate which do not exceed the general rule of thumb. Moreover tolerance for these variables are moderately high which also are beyond the specified minimum ceiling (0.10) and VIFs do not exceed the specified rule of thumb of10. This indicates that multicolinearity is not an issue of concern in this study.
In both pre and post merger period, explanatory power of the models as indicated by R2 (multiple coefficient of determination) and adjusted R2 is fairly good. The model explains around 77% of the variation in the dependent variable/ROA. The Durbin-Watson statistic (D-W Statistic) being nearly 2 (1.873) suggests that there is no auto-correlation among residuals.
Table 3:- Model Summary (Both pre&post merger period) Model Summaryb Model R R Square Adjusted R Square Std. Error of the Estimate Durbin-Watson 1 .878a .772 .600 .16945 1.873
a. Predictors: (Constant), NIITI, NNPANA, STA, OOETE, CAR, CDR b. Dependent Variable: ROA
c. Both pre&post merger period
Source: Author’s own estimate using SPSS .
Table 4:- Model Summary (Post merger period) Model Summaryb Model R R Square Adjusted R Square Std. Error of the Estimate Durbin-Watson 1 .934a .873 .746 .1315 1.592
a. Predictors: (Constant), NIITIpost, NNPANApost, STApost, OOETEpost, CARpost, CDRpost b. Dependent Variable: ROApost
c. Post merger period
Source: Author’s own estimate using SPSS .
In post merger period, explanatory power of the models as indicated by R2 (multiple coefficient of determination) and adjusted R2 is fairly good. The model explains around 87% of the variation in the dependent variable/ROA. The Durbin-Watson statistic (D-W Statistic) being nearly 2 (1.592) suggests that there is no auto-correlation among residuals.
Due to paucity of data, for proper understanding of impact of merger, we fail to conduct regression analysis in pre-merger and post- merger period separately, Instead, for better understanding of the impact of merger, we have conducted regression for entire period (taking both pre and post merger period) and separately for post merger period.
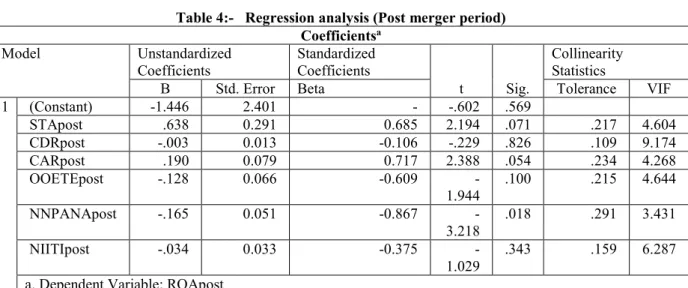
Table 4:- Regression analysis (Post merger period) Coefficientsa Model Unstandardized Coefficients Standardized Coefficients t Sig. Collinearity Statistics
B Std. Error Beta Tolerance VIF
1 (Constant) -1.446 2.401 - -.602 .569 STApost .638 0.291 0.685 2.194 .071 .217 4.604 CDRpost -.003 0.013 -0.106 -.229 .826 .109 9.174 CARpost .190 0.079 0.717 2.388 .054 .234 4.268 OOETEpost -.128 0.066 -0.609 -1.944 .100 .215 4.644 NNPANApost -.165 0.051 -0.867 -3.218 .018 .291 3.431 NIITIpost -.034 0.033 -0.375 -1.029 .343 .159 6.287 a. Dependent Variable: ROApost
Source: Author’s own estimate using SPSS .
Table 4 shows the summary results for regression analysis (considering ROA as dependent variable) in the post merger period. The parameter estimates in table 4 reveal that out of six independent variables, four variables (STA, CAR, OOETE and NNPANA are found to have statistically significant impact on ROA at 5% level respectively. Result shows that STA and CAR have significant positive impact on ROA which is theoretically true and sound. Theoretical research predicts positive relationship between STA and ROA, CAR and ROA, negative relation between OOETE and ROA, NNPANA and ROA. Result also suggests that NNPANA has significant negative impact on ROA at 5% level and OOETE has also significant negative impact on ROA at 10 %level which are also theoretically true. There are also negative non significant impact of CDR and NIITI on ROA.
In brief, results in post merger period are grouped into three categories: positive significant impact of STA and CAR on ROA, negative significant impact of OOETE and NNPANA on ROA and negative insignificant impact of CDR and NIITI on ROA.
Table 5:- Regression analysis (Both pre&post merger period) Coefficientsa Model Unstandardized Coefficients Standardized Coefficients t Sig. Collinearity Statistics B Std.
Error Beta Tolerance VIF
1 (Constant) 2.906 2.234 - 1.301 .229 STA .092 .261 .685 .354 .733 .446 2.243 CDR -.023 .013 -.106 -1.744 .119 .100 9.993 CAR .110 .092 .717 1.194 .267 .160 6.261 OOETE -.161 .083 -.609 -1.936 .089 .212 4.726 NNPANA -.160 .066 -.867 -2.438 .041 .112 8.939 NIITI -.033 .042 -.375 -.789 .453 .162 6.179
a. Dependent Variable: ROA
Source: Author’s own estimate using SPSS .
Table 5 shows the summary results for regression analysis (considering ROA as dependent variable) in both the pre and post merger period taken together. The parameter estimates in table 7 reveal that out of six independent variables, three variables (CDR, OOETE and NNPANA are found to have statistically significant negative impact on ROA at 10% and 5% level respectively. Theoretical research predicts positive relationship between CDR and ROA, negative relation between OOETE and ROA, NNPANA and ROA.
In our study, negative impact of CDR on ROA may probably be due to the fact that the bank is issuing out more of its deposits in the form of interest bearing loans but the problem is failure in repayment of loan on the part of the customer which made the banks liable to repay the deposit money to their customers resulting in reduction of profitability (ROA). There are also positive non significant impact of STA and CAR on ROA.
In brief, results in both pre and post merger period taken together are grouped into three categories: negative significant impact of CDR, NNPANA and NIITI on ROA, negative insignificant impact of NIITI on ROA and positive insignificant impact of STA and CAR on ROA.
6. Findings and Conclusion
no significance difference between the pre and post merger financial indicators .The results suggest that the performance of banks has been improved in terms of credit -deposit Ratio, investment- deposit ratio, priority sector advance as % to total advance, interest income as a % of total income, operating profit as % to average working funds, capital adequacy ratio , establishment expenses as a % of total expenses, other operating expenses as a % of total expenses but regarding non-interest income as a % of total income, interest income as % to average working funds, non-interest Income as % to average working funds, return on asset, deposit per employee, advance per employee, interest expenses as a % of total expenses, net NPA as % to net advances ,these ratios show negative trend in post merger period.
In a nut shell, post merger regression analysis suggests that impact of various performance parameters (treated as independent variables) on profitability (ROA) parameter have improved much in comparison with regression analysis of entire study period (both pre and post merger). It can be inferred from the regression analysis that merger of Nedungadi bank with PNB has significant impact on profitability performance of the Bidder Bank (PNB).
The above mentioned findings depict that the consolidation through merger deal seems to be successful in achieving the efficiency gains in Indian public sector banking industry. In the light of the present empirical findings, the future reforms in the banking sector should be directed towards strengthening competitive and market-oriented policies.
References
Aharon David Y, Gavious Ilanit & Yosefa Rami (2010), “Stock Market Bubble Effects on Mergers and Acquisitions”, The Quarterly Review Of Economics and Finance, vol.50, 456–470.
Anand Manoj & Singh Jagandeep (2008), Impact of merger announcement on shareholders wealth:Evidence from Indian Private sector banks, Vikalpa: Journal for Decision maker,vol.33(1), pp.35-54.
Bakker, HJC and Helmink,JWA(2004),Successfully Integrating Two Businesses,Gowar Publishing, Humpshire. Bruner,R.F(2004),Applied mergers and acquisitions,John Wiley and Sons Inc,New Jersey.
Panwar, S. (2011), Mergers & Acquisitions in Banking Industry – The Need of Hour,International Journal of Contemporary Practices, vol.1(2), p. 75-82.
Paul Kupiec and Yan Lee., 2012, What Factors Explain Differences in Return on Assets Among Community Banks? Federal Deposit Insurance Corporation, Proceedings of the Third International Conference on Global Business, Economics, Finance and Social Sciences (GB14Mumbai Conference) Mumbai, India. 19-21 December 2014 ISBN: 978-1-941505-21-2 Paper-ID:MF49812,www.globalbizresearch.org. Shanmugam, B. & Nair, M. (2004), Mergers & Acquisitions of Banks in Malaysia, Managerial Finance,vol. (4)
p. 1-18.
DeLong, G.L. (2003). Does Long Term Performance of Mergers Match Market Expectations? Evidence from the US Banking Industry, Financial Management, p. 5-25.
DePamphilis,D.M( 2005),Mergers, Acquisitions and other restructuring activities, 4th Edition, Elsevier.Inc. London.
Devos, E., Kadapakkam, P.R., & Krishnamurthy, S. (2008), How Do Mergers Create Value? A Comparison of Taxes, Market Power, and Efficiency Improvements and Explanations for Synergies. The Review of Financial Studies,vol.22(3), March 27, 2008.
Kuriakose Sony ,M.S Senam Raju, N.V.Narasimham(2009), Voluntary Amalgamations in Indian Banking Sector: Valuation Practices and Adequacy of Swap ratios,Electronic copy available at: http// issn.com/abastract=1653698.
Mantravadi Pramod & Reddy, A Vidyadhar (2007),Mergers and operating performance: Indian experience,The ICFAI Journal of mergers and Acquisitions,vol.4,no.4,pp52-66.
Mehta Jay & Kakani Ram Kumar(2006), “Motives for Mergers and Acquisitions in the Indian Banking Sector – A Note on Opportunities & Imperatives”, SPJCM Working Paper: 06- 13, Retrieved From Http://Papers.Ssrn.Com/Sol3/Papers.Cfm?Abstract_Id=1008717.
Murthy,G.K(2007), Some cases of Bank merger in India : A study .In Bose,J(Ed), Bank Mergers: The Indian Scenario,(244-259), Hyderabad: The ICFAI University Press.
Müslümov Alövsat. (2002), “The Financial Analysis of Post merger Performance of Surviving Firms”, Yapi Kredi Economic Review, Vol. 13(1), Retrieved from Http://Papers.Ssrn.Com/Sol3/Papers.Cfm?Abstract_Id=890063.
Sinha Pankaj & Gupta Sushant (2011),Mergers and Acquisitions: A pre and post analysis for the Indian financial services sector, MPRA Paper 31253,Online at: http://mpra.ub.uni-muenchen.de/31253.
Suresh Kumar(2013), Impact of Bank Mergers on the Efficiency of Banks: A study of merger of Bharat Overseas Bank with Indian Overseas Bank, International Journal of Academic Research in Business and Social Sciences December 2013, Vol. 3, No. 12 ISSN: 2222-6990.
V.Radha Naga Sai and Dr.Syed Tabassum Sultan (2013) “Financial performance analysis in Banking sector- A Pre & Post Merger perspective” ABHINAN Vol,2,April 2013,ISSN 2320-0073 (pp56-66).
Saraswathi,K.V(2007),Crucial HR Management issues in Bank Consolidation: Some cases, .In Bose,J(Ed), Bank Mergers: The Indian Scenario,(226-243), Hyderabad
![Table 1:- Mean and Standard Deviation of Pre-merger and Post-merger Ratios of combined (Nedungadi Bank Ltd and Punjab national bank ) and Acquiring Bank (Punjab national bank)[considering two year pre and post]](https://thumb-us.123doks.com/thumbv2/123dok_us/1258493.2669316/8.892.100.799.176.846/standard-deviation-combined-nedungadi-national-acquiring-national-considering.webp)