Theses & Dissertations Boston University Theses & Dissertations
2017
Common ownership, firm financial
policy and product market strategy
https://hdl.handle.net/2144/27342GRADUATE SCHOOL OF ARTS AND SCIENCES
Dissertation
COMMON OWNERSHIP, FIRM FINANCIAL POLICY
AND PRODUCT MARKET STRATEGY
by
SVETOSLAV SEMOV
B.A., Gettysburg College, 2011
M.A., Boston University, 2014
Submitted in partial fulfillment of the
requirements for the degree of
Doctor of Philosophy
2017
I am grateful for the help and support of my advisers, family and friends.
I would like to thank Stephen J. Terry, Evgeny Lyandres and Berardino Palazzo for their patience, advice and encouragement. I am grateful to Stephen for his support during the job market and for his constant willingness to listen and look for ways to help me improve my arguments and presentation. I am grateful to Evgeny and Dino for their help on a topic close to their own research. Evgeny helped me immensely when I first got interested in corporate finance. Dino has been very patient and always willing to look at the details to help me get to the bottom of things.
I would also like to thank Randy Ellis, Gloria and Andy Campolieto for their help during the application stage of the job market. Randy was always extremely reassuring, imparting on all job market candidates the wisdom of years of advising BU graduates. Gloria helped me with sending out all my job applications and Andy Campolieto made sure I did not miss any deadlines.
In addition, I would also like to thank all my friends from the program - Matt K, Francois, Will, Calvin, Peter, Talal, Matt J, Crystal, Joyce and many others -who shared this experience with me. We had some fun moments and some tough moments. I am grateful for both of them.
Additionally, I would like to thank Charles Weise and Bela Bajnok. They inspired me to apply for a PhD in economics in the first place. The first time I realized I want to go that route was while I was listening to Char explain his research on the origins of the Great Inflation. My first steps in research were in Bela’s abstract algebra research classes and I am extremely grateful for the experience they gave me.
Last but not least, I would like to thank my parents for their unconditional sup-port. I would not have been able to get to this point without their constant encour-agement and support.
AND PRODUCT MARKET STRATEGY
SVETOSLAV SEMOV
Boston University, Graduate School of Arts and Sciences, 2017
Major Professor: Stephen J. Terry, Assistant Professor of Economics
ABSTRACT
This dissertation consists of three essays which examine the importance of common institutional ownership of industry rivals for firm financial policy and product market interactions.
In the first chapter, I use data on all public firms in the U.S. and their owners to construct a ”modified Herfindahl-Hirschman index” (MHHID) of market concentra-tion that is firm-specific and based on the network of instituconcentra-tional ownership between rival firms. I find that increases in MHHID lead to lower firm cash holdings. My find-ings are consistent with theories which predict that firms facing a lower competitive threat can a↵ord to maintain lower cash bu↵ers. To address potential endogeneity concerns, I exploit a shock to common ownership stemming from outflows associated with a large mutual fund scandal in 2003.
In the second chapter, I provide evidence showing that firm pairwise common ownership leads to an increase in rival coordination. I find that pairs of commonly held firms move closer together in product space. These findings are supportive of collaboration theories of common ownership and inconsistent with anti-competitive theories. I further show that when MMHID increases, firms di↵erentiate their prod-ucts from their rivals. This result is consistent with theories according to which lower
competition theories of product di↵erentiation. To address potential endogeneity concerns, I exploit exogenous outflows resulting from the 2003 mutual fund scandal. In the third chapter, I propose a new identification strategy, which can be used to study the e↵ects of MHHID. My strategy has substantially better time-series and cross-sectional coverage relative to previously used instruments. Specifically, I first identify mutual funds that are exposed to under-performing industries and are likely to face outflows. Then, I calculate the proportion of the MHHID such exposed funds are responsible for in una↵ected industries. I show that this ratio strongly predicts future changes in MHHID, cash holdings and product market di↵erentiation. Building on the same strategy, I also find that commonly held firms move closer together in product space.
1 Common Ownership, Competition and Firm Financial Policy 1
1.1 Introduction . . . 1
1.2 Hypothesis Development . . . 8
1.3 Data and Empirical Strategy . . . 10
1.3.1 Data . . . 10
1.3.2 Variable Construction . . . 11
1.3.3 Summary statistics . . . 15
1.3.4 Baseline empirical specifications . . . 18
1.3.5 Identification strategy: The 2003 Mutual Fund Scandal . . . . 20
1.4 Empirical Results . . . 23
1.4.1 Cash Holdings and MHHI . . . 23
1.4.2 Cash Holdings and MHHI: Robustness . . . 25
1.4.3 Firm-Level Instrumental Variable Strategy: The 2003 Mutual Fund Scandal . . . 30
1.4.4 Possible Mechanisms: Uncertainty and Constraints . . . 31
1.5 Conclusion . . . 35
2 Common Ownership and Firm Product Market Coordination 39 2.1 Introduction . . . 39
2.2 Hypothesis Development . . . 44
2.3 Data and Empirical Strategy . . . 48
2.3.1 Data . . . 48
2.3.4 Summary statistics . . . 50
2.3.5 Empirical Specification: Firm-Pair Level Analysis . . . 52
2.3.6 Empirical Specification: Firm Level Analysis . . . 53
2.4 Identification . . . 54
2.4.1 Identification: Firm-Pair Analysis . . . 54
2.4.2 Identification: Firm-Level Analysis . . . 55
2.5 Empirical Results . . . 56
2.5.1 Evidence of Product Market Coordination at the Firm-Pair Level 56 2.5.2 Pairwise Product Market Strategy in Concentrated Industries 57 2.5.3 Product Market Strategy at the Firm Level . . . 60
2.5.4 Firm-Pair Instrumental Variable Strategy: The 2003 Mutual Fund Scandal . . . 64
2.5.5 Firm-Level Instrumental Variable Strategy: The 2003 Mutual Fund Scandal . . . 68
2.6 Conclusion . . . 69
3 Common Ownership and Competition: A New Identification Strat-egy 72 3.1 Introduction . . . 72
3.2 Data and Empirical Strategy . . . 76
3.2.1 Data . . . 76
3.2.2 Summary Statistics . . . 78
3.2.3 A New Instrumental Variable Strategy . . . 78
3.3 Empirical Results . . . 81
3.3.1 Fund Flows . . . 81
3.3.4 Cash Holdings and Financial Constraints based on Hoberg and
Maksimovic (2015) . . . 89
3.3.5 Product Strategy at the Firm-Pair Level: IV results . . . 91
3.3.6 Product Strategy at the Firm Level: IV results . . . 93
3.4 Conclusion . . . 96
A Variable Description: Chapter 1 99
B Variable Description: Chapter 2 102
C Variable Description: Chapter 3 105
References 106
Curriculum Vitae 111
1.1 Descriptive Statistics . . . 16
1.2 Cash Holdings and Top Third TNIC MHHI . . . 24
1.3 Cash Holdings and TNIC MHHI . . . 27
1.4 Cash Holdings and SIC MHHI . . . 28
1.5 Cash Holdings and Top Third TNIC MHHI . . . 29
1.6 Cash Holdings and The 2003 Mutual Fund Scandal . . . 32
1.7 Cash Holdings and The 2003 Mutual Fund Scandal . . . 33
1.8 Uncertainty and The 2003 Mutual Fund Scandal . . . 37
1.9 Constraints and The 2003 Mutual Fund Scandal . . . 38
2.1 Descriptive Statistics . . . 51
2.2 Common Ownership and Product Market Behavior . . . 58
2.3 Common Ownership and Product Market Behavior: Bushee Split . . 59
2.4 Common Ownership and Product Market Behavior: HHI splits . . . . 61
2.5 Product Market Similarity and Top Third TNIC MHHI . . . 63
2.6 Product Similarity, SIC 400 MHHI and TNIC MHHI . . . 65
2.7 Common Ownership and Product Market Behavior: IV Results . . . 67
2.8 Product Similarity and The 2003 Mutual Fund Scandal . . . 70
3.1 Fund Summary Statistics . . . 79
3.2 Descriptive Statistics . . . 79
3.3 Exposed Funds and Fund Flows . . . 83
3.4 Cash Holdings and Top Third MHHI: IV Results . . . 84
3.7 Contraints and Top Third MHHI: IV Results . . . 88 3.8 Constraints and Top Third MHHI: IV Results . . . 90 3.9 Cash Holdings and Top Third MHHI: Splits on Constraints . . . 92 3.10 Common Ownership and Pairwise Product Similarity: IV Results . . 94 3.11 Product Similarity and Top Third MHHI: IV Results . . . 95 3.12 Product Similarity, Top Third MHHI and RD intensity: IV Results . 97
1·1 MHHID Top Third 0.5% - Bushee . . . 19
1·2 MHHID: TNIC Top Third, TNIC All and SIC . . . 20
2·1 CO sum - Bushee . . . 52
2·2 CO product - Bushee . . . 53
xiii
List of Abbreviations
CO ……… Common Ownership
COD ……… Common Ownership Dedicated Investors COQ ……… Common Ownership Quasi-Indexing Investors COT ……… Common Ownership Transient Investors CRSP ……… The Center for Research in Security Prices FE ……… Fixed Effects
HHI ……… Herfindahl-Hirschman Index IV ……… Instrumental Variable
MHHI ……… Modified Herfindahl-Hirschman Index MHHID ……… Modified Herfindahl-Hirschman Index Delta MHHIDD ……… MHHIDD due to Dedicated Investors
MHHIDQ ……… MHHIDD due to Quasi-Indexing Investors MHHIDT ……… MHHIDD due to Transient Investors OLS ……… Ordinary Least Squares
S & P 500 ……… Standard & Poor’s 500
SIC ……… Standard Industrial Classification
Chapter 1
Common Ownership, Competition and
Firm Financial Policy
1.1
Introduction
Despite the rapid development of financial markets numerous studies still report that credit disruptions have real e↵ects on firm investment and employment (Chodorow-Reich (2014); Schwert (2016); Chava and Purnanandam (2011)). In a world with capital market imperfections the intertemporal management of financial flexibility can help firms better withstand economic shocks. When credit is scarce, firms can benefit from their accumulated cash holdings to finance new projects, expenses and unexpected losses. In a survey of 1050 CFOs, Campello et al. (2010) find that firms which report being unconstrained maintain the same level of cash balances during the 2007-2008 financial crisis. In contrast, those which report being constrained decrease their liquid reserves by one-fifth. Understanding the determinants of financial policies is therefore of prime importance for understanding how firms respond to financial distress.
Competition has been proposed as one of the main drivers of firm financial policy (Morellec et al. (2015)). It is an important factor in determining the economic en-vironment that a firm faces. Recent work, however, shows that a crucial dimension of competition has been missing from standard measures - common ownership links between industry rivals (He and Huang (2014) and Azar et al. (2015)). Theory
pre-dicts that a common owner would push industry rivals towards monopolistic outcomes (Gordon (1990) and Salop and O’Brien (2000)). This is because such a shareholder takes into consideration the value of all other firms in its portfolio when setting firm strategy. As a result, firms that are owned to a greater extent by owners which also hold their rivals are likely to face a smaller competitive threat.
My goal in this paper is to investigate the role of common ownership in determining firm financial policy. In particular, I examine whether concentration due to common ownership a↵ects firms’ financial policies. Theories of precautionary motives of cash holdings assert that when external funds are costly firms hoard cash as an insurance against negative liquidity events (Opler et al. (1999) and Morellec et al. (2015)). A less competitive environment caused by higher common ownership decreases the probability of such adverse events and as a result firms can a↵ord to hold lower cash reserves. Similarly, a decrease in competition could decrease uncertainty about the outcomes of future projects and in turn reduce firm cash holdings (Alfaro et al. (2016)). Finally, as Alfaro et al. (2016) argue uncertainty and financial constraints can amplify each other in a↵ecting cash holdings. Concentration due to common ownership can a↵ect firm financial policy by decreasing both uncertainty and financial constraints.
Examining the e↵ects of common ownership of industry rivals on firm financial policy is especially relevant given the the dramatic recent increase in ownership con-centration in the U.S. asset management industry. In 1980, the largest 10 investors held 5 percent of the value of publicly listed companies, whereas in 2010 they held 21 percent. One potential reason for this increased consolidation is the rise of passive investment strategies following mounting evidence that the typical active manager cannot consistently beat the market’s overall performance. The rising popularity of passive investing has enabled a few prominent indexing investors to attract a sizable
portion of retail funds and pension money. In the process this has created a setting in which common ownership links between industry rivals are the norm. 1
Institutional investors have been found to exert substantial influence over the companies they hold - they can a↵ect outcomes from corporate governance to firm transparency to investment policies (Appel et al. (2016); Harford et al. (2016); Mullins (2014)). They can be especially e↵ective if they hold sizable stakes and have a long-term horizon. One specific mechanism through which they they push companies towards monopolistic outcomes is to simply make management pay dependent on rival performance (Anton et al. (2016)). Finally, passive investors, which are responsible for a big portion of the concentration due to common ownreship I study, might crowd out active investors who would push firms to compete more aggressively with each other instead of enjoying the quiet life (Bertrand and Mullainathan (2003)).
While precautionary theories of cash holdings predict that firm cash reserves go down when common ownership goes up, there are alternative theories that have the opposite predictions. First, Boot and Vladimirov (2016) argue that higher competi-tion leads firms to speed up investment in order to keep their first mover advantage. This leads to less hoarding of cash and more borrowing. As a result, by reducing com-petition common ownership leads to higher cash balances and less leverage. Second, theories of agency issues of cash holdings predict that managers prefer more free-dom from external monitoring and that they try to achieve it by relying on internal funds rather than on borrowing (Jensen (1986); Gao et al. (2013)). By reducing com-petition, common ownership can eliminate valuable market discipline and increase agency issues thereby prompting managers to increase cash holdings and decrease leverage. Third, common ownership can a↵ect firm financial structure through its e↵ect on future firm opportunities. In particular, it can lead to more possibilities
1For example, in 2010, Blackrock and Barclays were one of the top ten shareholders in about 70 percent of U.S. public firms.
for collaboration among firms that are linked (He and Huang (2014), Geng et al. (2016)). This can in turn make firms hoard cash and decrease leverage in order to have more flexibility to take advantage of better opportunities. In sum, the e↵ect of common ownership on firm financial policy is ultimately an empirical question as di↵erent theories provide opposing predictions.
In this paper, I use data on all public firms in the U.S. and their owners to construct a ”modified Herfindahl-Hirschman index” (MHHI) of market concentration which takes into account the network of institutional ownership between rival firms. The new feature of my measure is that it uses a locally defined industry around each firm to calculate firm-level market concentration (Hoberg and Phillips (2016)). 2 I find that increases in MHHI lead to lower firm cash holdings. In particular, various estimates suggest that a one standard deviation increase in the measure I use results in about 8 percent reduction in cash holdings. These magnitudes are economically meaningful and similar in size to those of previous determinants of firm financial policy that the literature has identified (Morellec et al. (2015)). The results are robust to using standard SIC industry definitions. Furthermore, they seem to be largely driven by quasi-indexing investors and dedicated investors as defined in Bushee (1998). This is important, because quasi-indexing investors are responsible for a big portion of the industry concentration due to common ownership. Furthermore, their importance has been growing over time.
In addition, I find that as MHHI increases firms’ usage of uncertainty related and constraining words in 10-K filings decreases. Hoberg and Maksimovic (2015) and Bodnaruk et al. (2015) show that textual based measures are more e↵ective in pre-dicting future adverse events than alternative measures like the age-size ratio, the KZ
2Hoberg and Phillips (2016) use textual analysis of product descriptions in firms’ 10-K filings to calculate similarity scores between pairs of firms and define firm-centric industries. In my main tests, I use the top third of the rivals defined in Hoberg and Phillips (2016). This enables me to focus on the closest rivals of a given firm. The results are robust to using the full list of rivals.
index or the Whited-Wu index. I find that a one standard deviation increase in MH-HID leads to about 1/3 standard deviation decrease in uncertainty-related words and to about 7/10 standard deviations decrease in constraining words. 3 These findings are consistent with increases in industry concentration decreasing competition and uncertainty about future project outcomes and relaxing firms’ financial constraints. These factors then enable firms to hold lower cash reserves (Morellec et al. (2015) and Alfaro et al. (2016)).
Identifying the e↵ect of common ownership on firm financial policy poses an em-pirical challenge, because active managers might have private information on future firm outcomes. They could, in theory, be willing to hold firms from the same industry only when they expect these firms to perform better in the future. To alleviate con-cerns about endogeneity, I use an exogenous schock to common ownership networks. In September 2003, 25 large mutual fund families were implicated in illegal trading practices like market timing and late trading. The investigation into these practices and the ensuing scandal led to significant capital outflows from the funds involved. Kisin (2010) estimates that the withdrawals lasted until December 2006 and that the the implicated funds lost 14% of their capital in 2004 and 21% in 2005. Families of funds involved include famous asset managers like Federated Investors, Franklin Templeton, Deutsche Bank and others. In constructing the instrument I use, I follow Anton et al. (2016) who study the e↵ect of industry concentration on executive com-pensation. In particular, I define a the ratio of total MHHI held by scandal funds at the time of the scandal and use it to predict future changes in MHHI.
This paper is related to two main strands of literature. First, it is contributes to the literature studying the determinants of firm financial policy. More specifically,
3The measures I use are based on ovarall usage of uncertain and constraining words in 10-K filings. I verify that the results hold with data from Hoberg and Maksimovic (2015), who focus on the Management’s Discussion and Analysis section of 10-Ks. The results seem driven by equity market constraints.
it adds to prior work that examines the interactions between product markets and firm financial structure. A series of papers finds that there are actual product market benefits to maintaining a more conservative financial policy as an insurance against rival threats. For example, Haushalter et al. (2007) find that firms are more likely to increase investment when industry-wide investment decreases and they hold more cash. Similarly, Fresard (2010) finds that firms with higher cash holdings experience bigger market share gains following exogenous changes to competition.
Additionally, a number of papers study whether given the advantages of more flexible financial policies firms try to adjust their financial structure in response to changes in the product market environment. Haushalter et al. (2007), Morellec et al. (2015) and Hoberg et al. (2012) use di↵erent measures of competition - standard sales based measures of concentration and changes to the similarity between a firm’s prod-uct descriptions and its rivals’ descriptions - and find that increases in the competitive environment lead to higher firm cash holdings. Parise (2016) finds that airlines in-crease their debt maturity when the probability of rival entry rises. Finally, this paper is related to the theoretical literature which studies the intertemporal adjustment of financial flexibility as an insurance against future negative events ( Morellec et al. (2015), DeAngelo and DeAngelo (2007) and DeAngelo et al. (2011)). This paper di↵ers from the above ones by focusing on a di↵erent dimension of competition - that coming from common ownership links between industry rivals.
Second, this paper adds to the literature on common ownership. There is a grow-ing number of papers examingrow-ing the e↵ects of common ownership networks in various settings: common ownership between lenders and borrowers (Cici et al. (2015), be-tween di↵erent lenders of the same firm (Chu (2015a)), between lenders of a firm and its equity holders (Chu (2015b)), between acquirers and targets (Brooks et al. (2016)). The part of this literature that is most related to the current paper focuses
on common ownership between industry rivals and how this a↵ects product market outcomes. Azar (2012) and He and Huang (2014) find a positive e↵ect of common ownership of same-industry rivals on product market performance. They argue that their results are consistent with increased product market coordination by commonly held rivals.
Similarly, Geng et al. (2016) find support for this coordination-based interpre-tation of common ownership. They examine shareholder overlap across firms with patent complementarities and find that common ownership mitigates hold-up prob-lems between firms that cite each other and leads to more innovation. Azar et al. (2015) and Azar et al. (2016) argue that the anti-competitive e↵ects of common ownership manifest themselves through pricing behavior. They examine market con-centration in the airline and banking industries respectively and find a positive impact on prices in routes/areas with higher common ownership.
Overall, I add to the literature by examining the e↵ects of common ownership for a broad set of industries. Most of the exisiting literature examining the e↵ects of concentration due to common ownership (Azar et al. (2016) and Azar et al. (2015)) focuses on narrow markets like the airline and banking industries. One potential concern with such studies is that the observed e↵ects might not generalize to the average industry, whose products are likely more heterogenous than those o↵ered by airlines and banks. An exception to this is a recent paper by He and Huang (2014), which examines how common ownership a↵ects firm performance. One di↵erence of the present paper and that of He and Huang (2014) is that I focus on a firm-level measure of concentration due to common ownership, while they focus on a binary measure of common ownership between a firm and its rivals. In addition, I focus on firm financial policies thereby linking the industrial organization literature on common ownership with the corporate finance literature on firm financial flexibility.
The paper proceeds as follows. The next section forms the empirical hypotheses. Section 3 describes the data, explains how the firm-level and firm-pair measures of common ownership I employ are constructed and details the identification strategy. Section 4 presents the baseline results and the instrumental variable results. Finally, Section 5 concludes.
1.2
Hypothesis Development
Hypothesis 1: Increases in MHHID, or industry concentration due to com-mon ownership, lead to decreases in firm cash holdings.
The hypothesis follows directly from Morellec et al. (2015) and Hoberg et al. (2012). Firms hoard cash to insure against negative liquidity events. A more com-petitive environment increases the probability of such adverse events and as a result firms hold higher cash reserves. The purpose of retaining more cash is to enable firms to react more aggressively against future competitive threats and to not have to raise costly external financing. An implicit assumption in Hypothesis 1 is that common ownership links between industry rivals decrease competition. This assumption is grounded in theory. Gordon (1990) and Salop and O’Brien (2000) predict that com-mon ownership pushes rivals towards com-monopolistic outcomes. When shareholders of a given firm hold stakes in its rivals, then they internalize the negative consequences the given firm can impose on those rivals. The assumption that competition is reduced when the degree of common ownership increases is further supported by evidence from specific industries where the anti-competitive actions of firms can be directly observed. For example, Azar et al. (2015) and Azar et al. (2016) find that prices of tickets in the airline industry and prices of bank products are respectively higher when measures of concentration due to common ownership increase.
ownership of a firm and its rivals on cash holdings. First, Boot and Vladimirov (2016) point out that precautionary theories of cash holdings focus on firms that anticipate future opportunities and hoard cash to take advantage of those. But if a firm has a present opportunity and delays to investment are costly because of first-mover advantages, then the firm will hoard less cash and invest in the current period by borrowing externally. This new perspective could potentially change the relationship between competition and cash hoarding. In the presence of first mover advantages to investment, higher competition can lead a firm to lose its first mover advantage. This means that the firm would not want to delay investment and would hoard less cash, because it would be using that cash for investment. However, another potential mechanism in this setting is that higher competition reduces profits - by doing so it makes delaying and hoarding less costly. As a result, if this e↵ect dominates, then higher competition would increase cash holdings. Both of these e↵ects are reversed in direction when common ownership increases, because competition goes down when common ownership is high.
Second, theories of agency issues of cash holdings predict that when agency issues are high firms would rather retain cash than distribute it to shareholders (Jensen (1986)). Since mangers prefer more freedom from external monitoring and new fi-nancing requires monitoring managers would hold more internal slack (Gao et al. (2013)). Competition, in turn, can serve as disciplining device that reduces agency frictions. By making mistakes more costly, competition reduces the probability that managers act in a self-interested way and diminishes the need for holding extra cash bu↵ers. In other words, according to this view, by reducing competition common ownership leads to higher cash holdings.
Hypothesis 2: Increases in MHHID, or industry concentration due to common ownership, lead to decreases in firm uncertainty and the degree
of financial constraints.
Morellec et al. (2015) argues that the profitability of assets in place and, as a result, the risk that the firm will have to raise costly external finance, depends on the intensity of product market competition. Similarly, Alfaro et al. (2016) argue that financial frictions and uncertainty interact in determining firm financial policy. They show that if the future is uncertain and it is expensive to use debt or equity funding, firms increase their cash holdings. Increases in concentration due to common ownership can directly influence the riskiness of firms’ projects and their ability to raise external finance.
1.3
Data and Empirical Strategy
1.3.1 DataI use data from 1996 to 2013. I include public firms with data in both COMPUSTAT and CRSP. Aghion et al. (2013) report irregularities with the ownership data prior to 1991. I restrict the sample further to 1996 to 2013 so that I can take advantage of recent industry classifications that start in 1996 (Hoberg and Phillips (2016)). However, the results are robust to extending the sample back to 1980 by just focusing on the standard SIC industry classifications. I drop utilities and financial firms. I further require that firm-year observations included have controls for all of the main variables of interest. Finally, I drop industries with two or less firms in an industry.
To construct the investor ownership variables in this paper, I use the Thomson-Reuters 13F database. All organizations with portfolios of more than $100 million are required by the SEC to report quarterly holdings. I restrict attention to blocks of ownership that are greater or equal to 0.5%. The results are similar if I include all ownership blocks. I calculate the common ownership variable and other institutional holding variables as an average over their quarterly values for the respective year
of interest. The 13-F data does not include ownership by individuals and small institutions. This is likely going to introduce noise in measuring common ownership and bias the analysis against finding a result. In addition, I use data from Bushee (1998) on investor classifications in the 13F dataset. Investors are divided in groups to capture portfolio diversification, turnover and momentum.
In addition to the standard SIC industry classification, I also use data from Hoberg and Phillips (2016). They extract product descriptions from 10-K filings of all public firms. The SEC requires firm to accurately describe their products. Using those descriptions Hoberg and Phillips (2016) calculate the product similarity for every pair of firms - a real number in the interval [0,1]. In the Text-based Network Industry Classifications (TNIC) data of Hoberg and Phillips (2016) competitors are firm centric with each firm having its own distinct set of competitors. Using the TNIC data allows me to trace the product similarity of pairs of firms over time. This is because the TNIC data includes similarity scores for each pair of firms included.
The advantage of using TNIC data is that it is updated annually in accordance to the dynamic adjustment of products firms do. Furthermore, Hoberg and Phillips (2016) show that in comparison to SIC and NAICS industry classifications, TNIC o↵ers economically large improvements in their ability to explain variation in firm profitability, sales growth, and market risk across industries.
1.3.2 Variable Construction
In this section I define the concentration measures I use in greater detail.
The measure of concentration due to common ownership that I use is based on firms’ optimization problems and the weight they put on rivals’ performance. It was firs proposed by Salop and O’Brien (2000). There are N firms and M owners. Investor i owns i,j percent in firm j. Firm j’s maximization problem takes into account the profit maximization of all of its owners which also own other firms in the industry:
max s ⇧j = M X i=1 i,j N X k=1 i,k⇡k (1.1)
Changing the order of the summation, taking ⇡k out of the second sum and di-viding by i,j i,j (1) can be rewritten as:
max s ⇧j =⇡j + X k6=j P i i,k i,j P i i,j i,j ⇡k (1.2)
The first term gives the weight firm j puts on it own profits and the second term
-P
i i,k i,j
P
i i,j i,j - gives the weight the firm puts on its rivals’ profits. The weight firms put on
rivals’ profits makes intuitive sense - it is increasing in the extent of common ownership (the term in the numerator) and is also decreasing in the ownership concentration of the firm itself.
Applying the model to a Cournot set-up gives us the following first-order condition: M X i=1 i,j ⇢ i,j[P(X) Cj(xj)] + N X k=1 i,kP 0 (X)xk (1.3)
P(X) is the inverese demand function, C(x) is the cost function and xj is the good. This first order condition tells us that each shareholder balances the benefit of an increase in quantity produced at a given firm with the loss associated with the corresponding price decrease across all firms.
In equilibrium, the above first-order condition can be rewritten as follows:
X j sj P Cj(x j) P = 1 ⌫ X j X k sjsk P i i,j i,k P i i,j i,j (1.4)
where sj is firm j’s market share and ⌫ is the price elasticity of demand. This equation says that the market-share weighted average mark-up is proportional to HHI.
con-centration that takes into account the ownership structure of firms. This measure is based on the above equation and is defined as follows:
M HHI =X j X k sjsk P i i,j i,k P i i,j i,j (1.5)
It can be further broken down into HHI and a concentration term that is solely due to common ownership:
M HHI =HHI+X j X k6=j sjsk P i i,j i,k P i i,j i,j (1.6)
Azar et al. (2015) label this common ownership term MHHID, or the MHHI delta:
M HHID =X j X k6=j sjsk P i i,j i,k P i i,j i,j (1.7)
I define three additional terms, which compute the MHHI delta based on the type of investors responsible for common ownership between rival firms. The clas-sification is borrowed from Bushee (1998). He assigns investors into three groups: quasi-indexing, dedicated and transient.
In specific, Bushee (1998) first defines nine variables to capture portfolio diver-sification, turnover and momentum. To reduce the dimensionality of the data and combine the nine characteristics into a parsimonious set of linear combinations Bushee (1998) uses factor analysis. The resulting factors capture the average size of an in-vestor’s stake in its firms, the degree of portfolio turnover and momentum (or the trading sensitivity to current earnings news) . Then he uses k-means cluster analysis to classify investors into di↵erent groups depending on their behavior according to these three factors. Quasi-indexing investors have high diversification, low turnover and low momentum. Dedicated institutions have high concentration, low turnover, and almost no sensitivity to to current earnings (zero momentum). Transient
institu-tions have the highest turnover and highest use of momentum strategies along with relatively high diversification.
One potential concern with these classifications is that investors might switch from one category to another. In fact, Bushee (1998) finds that the first-order autocorrela-tion in the classificaautocorrela-tions is about 0.8. To ameliorate concerns about di↵erent biases introduced by such switching of investors, Bushee updates the original classification by finding the modal investor category for each investor and assigning it to every year for the same fund manager. This approach, therefore, makes sure that investors in the classification show up in the same category throughout the available data.
The MHHIDQ, MHHIDD and MHHIDT terms, corresponding to the part of MH-HID due to quasi-indexing, dedicated and transient investors, are defined below:
M HHIDQ=X j X k6=j sjsk PQuasi Indexing i P i,j i,k i i,j i,j (1.8) M HHIDD=X j X k6=j sjsk PDedicated iP i,j i,k i i,j i,j (1.9) M HHIDT =X j X k6=j sjsk PT ransient iP i,j i,k i i,j i,j (1.10)
The di↵erence between the terms is based on whether the summation over in-vestors in the term Pi i,j i,k
P
i i,j i,j is done over all types of investors or over a particular
type.
An important factor in constructing the MHHID variables defined above is de-termining which industry definition to use. Hoberg and Phillips (2016) construct industry definitions (TNIC) based on textual analysis of firms’ 10-K filings. For each firm, they define a list of its closest rival based on a similarity score between the product descriptions of each pair of firms. They find that relative to other industry
classifications (SIC and NAICS), their text-based classification o↵ers an economically large improvement in its ability to explain di↵erences in profitability, sales growth and market risk. For this reason, my main tests rely on their industry definitions.
In specific, I use the top third of the rivals in the textual based classification of Hoberg and Phillips (2016). Selecting the top third of the rivals ensures that I capture the most relevant set of competitors. Furthermore, it means that in calculating market concentration, I average over a smaller set of rivals. This turns out to be important when I construct instrumental variables - it gives more power to my tests. Using the data from Hoberg and Phillips (2016) also gives me the ability to construct a measure of concentration that is specific to each firm.
In robustness tests, I also construct MHHID for the full set of rivals in TNIC. I further use the SIC industries to build an industry-level measure. Finally, to con-struct the above measures I restrict the ownership stakes considered to those above a threshold of 0.5%. This is done for computational reasons, but also because stakes below this threshold are unlikely to matter in influencing firm decisions. For robust-ness, I also show some results with a measure that takes into account all ownership stakes.
1.3.3 Summary statistics
This section provides descriptive statistics for the variables I use. They are shown in Table 1.1. The sample includes all public U.S. firms with available data from 1996 to 2013. I winsorize continuous variables at the 1st and 99th percentiles to minimize the e↵ect of outliers. TNIC MHHID Top Third 0.5% is the MHHID measure based on the top third of the list of rivals in Hoberg and Phillips (2016). It is computed by imposing a minimum threshold of 0.5% on the ownership stakes considered. It has a mean of 0.18 and a standard deviation of 0.11. Table 1.1 further shows a breakdown of this measure into three parts based on the investor types responsible for it:
quasi-Table 1.1: Descriptive Statistics
Variable Mean Std. Dev. Q1 Q2 Q3
TNIC MHHID Top Third 0.5% 0.187 0.117 0.097 0.178 0.267
TNIC MHHIDQ Top Third 0.5% 0.139 0.100 0.062 0.122 0.198
TNIC MHHIDD Top Third 0.5% 0.021 0.028 0.002 0.012 0.027
TNIC MHHIDT Top Third 0.5% 0.026 0.034 0.004 0.013 0.031
TNIC MHHID Top Third 0% 0.223 0.148 0.119 0.210 0.304
TNIC MHHID All 0.5% 0.248 0.128 0.153 0.243 0.334
SIC300 MHHID 0.5% 0.238 0.119 0.150 0.233 0.325
HHI Top Third 0.331 0.226 0.156 0.270 0.454
Institutional Ownership 0.469 0.308 0.184 0.464 0.738
Cash 0.203 0.237 0.027 0.102 0.298
MB 2.222 2.968 1.123 1.505 2.322
Firm Size 5.678 2.042 4.185 5.599 7.071
Cash Flow -0.024 0.416 -0.007 0.061 0.105
Net Working Capital 0.047 0.295 -0.049 0.040 0.170
Capex 0.083 0.093 0.024 0.052 0.106
Book Leverage 0.235 0.269 0.023 0.186 0.355
Dividend Dummy 0.295 0.456 0.000 0.000 1.000
RD 0.889 0.314 1.000 1.000 1.000
Industry Sigma Top Third 0.115 0.137 0.035 0.064 0.126
Industry Sigma 0.127 0.147 0.042 0.072 0.141
This table shows the summary statistics for the variables used. Displayed are the mean, the standard deviation and the first, second and third quartile. The sample consists of all U.S. public firms with available data during the period 1996-2013. All continuous variables are winsorized at the 1% and the 99% level. All variables are defined in the appendix.
indexing, dedicated and transient investors. The TNIC MHHIDQ Top Third 0.5% measure, which is the one based on quasi-indexers has a substantially higher mean and standard deviation than the other two and is, therefore, responsible for most of the level and variation of TNIC MHHID Top Third 0.5%. TNIC MHHIDQ Top Third 0.5% has a mean of 0.13 and a standard deviation of 0.1. In contrast, TNIC MHHIDD Top Third 0.5% andTNIC MHHIDT Top Third 0.5% have means of 0.02 and standard deviations of about 0.03.
Figure 1·1 shows the time-series evolution of the TNIC MHHID Top Third 0.5% measure and its breakdown by types of investors. TNIC MHHID Top Third 0.5% was 0.14 in 1997 and 0.17 in 2013, reaching a peak of 0.21 in 2012. As previously noted, a big part ofTNIC MHHID Top Third 0.5% is due to quasi-indexing investors. Dedicated and transient investors seem to constitute a small part to MHHID. An exception is the 20010-2012 period, when MHHID due to transient investors jumps to about 0.08.
The table also shows summary statistics for several of the MHHID robustness measures I consider. TNIC MHHID Top Third 0% is defined the same way as TNIC MHHID Top Third 0% except it also considers common ownership links below the 0.5% threshold. As expected, this measure has a slightly higher mean and standard deviation than TNIC MHHID Top Third 0%. Further, the table shows that the mean and standard deviations ofTNIC MHHID All 0.5% and SIC300 MHHID 0.5% are somewhat higher, but in line with the ones of my preferred measure - TNIC MHHID Top Third 0%. Finally, institutional ownership has a mean of 44 percent and a standard deviation of 30 percent. This is consistent with the values reported in Harford et al. (2016).
Figure 1·2 shows the time-series evolution of all of the MHHID robustness mea-sures. They seem to move together with each other
The summary statistics of the other controls seem consistent with their values in the literature. The cash over assets ratio has a mean of 20 percent and a standard deviation of about 23 percent. Leverage has mean of 23 percent and a standard deviation of 22 percent. The Herfindahl-Hirschman Index for the top third list of rivals based on Hoberg and Phillips (2016) has a mean of 0.331 and a standard deviation of 0.226. The size of the firms in my sample is, on average, 5.6 billion in 2004 prices with a standard deviation of 2 billion. Cash Flow has a mean of -1.2 percent of total assets and a standard deviation of 26 percent. Net Working Capital has a mean of 6 percent of assets and a standard deviation of 20 percent. Capex (capital expenditures including acquisitions) has a mean of 10 percent and a standard deviation of 12 percent. The Dividend Dummy has a mean of 27 percent. The R&D Dummy has a mean of 88 percent. Industry Sigma, or the industry mean of the standard deviations of cash flows over assets for the past 10 years, is 0.13. Return on Assets has a mean of 1.6 percent and a standard deviation of 70 percent. Cash Flow Volatility has a mean of 0.11 and a standard deviation of 0.74.
1.3.4 Baseline empirical specifications
The main empirical specification I look at in my firm-level analysis is given below. It is based on Harford et al. (2012), who examine the e↵ects of institutional ownership on firm financial policy and it is in line with other papers in the literature.
Cashi,t = MHHIi,t+✓Xi,t+↵t+ i+"i,t (1.11)
The controls in the cash regressions - Xi,t - are from Bates et al. (2013). In partic-ular, I control for the market-to-book ratio (better opportunities require more cash), firm size (economies of scale to cash holdings), cash flow to assets, net working capital to assets (assets that could substitute for cash), capital expenditures and acquisitions
Figure 1·1: MHHID Top Third 0.5% - Bushee 0.00 0.06 0.13 0.19 0.25 1997 1999 2001 2003 2005 2007 2009 2011 2013 MHHID MHHIDQ MHHIDD MHHIDT
This figure shows MHHID computed based on the top third of the rivals in TNIC - MHHID Top Third. A minimum threshold of 0.5% is imposed when computing ownership stakes in the MHHID formula. In addition, the figure shows MHHIDQ, MHHIDD and MHHIDT. These are concentration measures based on quasi-indexing, dedicated and transient investors.
to assets (capital can create assets used as collateral and reduce need for cash or capital investment could proxy for investment opportunities), leverage (cash might be used to relax constraints imposed by leverage), industry cash flow risk (greater risk leads to more precautionary cash holdings), dividend payout dummy (if divi-dend paying are less constrained precautionary cash holdings will be less important to them ), R&D dummy ( R&D could proxy for opportunities or greater costs of fi-nancial distress). In addition, I also control for the competitiveness of the industry in
Figure 1·2: MHHID: TNIC Top Third, TNIC All and SIC 0.00 0.08 0.15 0.23 0.30 1997 1999 2001 2003 2005 2007 2009 2011 2013 SIC TOP THIRD 0 TOP THIRD 05 TNIC ALL
This figure shows MHHID computed based on three di↵erent industry defi-nitions - SIC, Top Third TNIC and TNIC. A minimum threshold of 0.5% is imposed when computing ownership stakes in the MHHID formula for SIC and TNIC All. Top Third TNIC MHHI is computed in two di↵erent ways -with and -without imposing the 0.5% threshold.
which a firm operates, for institutional ownership and for institutional concentration. Further, in some specifications I also include controls for the rivals of a particular firm - the average institutional ownership and the average market to book ratio. Finally, ↵t are time fixed e↵ects and i are firm fixed e↵ects.
1.3.5 Identification strategy: The 2003 Mutual Fund Scandal
In this section, I describe the identification strategy I use.
finan-cial policy poses an empirical challenge. Active fund managers might have private information on future firm outcomes. They could, for example, be willing to hold more firms from the same industry (and not be diversifying instead) only when they expect that those firms will perform better in the future. As a result, when expected profitability changes, MHHID measures could change due to investors shifting their holdings towards profitable industries and away from unprofitable ones. This could be especially true for transient investors. As Bushee (1998) explains transient investors have high trading sensitivity to current earnings news. As a result, such a concern is especially valid for them.
Better future performance could, in turn, be associated with lower cash holdings. This could be the case if firms maintain smaller defense bu↵ers when they expect to do better. However, such a mechanical relationship between firm performance and financial policy does not seem to be holding up in the data. For example, the market-to-book ratio is positively associated with cash holdings and negatively associated with leverage. The interpretation of these coefficients given in the literature is that firms which expect to have higher future opportunities preserve more financial flexibil-ity to take advantage of those opportunities. Further, current performance measures also seem to be positively associated with cash - results that are in contrast to what I find about the relationship between MHHI and cash holdings in the cross-section.
To further ameliorate any remaining concerns about the causality of my results, I exploit an identification strategy based on Anton and Polk (2014). In September 2003, 25 large mutual fund families were implicated in illegal trading practices like market timing and late trading. The investigation into these practices and the ensuing scandal led to substantial capital outflows from the funds. Kisin (2010) estimates that the withdrawals lasted until December 2006 and that the the implicated funds lost 14% of their capital in 2004 and 21% in 2005. Families of funds involved include
famous asset managers like Federated Investors, Franklin Templeton, Deutsche Bank and others.
In constructing the instrument I use, I follow Anton et al. (2016) who study the e↵ect of industry concentration on executive compensation. In particular, I define the ratio of total MHHI held by scandal funds at the time of the scandal and use it to predict future changes in MHHI. First, I define M HHIDscandal
2003 as the scandal MHHID in September 2003, where the sum in the numerator is only over scandal funds, while the sum in the denominator is over all funds.
M HHIDscandal2003 = X j X k6=j sjsk Pscandal iP i,j i,k i i,j i,j (1.12)
Then, I define Ratio as the ratio of M HHIDscandal
2003 and MHHID in September 2003. Ratio = M HHID scandal 2003 M HHID2003 (1.13)
This instrument is likely to be both relevant and to satisfy the exclusion restriction. A higher Scandal Ratio means that a bigger portion of a given firm’s MHHID is susceptible to changes. As scandal funds experience outflows, other investors are likely to buy the shares these funds sell. Depending on the other holdings of these new buyers future MHHID could either increase or decrease. What is certain, however, is that such high scandal ratio firms are likely to experience bigger changes in future MHHID. The identifying assumption is that the Scandal Ratio in 2003 is not related to the financial policies firms were planning on implementing in the following two years. This is a reasonable assumption since the scandal was related to fund managers’ policies of allowing certain clients to trade fund shares in after hours and not to the behavior of their portfolio firms.
1.4
Empirical Results
This section presents the main empirical results of the paper.
1.4.1 Cash Holdings and MHHI
Table 1.2 shows the results of common ownership on firm cash holdings. The de-pendent variable is the cash to assets ratio. The results are also robust to using the logarithm of cash over net assets. In fact, the magnitudes of the estimates on the common ownership variable are larger when I use the logarithm of cash over net as-sets. However, I present the more conservative estimates. All of the variables in the table are standardized so that each coefficient should be interpreted as showing the e↵ect of a one standard deviation change in the independent variable.
The results show support for the precautionary theories of cash holdings - firms seem to cut their cash holdings as MHHID increases. Columns 1 and 2 show the baseline results using MHHI due to all institutional investors. Column 1 includes no extra controls, while columns 2 does. Both columns show that the main variable of interest - MHHID - is negative and highly statistically significant. The magnitude of the coefficient suggests that a one standard deviation increase in MHHID leads to about 0.4 percent increase in cash holdings. Columns 3 and 4 show the Bushee break-down of MHHID according to investor types - quasi-indexer, dedicated and transient. Columns 3 includes no extra controls, while Column 4 does. A one standard deviation increase in MHHIDQ and MHHIDD lead to about 0.4 and 0.3 percent decrease in cash holdings. In contrast, increases in MHHIDT - concentration due to transient investors - lead to increases in cash holdings. Given that transient investors are mo-mentum traders, this result might be due to such investors buying in anticipation of good firm opportunities. If firms hoard cash to take advantage of such opportunities, this would explain the observed relation.
Table 1.2: Cash Holdings and Top Third TNIC MHHI
(1) (2) (3) (4)
Cash Cash Cash Cash
TNIC MHHID Top Third -0.040 -0.036 (0.009)⇤⇤⇤ (0.008)⇤⇤⇤
TNIC MHHIDQ Top Third -0.048 -0.042
(0.010)⇤⇤⇤ (0.009)⇤⇤⇤
TNIC MHHIDD Top Third -0.125 -0.114
(0.028)⇤⇤⇤ (0.027)⇤⇤⇤
TNIC MHHIDT Top Third 0.107 0.088
(0.031)⇤⇤⇤ (0.030)⇤⇤⇤
HHI Top Third -0.012 -0.015 -0.010 -0.014
(0.005)⇤⇤ (0.005)⇤⇤⇤ (0.005)⇤⇤ (0.005)⇤⇤⇤
Observations 53380 53380 53380 53380
R2 0.822 0.839 0.823 0.839
Firm FE Yes Yes Yes Yes
Year FE Yes Yes Yes Yes
This table presents regressions of firm cash holdings on the MHHI variables. Cash holdings are defined as the ratio of cash and short-term investments to assets. The MHHI variables are constructed at the firm level and are based on the Top Third of the rivals of a given firm in the Text-based Network Industry Classifications by Hoberg and Phillips (2016). A threshold of 0.5% is imposed when calculating ownership levels. Columns 1 and 2 show the baseline results using MHHI due to all institutional investors. Columns 3 and 4 show the Bushee breakdown of MHHI according to investor types - quasi-indexer, dedicated and transient. Columns 1 and 3 include no extra controls, while columns 2 and 4 include extra controls. The controls are from Bates et al. (2013) and are omitted for brevity. The sample consists of all U.S. public firms with available data during the period 1996-2013. All variables are defined in the appendix. All continuous variables are winsorized at the 1% and the 99% level. The estimations are adjusted for error heteroskedasticity and within-firm error clustering. *** denotes 1% significance; ** denotes 5% significance; * denotes 10% significance.
For similar reasons, it is possible that the OLS results on MHHIDQ and MHHIDD are biased. If MHHIDQ and MHHIDD increase prior to better industry performance, because investors buy ahead of good opportunities, firms would hoard cash to take advantage of such opportunities. As a result the coefficient estimates on MHHIDQ and MHHIDD would be biased towards 0.
The size and the sign of the coefficients of the other control variables included seem largely in line with the literature. The MB ratio, Cash Flow, R&D and Industry Sigma are positively associated with cash holdings. This agrees with the expectation that firms with better opportunities need to hoard cash to be able to take advantage of those opportunities, that more innovative firms need more cash to finance their R&D activities, and that firms operating in more risky industries use cash as a bu↵er against uncertain industry conditions. Firm size, Net Working Capital, Capex and Leverage are negatively associated with cash holdings. These coefficients are in line with some of the explanations given in the literature: firm size accounts for economies of scale in cash holdings, net working capital is a substitute for cash, capital provides firms with collateral to borrow against and high leverage forces firm to use cash to relax the constraints imposed by it (Bates et al. (2013)).
1.4.2 Cash Holdings and MHHI: Robustness
In this section, I show that the results are robust to using di↵erent industry classi-fications to construct concentration measures due to common ownership. I further show that the results are robust to not imposing a 0.5% cut-o↵ on ownership stakes. Table 1.3 again shows regressions of firm cash holdings on the MHHI variables. In this table, the MHHI variables are based on the full list of rivals in the Text-based Network Industry Classifications by Hoberg and Phillips (2016). Columns 1 and 2 show the baseline results using MHHI due to all institutional investors. Columns 3 and 4 show the Bushee breakdown of MHHI according to investor types -
quasi-indexer, dedicated and transient. Columns 1 and 3 include no extra controls, while columns 2 and 4 include extra controls. The results are meant as a robustness check and are largely consistent with the ones based on the Top Third of the rivals in the Text-based Network Industry Classifications by Hoberg and Phillips (2016). Increases in MHHID lead to decreases in cash holdings. This results holds for MHHI due to both quasi-indexing and dedicated investors. As before, it is reversed for transient investors.
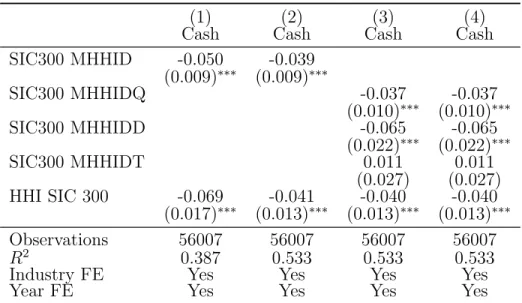
Table 1.4 shows the same regressions but this time the MHHI variables are based on the SIC classifications. The results are meant are largely consistent with the ones based on the Top Third of the rivals in the Text-based Network Industry Classifi-cations by Hoberg and Phillips (2016). Increases in MHHID lead to decreases in cash holdings. Again, this results holds for MHHID due to both quasi-indexing and dedicated investors and is reversed for transient investors.
Finally, Table 1.5 repeats the same exercise, but this time the MHHID variables are based on the Top Third of list of rivals in the Text-based Network Industry Classifications by Hoberg and Phillips (2016). The di↵erence from before is that no ownership threshold is imposed when calculating MHHID. Columns 1 and 2 show the baseline results using MHHID due to all institutional investors. Columns 3 and 4 show the Bushee breakdown of MHHID according to investor types - quasi-indexer, dedicated and transient. Columns 1 and 3 include no extra controls, while columns 2 and 4 include extra controls. The results are again consistent with the the ones when a threshold of 0.5 % is used to calculate MHHID. Increases in MHHID lead to decreases in cash holdings. This further holds for MHHID due to both quasi-indexing and dedicated investors, but is reversed for MHHID due to transient investors.
Table 1.3: Cash Holdings and TNIC MHHI
(1) (2) (3) (4)
Cash Cash Cash Cash
TNIC MHHID All -0.036 -0.029 (0.009)⇤⇤⇤ (0.009)⇤⇤⇤
TNIC MHHIDQ All -0.020 -0.020
(0.010)⇤⇤ (0.010)⇤⇤
TNIC MHHIDD All -0.159 -0.159
(0.029)⇤⇤⇤ (0.029)⇤⇤⇤
TNIC MHHIDT All 0.069 0.069
(0.031)⇤⇤ (0.031)⇤⇤
Sales HHI -0.002 -0.005 -0.002 -0.002
(0.005) (0.004) (0.004) (0.004)
Observations 53590 53590 55457 55457
R2 0.822 0.839 0.835 0.835
Firm FE Yes Yes Yes Yes
Year FE Yes Yes Yes Yes
This table presents regressions of firm cash holdings on the MHHI variables. Cash holdings are defined as the ratio of cash and short-term investments to assets. The MHHI variables are constructed at the firm level and are based on the Text-based Network Industry Classifications by Hoberg and Phillips (2016). A threshold of 0.5% is imposed when calculating ownership levels. Columns 1 and 2 show the baseline results using MHHI due to all institutional investors. Columns 3 and 4 show the Bushee breakdown of MHHI according to investor types - quasi-indexer, dedicated and transient. Columns 1 and 3 include no extra controls, while columns 2 and 4 include extra controls. The controls are from Bates et al. (2013) and are omitted for brevity. The sample consists of all U.S. public firms with available data during the period 1996-2013. All variables are defined in the appendix. All continuous variables are winsorized at the 1% and the 99% level. The estimations are adjusted for error heteroskedasticity and within-firm error clustering. *** denotes 1% significance; ** denotes 5% significance; * de-notes 10% significance.
Table 1.4: Cash Holdings and SIC MHHI
(1) (2) (3) (4)
Cash Cash Cash Cash
SIC300 MHHID -0.050 -0.039 (0.009)⇤⇤⇤ (0.009)⇤⇤⇤ SIC300 MHHIDQ -0.037 -0.037 (0.010)⇤⇤⇤ (0.010)⇤⇤⇤ SIC300 MHHIDD -0.065 -0.065 (0.022)⇤⇤⇤ (0.022)⇤⇤⇤ SIC300 MHHIDT 0.011 0.011 (0.027) (0.027) HHI SIC 300 -0.069 -0.041 -0.040 -0.040 (0.017)⇤⇤⇤ (0.013)⇤⇤⇤ (0.013)⇤⇤⇤ (0.013)⇤⇤⇤ Observations 56007 56007 56007 56007 R2 0.387 0.533 0.533 0.533
Industry FE Yes Yes Yes Yes
Year FE Yes Yes Yes Yes
This table presents regressions of firm cash holdings on the MHHI vari-ables. Cash holdings are defined as the ratio of cash and short-term investments to assets. The MHHI variables are constructed at the indus-try level and are based on the SIC industries. A threshold of 0.5% is imposed when calculating ownership levels. Columns 1 and 2 show the baseline results using MHHI due to all institutional investors. Columns 3 and 4 show the Bushee breakdown of MHHI according to investor types -quasi-indexer, dedicated and transient. Columns 1 and 3 include no extra controls, while columns 2 and 4 include extra controls. The controls are from Bates et al. (2013) and are omitted for brevity. The sample consists of all U.S. public firms with available data during the period 1996-2013. All variables are defined in the appendix. All continuous variables are winsorized at the 1% and the 99% level. The estimations are adjusted for error heteroskedasticity and within-firm error clustering. *** denotes 1% significance; ** denotes 5% significance; * denotes 10% significance.
Table 1.5: Cash Holdings and Top Third TNIC MHHI
(1) (2) (3) (4)
Cash Cash Cash Cash
TNIC MHHID Top Third -0.029 -0.024 (0.006)⇤⇤⇤ (0.005)⇤⇤⇤
TNIC MHHIDQ Top Third -0.042 -0.034
(0.007)⇤⇤⇤ (0.006)⇤⇤⇤
TNIC MHHIDD Top Third -0.129 -0.118
(0.028)⇤⇤⇤ (0.028)⇤⇤⇤
TNIC MHHIDT Top Third 0.106 0.089
(0.025)⇤⇤⇤ (0.024)⇤⇤⇤
HHI Top Third -0.011 -0.014 -0.010 -0.013
(0.005)⇤⇤ (0.004)⇤⇤⇤ (0.005)⇤⇤ (0.005)⇤⇤⇤
Observations 53380 53380 53380 53380
R2 0.823 0.839 0.823 0.839
Firm FE Yes Yes Yes Yes
Year FE Yes Yes Yes Yes
This table presents regressions of firm cash holdings on the MHHI variables. Cash holdings are defined as the ratio of cash and short-term investments to assets. The MHHI variables are constructed at the firm level and are based on the Top Third of the rivals of a given firm in the Text-based Network Industry Classifications by Hoberg and Phillips (2016). No threshold is imposed when calculating ownership levels in MHHID. Columns 1 and 2 show the baseline results using MHHI due to all institutional investors. Columns 3 and 4 show the Bushee breakdown of MHHI according to investor types - quasi-indexer, dedicated and transient. Columns 1 and 3 include no extra controls, while columns 2 and 4 include extra controls. The controls are from Bates et al. (2013) and are omitted for brevity. The sample consists of all U.S. public firms with available data during the period 1996-2013. All variables are defined in the appendix. All continuous variables are winsorized at the 1% and the 99% level. The estimations are adjusted for error heteroskedasticity and within-firm error clustering. *** denotes 1% significance; ** denotes 5% significance; * denotes 10% significance.
1.4.3 Firm-Level Instrumental Variable Strategy: The 2003 Mutual Fund Scandal
As I argued previously the 2003 mutual fund scandal provides a useful setting to study common ownership. I follow Anton et al. (2016) and define the ratio of total MHHID held by scandal funds to total MHHID at the time of the scandal and use it to predict future changes in MHHID. A higher Scandal Ratio means that a bigger portion of a given firm’s MHHID is susceptible to changes. As scandal funds experience outflows, other investors are likely to buy the shares these funds sell. Depending on the other holdings of these new buyers future MHHID could either increase or decrease. What is certain, however, is that such high scandal ratio firms are likely to experience bigger changes in future MHHID.
Table 1.6 shows regressions of firm cash holdings on the instrumented concen-tration measures - MHHID and MHHIDQ. I focus on MHHID and MHHIDQ as MHHIDQ represents the biggest part of MHHID. As an instrument, I use a dummy for cases where the fraction of MHHID held by scandal funds in 2003 is above the 50th percentile. A further control is included for the level of MHHID in 2003: TNIC MHHID 2003. Columns 1 and 2 show the first stages of the regression. Columns 3 and 4 show the respective second stages. The first stage results show that the scandal ratio dummy strongly predicts future changes in MHHID and MHHIDQ. The second stage results confirm the conclusions based on the crosssectional regressions -MHHID strongly and negatively a↵ects firm cash holdings.
Columns 2 and 4 show that the instrumentedMHHIDnow has a bigger estimated impact on firm cash holdings than in the OLS regressions. A one standard deviation increase in the MHHIDleads to a decrease in firm cash holdings of about 10 percent. As I explained before, this increase in the magnitude of the coefficient could be due to the fact that the OLS results are biased towards 0. If investors buy firms ahead
of the revelation of good opportunities and if firms hoard cash to take advantage of those opportunities, the OLS regressions would be biased.
Table 1.7 also presents regressions of firm cash holdings on the instrumented con-centration measures - MHHID and MHHIDQ. This time the instrument is the fraction of MHHI held by scandal funds in 2003. As before, a further control is included for the level of MHHID in 2003: TNIC MHHID 2003. Columns 1 and 2 show the first stages of the regression. Columns 3 and 4 show the respective second stages. This table is meant as a robustness check. The di↵erence from 1.6 is that Table 1.7 uses a continuous scandal ratio. The significance and magnitudes of the coefficient estimates are consistent with the ones from before.
In summary, the instrumental variable results suggest that firms adjust their finan-cial flexibility when the concentration of the industry in which they operate changes as a result of changes in common ownership with industry rivals. The results seem con-sistent with a story that combines the implications of theories of the anti-competitive e↵ects of common ownership (Gordon (1990) and Salop and O’Brien (2000)) and the-ories of the intertemporal adjustment of firm financial policy as an insurance mech-anism against potential adverse events (Morellec et al. (2015) and DeAngelo et al. (2011)).
1.4.4 Possible Mechanisms: Uncertainty and Constraints
Morellec et al. (2015) argues that the profitability of assets in place and, as a result, the risk that the firm will have to raise costly external finance, depends on the intensity of product market competition. Similarly, Alfaro et al. (2016) argue that financial frictions and uncertainty interact in determining firm financial policy. They show that if the future is uncertain and it is expensive to use debt or equity funding, firms increase their cash holdings. In this section, I explicitly test these mechanisms.
Table 1.6: Cash Holdings and The 2003 Mutual Fund Scandal First Stage Second Stage
TNIC MHHID TNIC MHHIDQ Cash Cash Top Third Top Third
Ratio Top 50% -0.015 -0.017
(0.003)⇤⇤⇤ (0.003)⇤⇤⇤
TNIC MHHID Top Third -1.239
(0.492)⇤⇤
TNIC MHHIDQ Top Third -1.159
(0.441)⇤⇤⇤
TNIC MHHID 2003 0.314 0.280 0.449 0.384
(0.015)⇤⇤⇤ (0.015)⇤⇤⇤ (0.160)⇤⇤⇤ (0.129)⇤⇤⇤
HHI Top Third -0.199 -0.160 -0.265 -0.205
(0.007)⇤⇤⇤ (0.007)⇤⇤⇤ (0.096)⇤⇤⇤ (0.070)⇤⇤⇤
Kleibergen-Paap F-statistic 21 27
Observations 4989 4989 4989 4989
R2 0.538 0.509 0.460 0.503
Industry FE Yes Yes Yes Yes
Year FE Yes Yes Yes Yes
This table presents regressions of firm cash holdings on the instrumented concentration measures -MHHID and -MHHIDQ. As an instrument, I use a dummy for cases where the fraction of -MHHID held by scandal funds in 2003 is above the 50th percentile. A further control is included for the level of MHHID in 2003: TNIC MHHID 2003. Columns 1 and 2 show the first stages of the regression. Columns 3 and 4 show the respective second stages. The sample consists of all U.S. public firms with available data during the period 2004-2005. All control variables are defined in the appendix. The controls variables are from Bates et al. (2013) and are omitted for brevity. All continuous variables are winsorized at the 1% and the 99% level. The estimations are adjusted for error heteroskedasticity and within-firm error clustering. *** denotes 1% significance; ** denotes 5% significance; * denotes 10% significance.
Table 1.7: Cash Holdings and The 2003 Mutual Fund Scandal First Stage Second Stage
TNIC MHHID TNIC MHHIDQ Cash Cash Top Third Top Third
Ratio -0.385 -0.390
(0.075)⇤⇤⇤ (0.067)⇤⇤⇤
TNIC MHHID Top Third -1.186
(0.471)⇤⇤
TNIC MHHIDQ Top Third -1.170
(0.453)⇤⇤⇤
TNIC MHHID 2003 0.311 0.277 0.432 0.387
(0.015)⇤⇤⇤ (0.015)⇤⇤⇤ (0.154)⇤⇤⇤ (0.133)⇤⇤⇤
HHI Top Third -0.197 -0.158 -0.255 -0.206
(0.007)⇤⇤⇤ (0.007)⇤⇤⇤ (0.092)⇤⇤⇤ (0.071)⇤⇤⇤
Kleibergen-Paap F-statistic 26 33
Observations 4989 4989 4989 4989
R2 0.538 0.509 0.473 0.501
Industry FE Yes Yes Yes Yes
Year FE Yes Yes Yes Yes
This table presents regressions of firm cash holdings on the instrumented concentration measures -MHHID and -MHHIDQ. The fraction of MHHI held by scandal funds in 2003 is used as an instrument. A further controls is included for the level of MHHID in 2003: TNIC MHHID 2003. Columns 1 and 2 show the first stages of the regression. Columns 3 and 4 show the respective second stages. The sample consists of all U.S. public firms with available data during the period 2004-2005. All control variables are defined in the appendix. The controls variables are from Bates et al. (2013) and are omitted for brevity. All continuous variables are winsorized at the 1% and the 99% level. The estimations are adjusted for error heteroskedasticity and within-firm error clustering. *** denotes 1% significance; ** denotes 5% significance; * denotes 10% significance.
therefore, reduces financial frictions that firms might face. As a result, firms find it optimal to hold less cash to insure against negative events. Another possibility is that reduced competition means that firms face less uncertainty about future projects and can a↵ord to hold less cash as precaution against such uncertainty.
I use the percentage of constraining and uncertain words in firms’ 10-K filings to proxy for uncertainty and financial constraints. Hoberg and Maksimovic (2015) and Bodnaruk et al. (2015) show that textual based measures are more e↵ective in predicting future adverse events than alternative measures like the age-size ratio, the KZ index or the Whited-Wu index.
Table 1.8 shows regressions of the frequency of uncertainty related words in firms’ 10-K filings on the instrumented concentration measures - MHHID and MHHIDQ. As before, as an instrument, I use a dummy for cases where the fraction of MHHID held by scandal funds in 2003 is above the 50th percentile. A further control is included for the level of MHHID in 2003: TNIC MHHID 2003. Columns 1 and 2 show the first stages of the regression. Columns 3 and 4 show the respective second stages. The second stage regressions show that increases in MHHID and the respective decreases in competition lead to a decrease in the frequency of uncertainty related words in firms’ 10-K filings. A one standard deviation increase in MHHID and MHHIDQ leads to about a 0.0014 increase in the frequency of uncertain words. This is about 1/3 of the standard deviation of that variable.
The results seem consistent with concentration due to common ownership reducing the uncertainty of the environment firms face and enabling them to decrease their cash holdings.
Table 1.9shows regressions of the frequency of constraining words in firms’ 10-K filings on the instrumented concentration measures - MHHID and MHHIDQ. As before, as an instrument, I use a dummy for cases where the fraction of MHHID held