3
About This Report
4
Sponsors
5
A Message from the SHRM Foundation
6
Executive Summary
7
Survey Results
7
Overall Characteristics of Performance Management Systems
7
System Objectives: Employees Come First
8
Satisfied With Appraisals; Dissatisfied With Development
9
More Executive Support Required
9
Top Effectiveness Measures
11
System Components Are Integrated
11
Planning and Evaluation
11
Performance Planning and Evaluation: Executives Have the Edge
12
Development and Career Planning: A Need to Focus on the Future
13
Development
13
Classroom Training Popular and Preferred
14
The Fully Developed Executive?
15
Lack of Training in Feedback and Coaching
15
Rewards: Performance Pay Common At All Levels
15
Technology Industries: Champion for Non-Exempt Employees
16
The Future: More 360-Degree Feedback
18
Conclusion
19
Demographics
20
A Message from Personnel Decisions International
21
Sample Questionnaire
T
he Society for Human Resource Management (SHRM), with partial funding from the SHRM Foundation, and Personnel Decisions International (PDI) co-sponsored the 2000Perfor-mance Management Survey to gather information on
performance management in today’s workplace. The following report provides an analysis of the sur-vey results, based on the responses of 480 human resource (HR) professionals.
The traditional focus of performance management systems has been on performance planning and evalu-ation, rewards and discipline. In developing this sur-vey, SHRM and PDI decided to focus on a more con-temporary viewpoint of performance management. In addition to the traditional aspects, this survey covers development and career planning, feedback, coach-ing, training and development methods.
The study objectives were to:
• measure current and best practices in perfor-mance management;
• measure how organizations view the effectiveness of their current performance management systems overall and of specific performance management tools; and
• forecast where activity will be shifting in the near future.
SHRM and PDI decided to survey SHRM mem-bers in organizations that were most likely to have performance management systems in place–those organizations with 100 or more employees. In July 2000, questionnaires were faxed to 2,710 SHRM members: one-third each from organizations with 100-499 employees, 500-2,499 employees and 2,500+ employees. Respondents could choose between two survey completion methods: paper or online. Of the 480 HR professionals responding to the questionnaire, 75% completed the paper survey and 25% completed the web survey.
The survey report contains numerous tables and charts that capture the participants’ responses. Several comparisons based on organization size are made throughout the report. To see key data cate-gorized by organization size, please visit either of the following web sites: www.shrm.org/surveys/ or www.personneldecisions.com. In addition, throughout the report readers are posed questions about their own organizations’ performance man-agement practices in order to enhance the useful-ness of the survey results. Also, the report includes a copy of the survey questionnaire and an appen-dix that contains white papers relating to perfor-mance management.
T
he Society for Human Resource Manage-ment (SHRM) is the leading voice of the human resource profession. SHRM pro-vides education and information services, con-ferences and seminars, government and media representation, online services and publications to more than 140,000 professional and student members throughout the world. The Society, the world’s largest human resource manage-ment association, is a founding member of the North American Human Resource Management Association (NAHRMA) and the World Federa-tion of Personnel Management AssociaFedera-tions (WFPMA).The SHRM Foundation is a non-profit organiza-tion established in 1966 to fund and support applied research, publications, scholarships and educational programs to help HR professionals and their employers prepare for the future. The Foun-dation’s goal is to continuously improve standards of practice and performance for the HR profession
and to help HR leaders stay current with the latest developments and trends.
Personnel Decisions International (PDI) is a global human resources consulting firm. PDI has helped client organizations meet their business challenges through integrated solutions to human resource needs since 1967. PDI works in partner-ship with clients to:
• define successful performance and identify the capabilities needed to achieve it.
• measure performance and capabilities, and evalu-ate potential.
• develop the capabilities needed to be successful– now and in the future.
PDI’s goal is to help clients build effective organiza-tions and gain competitive advantage through wise-ly choosing and effectivewise-ly developing their most important asset–people. For more information regarding PDI, see “A Message from Personnel Decisions International” following the survey report on page 20.
I
t’s a great time to be a human resource profes-sional. Companies today recognize that people are the competitive advantage, and HR is being asked to play a strategic leadership role in shaping their organization’s future. To do this, human resource professionals will need to continually expand their knowledge and competencies. That’s why the SHRM Foundation is so important today.Investing in Knowledge For Your Future
The SHRM Foundation is a 501(c)(3) non-profit organization that promotes research and develop-ment in the human resource field. The SHRM Foundation advances the profession and increases the knowledge and effectiveness of human resource professionals through its funding of lead-ing-edge human resource research, publications and educational initiatives.
Sponsorship of the SHRM
®Survey Program
As a sponsor of the SHRM® Survey program, the
SHRM Foundation is able to provide timely research findings on important issues to SHRM members on a regular basis. For example, the fol-lowing SHRM and Personnel Decisions Internation-al (PDI) survey on performance management sys-tems offers rich insights into the importance of employee-oriented performance systems in today’s highly competitive work environment.
The survey findings reveal that employees today want to know the answer to the question made famous by Ed Koch, former Mayor of New York City: “How am I doing?” Like Koch, employees want feedback about their performance and what the organization expects of them. Furthermore, employees want information about what they need to do to develop as leaders and to increase their value as employees. This important survey provides food for thought for HR professionals especially the inclusion of development as part of perfor-mance management systems.
Foundation-Related Research Projects
The SHRM/PDI survey on performance manage-ment systems is part of the larger human resource issues on productivity and career development. The SHRM Foundation is particularly interested in understanding more about the attitudes of employ-ees today, especially in relationship to the organiza-tion. For example, here are two Foundation research projects currently underway that explore this issue in more detail:
C
Chhaannggiinngg NNaattuurree ooff tthhee EEmmppllooyymmeenntt RReellaattiioonnsshhiipp: by Lynn M. Shore, Ph.D., Lois E. Tetrick, Ph.D., and Sandy J. Wayne, Ph.D.
In the competition for talent, it is increasingly important for organizations to understand the changing nature of the employment relationship. The employment relationship refers to employees’ perceptions of what they owe the organi-zation and what the organiorgani-zation owes them in return. The proposed research examines how HR practices help form the employment relationship, which in turn, influ-ences organizational outcomes (commitment, performance, citizenship, turnover).
V
Voolluunnttaarryy TTuurrnnoovveerr,, WWoorrkkffoorrccee PPrroodduuccttiivviittyy aanndd OOrrggaan nii--zzaattiioonnaall PPeerrffoorrmmaannccee:: IInnvveessttiiggaattiinngg tthhee RRoollee ooff HHRR MMaan n--a
aggeemmeenntt IInnvveessttmmeennttss:: by Jason Shaw, Ph.D.
This research project investigates the relationships between voluntary turnover and organizational performance in a survey study of 1,200 motor carriers, supplemented by two archival data sources. Results will enhance the scientific knowledge base and provide value for practitioners mak-ing HRM decisions that impact bottom line performance.
For More Information
Contact the SHRM Foundation for more informa-tion about these and other research projects by e-mailing [email protected]. Thank you for your support of the SHRM Foundation and your com-mitment to excellence in the profession.
T
he 2000 Performance Management Survey showed that performance management in organizations is evolving from a system domi-nated by the performance appraisal to a system that focuses on employee development. However, the transition is far from complete. Stronger executive support for performance management and increased employee participation in development activities is needed in order for performance man-agement systems to truly become a tool to help attract and retain talent.Overall Characteristics of
Performance Management Systems
Respondents gave top priority to performance management system objectives focused on employees rather than managers.
Respondents were significantly more satisfied with traditional system components — performance planning and evaluations, discipline — compared with developmental components — leadership development, development planning, 360-degree feedback, and coaching.
Executive support for performance management was lacking. HR professionals reported that many executives and senior managers did not endorse or even use their performance management system.
Planning and Evaluation
Seven out of 10 respondents reported that their organizations had written performance plans for most executives. Nearly two-thirds (64%) had perfor-mance plans for most exempt employees, and nearly half (45%) had plans for non-exempt employees.
Seventy-five percent of participants reported that most of their executives had performance goals linked to operating results, compared to 36% for exempt employees and 17% for non-exempt employees.
Development planning and career planning efforts were limited. Twenty-five percent of participating organizations had written development plans for all executives, and a mere 8% of respondents’ organi-zations had career plans for all executives.
Development
Classroom training was the most popular method for professional development. Eighty-six percent of respondents’ organizations conducted in-house classroom training and 84% had employees partici-pate in external classroom training.
On-the-job training and in-house classroom train-ing were rated as the most effective professional development methods. Independent study — both traditional and online — was viewed as the least effective development method.
Respondents reported that a lower percentage of executives at their organizations — compared with exempt and non-exempt employees—participated in most development activities.
The Future
360-degree feedback was the only specific perfor-mance management area where companies planned to increase their activity during the next year. 360-degree feedback was used by only one-third of respondents’ organizations.
•
•
•
•
•
•
•
•
•
•
I
n today’s tight labor market, the ability to attract and retain valuable employees is a source of competitive advantage for organizations in every industry. One key to attracting and retaining high-performing employees is to provide strong support for their best performance: define and establish clear performance goals; track progress and give relevant, useful feedback; and develop employees to meet or exceed the company’s goals and their own personal career goals.The traditional approach to providing such sup-port has been in the form of performance manage-ment systems. But what are HR professionals’ objectives for their performance management sys-tems? What are the current and best practices in performance management? How effective do human resource professionals think that their cur-rent performance management systems are – both overall and with regard to specific tools? What are the greatest challenges to improving performance management systems? In which area of perfor-mance management will HR professionals concen-trate their efforts in the near future?
To answer these questions, the Society for Human Resource Management (SHRM) and Per-sonnel Decisions International (PDI) conducted the 2000 Performance Management Survey. Survey respondents shared their insights on current
prac-tices and anticipated activity in performance man-agement. The following pages report the results of this survey.
OVERALL CHARACTERISTICS OF
PERFORMANCE MANAGEMENT SYSTEMS
System Objectives: Employees Come First
Survey participants believed that performance man-agement systems should focus on the employee. Respondents were asked to place seven perfor-mance management system objectives in rank order based on their importance (“1” being most impor-tant; “7” being least important). Results showed that the highest ranked objectives for performance man-agement systems were employee-oriented:
• Provide information to employees about percep-tions of their performance.
• Clarify organizational expectations of employees. • Provide information to employees about their
development needs.
Those objectives focused on providing informa-tion to managers were ranked lower by survey respondents. For example, documenting perfor-mance for employee records and providing infor-mation to managers for making promotion/demo-tion decisions ranked sixth and seventh, respective-ly (see Figure 1).
Figure 1: Objectives of Performance Management System
Average Rank Objectives
Clarify organizational expectations of employees Identify developmental needs
Gather information for pay decisions Gather information for coaching
Document performance for employee records Gather information for promotion decisions
Provide information to employees about their performance 2.8 2.8 3.7 4.0 4.2 4.6 5.2
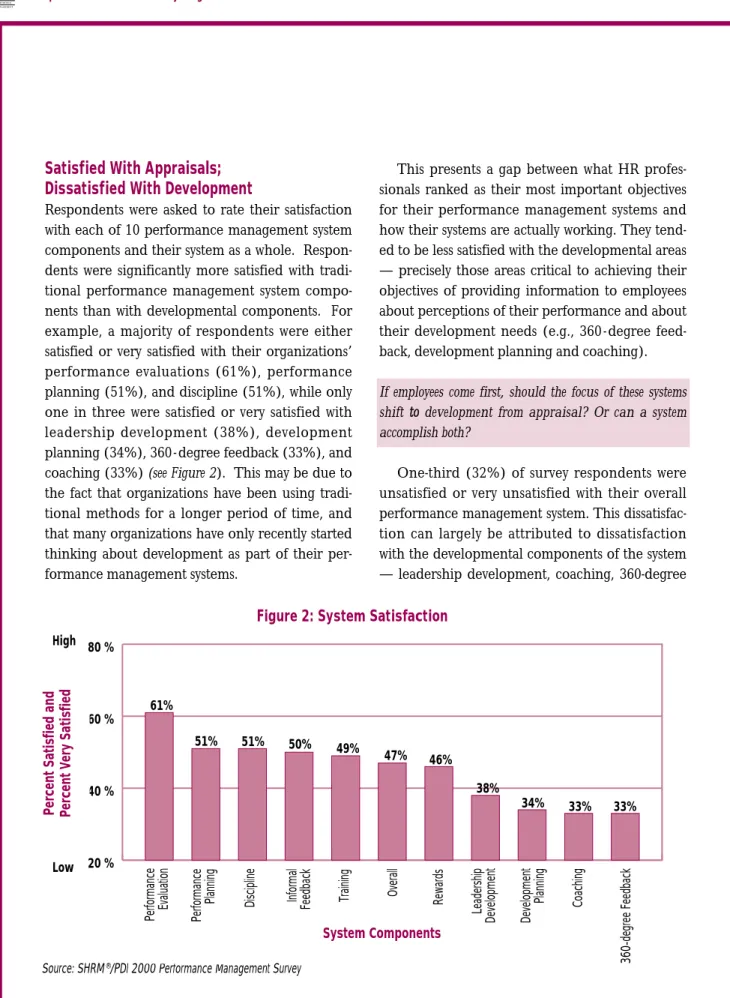
Satisfied With Appraisals;
Dissatisfied With Development
Respondents were asked to rate their satisfaction with each of 10 performance management system components and their system as a whole. Respon-dents were significantly more satisfied with tradi-tional performance management system compo-nents than with developmental compocompo-nents. For example, a majority of respondents were either satisfied or very satisfied with their organizations’ performance evaluations (61%), performance planning (51%), and discipline (51%), while only one in three were satisfied or very satisfied with leadership development (38%), development planning (34%), 360- degree feedback (33%), and coaching (33%) (see Figure 2). This may be due to the fact that organizations have been using tradi-tional methods for a longer period of time, and that many organizations have only recently started thinking about development as part of their per-formance management systems.
This presents a gap between what HR profes-sionals ranked as their most important objectives for their performance management systems and how their systems are actually working. They tend-ed to be less satisfitend-ed with the developmental areas — precisely those areas critical to achieving their objectives of providing information to employees about perceptions of their performance and about their development needs (e.g., 360 - degree feed-back, development planning and coaching).
If employees come first, should the focus of these systems shift ttoo development from appraisal? Or can a system accomplish both?
One-third (32%) of survey respondents were unsatisfied or very unsatisfied with their overall performance management system. This dissatisfac-tion can largely be attributed to dissatisfacdissatisfac-tion with the developmental components of the system — leadership development, coaching, 360-degree
Source: SHRM®/PDI 2000 Performance Management Survey
20 % 40 % 60 % 80 % 51% 61% 51% 50% 49% 47% 46% 38% 34% 33% 33%
Figure 2: System Satisfaction
Performance Evaluation Performance
Planning Discipline Informal
Feedback Training Overall Rewards Leadership Development Development Planning Coaching 360-degree Feedback System Components High Low Percent Satisfied and Percent Very Satisfied
feedback, and development planning. Many sur-vey respondents recognized that employee devel-opment needed to be viewed as a retention strate-gy. Employees continue working for organizations where they feel they are: being adequately chal-lenged, learning new skills and capabilities, sup-ported and coached by their manager, and pro-gressing toward their career goals.
More Executive Support Required
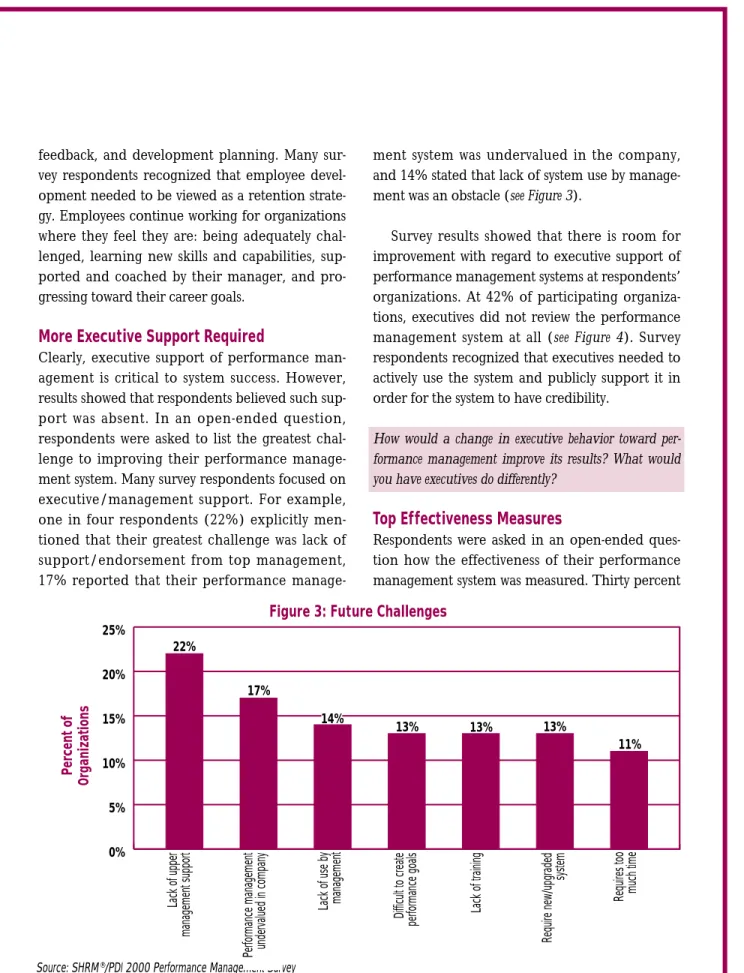
Clearly, executive support of performance man-agement is critical to system success. However, results showed that respondents believed such sup-port was absent. In an open-ended question, respondents were asked to list the greatest chal-lenge to improving their performance manage-ment system. Many survey respondents focused on executive/management support. For example, one in four respondents (22%) explicitly men-tioned that their greatest challenge was lack of support/endorsement from top management, 17% reported that their performance
manage-ment system was undervalued in the company, and 14% stated that lack of system use by manage-ment was an obstacle (see Figure 3).
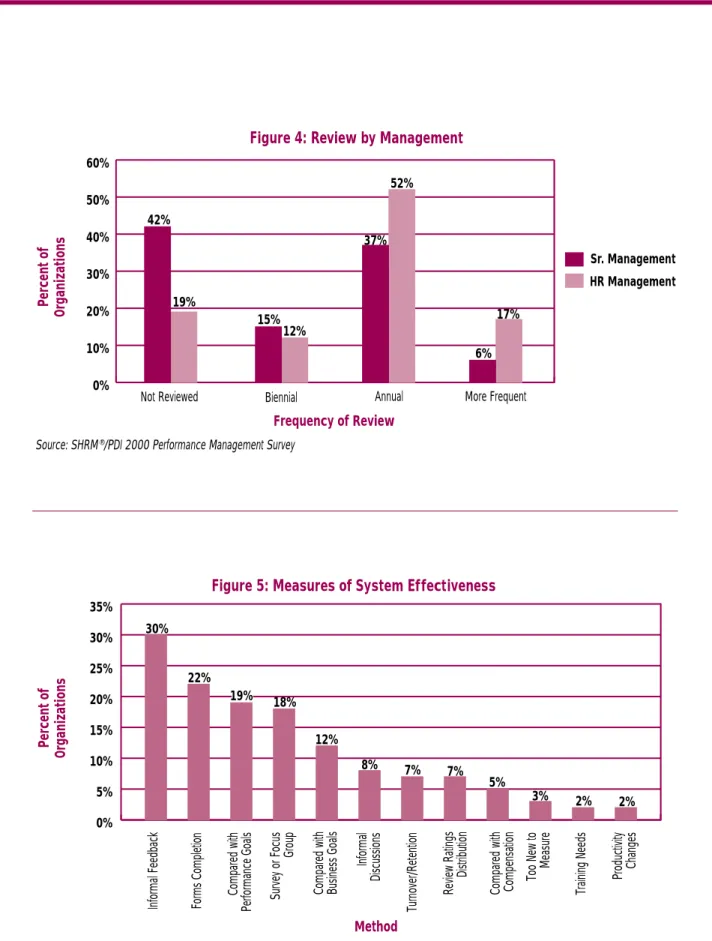
Survey results showed that there is room for improvement with regard to executive support of performance management systems at respondents’ organizations. At 42% of participating organiza-tions, executives did not review the performance management system at all (see Figure 4). Survey respondents recognized that executives needed to actively use the system and publicly support it in order for the system to have credibility.
How would a change in executive behavior toward per-formance management improve its results? What would you have executives do differently?
Top Effectiveness Measures
Respondents were asked in an open-ended ques-tion how the effectiveness of their performance management system was measured. Thirty percent
0% 5% 10% 15% 20% 25% 22% 17% 14% 13% 13% 13% 11% Percent of Organizations
Source: SHRM®/PDI 2000 Performance Management Survey
Figure 3: Future Challenges
Lack of upper
management support
Performance management undervalued in company
Lack of use by management
Difficult to create
performance goals
Lack of training
Require new/upgraded
system
0% 10% 20% 30% 40% 50% 60% Sr. Management HR Management 42% 19% 15% 12% 52% 37% 17% 6% Percent of Organizations
Figure 4: Review by Management
Source: SHRM®/PDI 2000 Performance Management Survey
Frequency of Review
Not Reviewed Biennial Annual More Frequent
0% 5% 10% 15% 20% 25% 30% 35% 30% 22% 19% 18% 12% 8% 7% 7% 5% 3% 2% 2% Percent of Organizations
Figure 5: Measures of System Effectiveness
Informal Feedback Forms Completion Compared with Performance Goals Survey or Focus
Group
Compared with Business Goals
Informal
Discussions
Turnover/Retention
Review Ratings
Distribution
Compared with Compensation Too New to Measure
Training Needs
Productivity Changes
Source: SHRM®/PDI 2000 Performance Management Survey
of respondents listed informal feedback and 22% listed forms completion/timeliness of forms as the method used to measure effectiveness of the sys-tem. Other measures are listed in Figure 5.
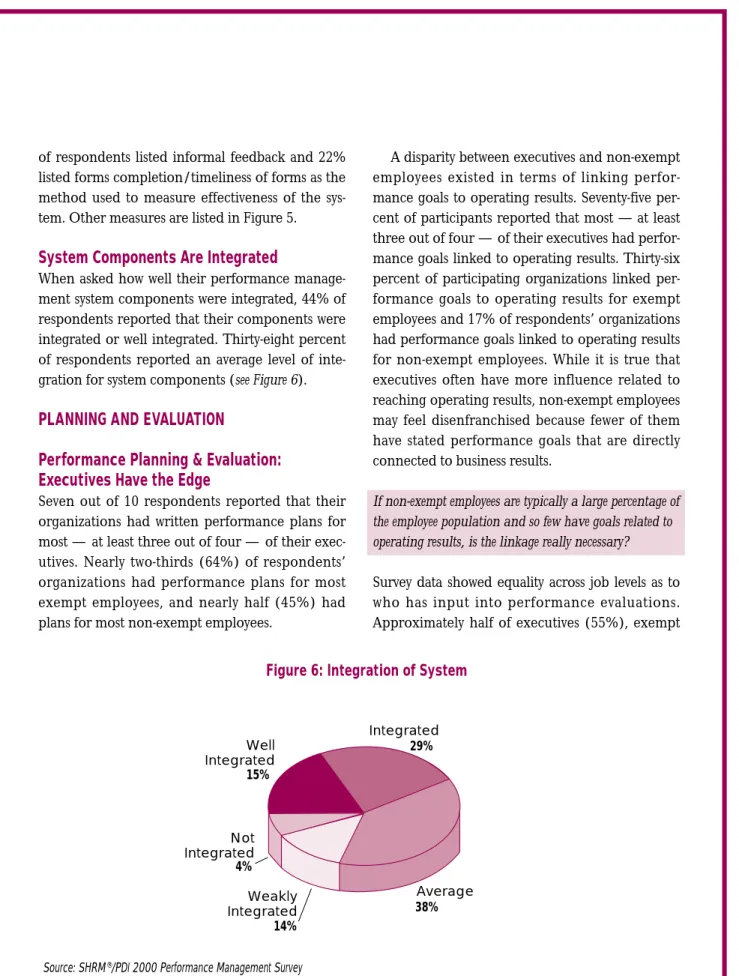
System Components Are Integrated
When asked how well their performance manage-ment system components were integrated, 44% of respondents reported that their components were integrated or well integrated. Thirty-eight percent of respondents reported an average level of inte-gration for system components (see Figure 6).
PLANNING AND EVALUATION
Performance Planning & Evaluation:
Executives Have the Edge
Seven out of 10 respondents reported that their organizations had written performance plans for most — at least three out of four — of their exec-utives. Nearly two-thirds (64%) of respondents’ organizations had performance plans for most exempt employees, and nearly half (45%) had plans for most non-exempt employees.
A disparity between executives and non-exempt employees existed in terms of linking perfor-mance goals to operating results. Seventy-five per-cent of participants reported that most — at least three out of four — of their executives had perfor-mance goals linked to operating results. Thirty-six percent of participating organizations linked per-formance goals to operating results for exempt employees and 17% of respondents’ organizations had performance goals linked to operating results for non-exempt employees. While it is true that executives often have more influence related to reaching operating results, non-exempt employees may feel disenfranchised because fewer of them have stated performance goals that are directly connected to business results.
If non-exempt employees are typically a large percentage of the employee population and so few have goals related to operating results, is the linkage really necessary?
Survey data showed equality across job levels as to who has input into performance evaluations. Approximately half of executives (55%), exempt
38% 29% 15% 14% 4% Integrated Average Weakly Integrated Not Integrated Well Integrated
Source: SHRM®/PDI 2000 Performance Management Survey
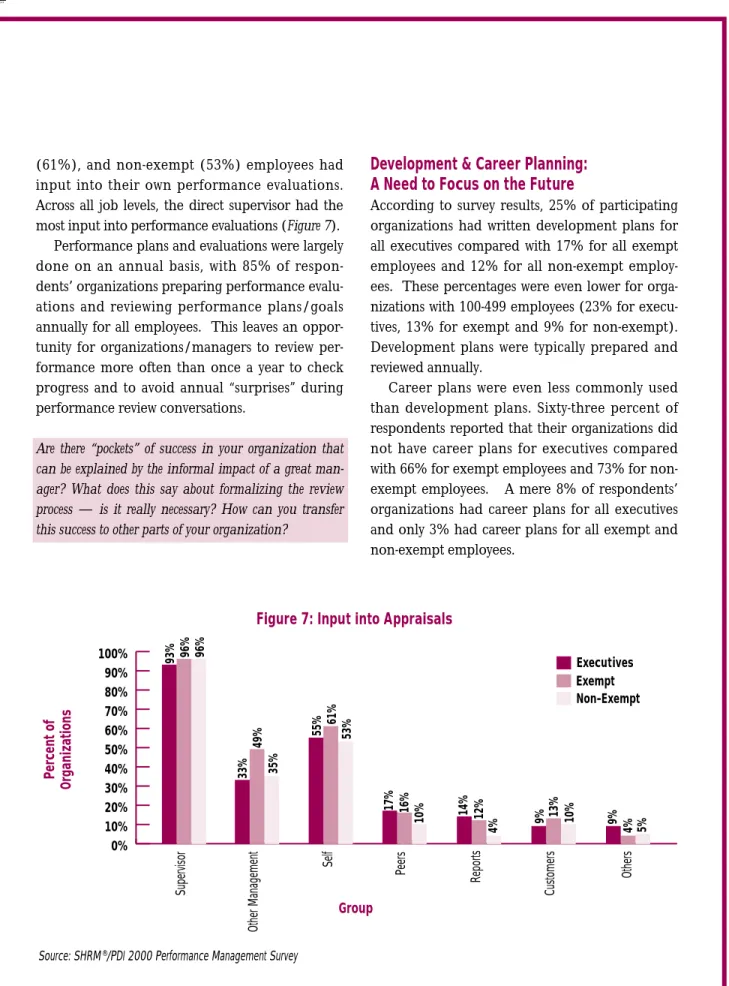
(61%), and non-exempt (53%) employees had input into their own performance evaluations. Across all job levels, the direct supervisor had the most input into performance evaluations (Figure 7).
Performance plans and evaluations were largely done on an annual basis, with 85% of respon-dents’ organizations preparing performance evalu-ations and reviewing performance plans/goals annually for all employees. This leaves an oppor-tunity for organizations/managers to review per-formance more often than once a year to check progress and to avoid annual “surprises” during performance review conversations.
Are there “pockets” of success in your organization that can be explained by the informal impact of a great man-ager? What does this say about formalizing the review process — is it really necessary? How can you transfer this success to other parts of your organization?
Development & Career Planning:
A Need to Focus on the Future
According to survey results, 25% of participating organizations had written development plans for all executives compared with 17% for all exempt employees and 12% for all non-exempt employ-ees. These percentages were even lower for orga-nizations with 100-499 employees (23% for execu-tives, 13% for exempt and 9% for non-exempt). Development plans were typically prepared and reviewed annually.
Career plans were even less commonly used than development plans. Sixty-three percent of respondents reported that their organizations did not have career plans for executives compared with 66% for exempt employees and 73% for non-exempt employees. A mere 8% of respondents’ organizations had career plans for all executives and only 3% had career plans for all exempt and non-exempt employees. 0% 10% 20% 30% 40% 50% 60% 70% 80% 90% 100% Executives Exempt Non-Exempt 93% 96% 96% 33% 49% 35% 55% 61% 53% 17% 16% 10% 14% 12% 4% 9% 13% 10% 9% 4% 5% Percent of Organizations Group
Figure 7: Input into Appraisals
Supervisor Other Management Self Peers Reports Customers Others
Organizations appear to be missing a key opportunity to retain employees. Employees who work for organizations that actively partner with them to create development and career opportu-nities are more likely to stay. This is supported by a 2000 SHRM®Retention Practices Survey finding that
a primary reason why employees voluntarily resign from their positions is to pursue career opportuni-ties elsewhere.
DEVELOPMENT
Classroom Training Popular and Preferred
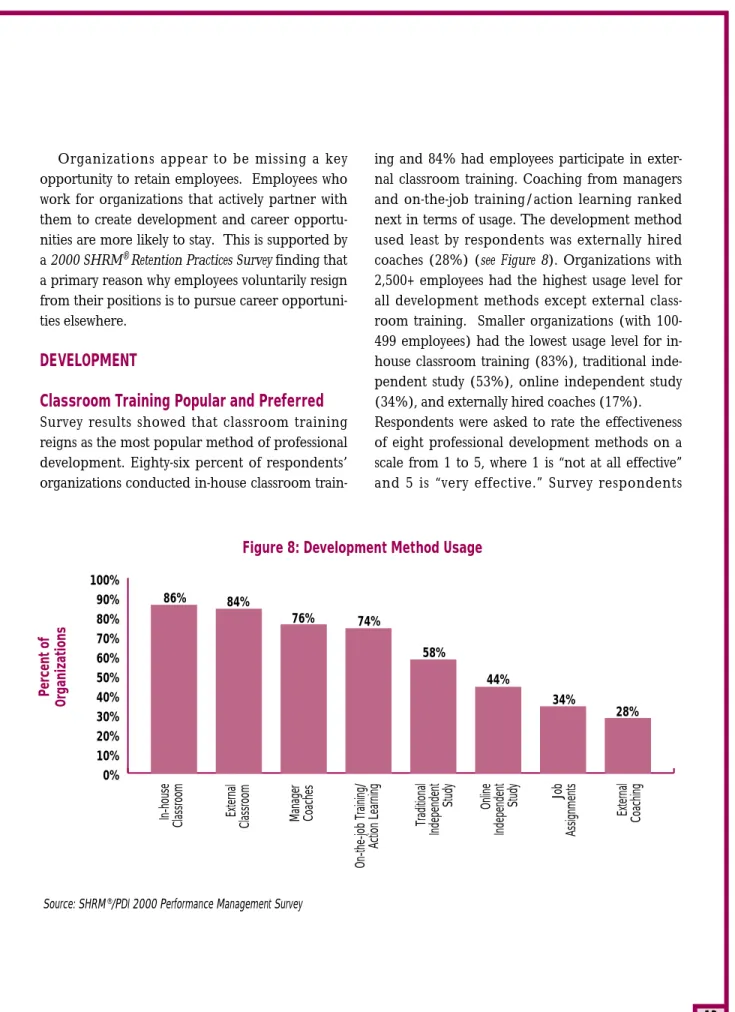
Survey results showed that classroom training reigns as the most popular method of professional development. Eighty-six percent of respondents’ organizations conducted in-house classroom
train-ing and 84% had employees participate in exter-nal classroom training. Coaching from managers and on-the-job training/action learning ranked next in terms of usage. The development method used least by respondents was externally hired coaches (28%) (see Figure 8). Organizations with 2,500+ employees had the highest usage level for all development methods except external class-room training. Smaller organizations (with 100-499 employees) had the lowest usage level for in-house classroom training (83%), traditional inde-pendent study (53%), online indeinde-pendent study (34%), and externally hired coaches (17%). Respondents were asked to rate the effectiveness of eight professional development methods on a scale from 1 to 5, where 1 is “not at all effective” and 5 is “very effective.” Survey respondents
0% 10% 20% 30% 40% 50% 60% 70% 80% 90% 100% 86% 84% 76% 74% 58% 44% 34% 28% Percent of Organizations
Figure 8: Development Method Usage
Source: SHRM®/PDI 2000 Performance Management Survey
In-house
Classroom External Classroom Manager Coaches
On-the-job Training/ Action Learning Traditional Independent Study Online Independent Study Job Assignments External Coaching
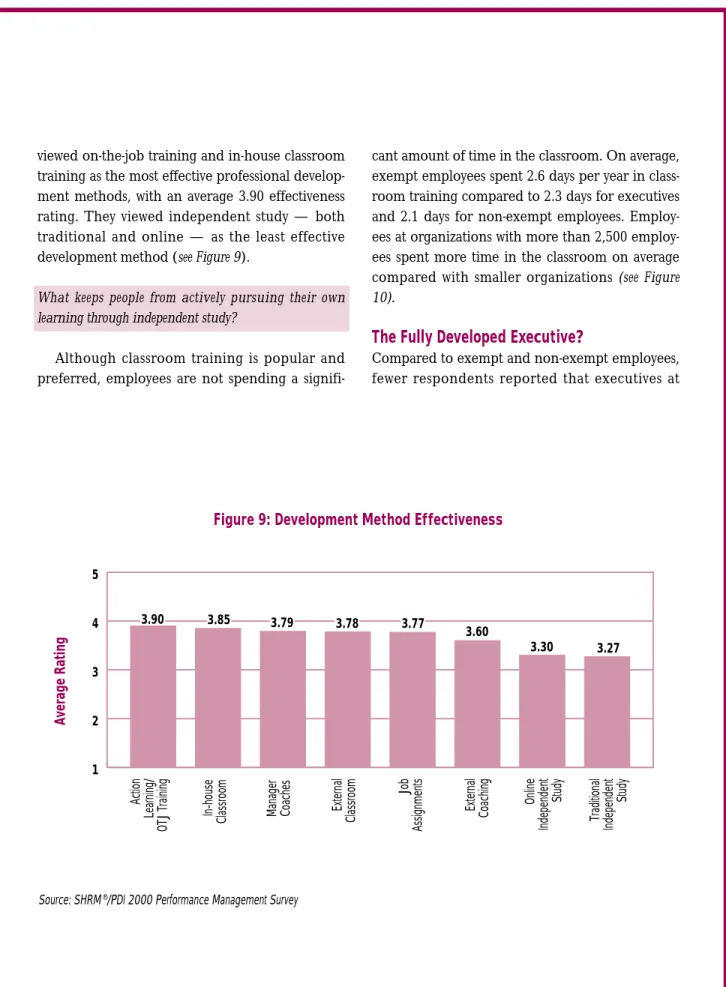
viewed on-the-job training and in-house classroom training as the most effective professional develop-ment methods, with an average 3.90 effectiveness rating. They viewed independent study — both traditional and online — as the least effective development method (see Figure 9).
What keeps people from actively pursuing their own learning through independent study?
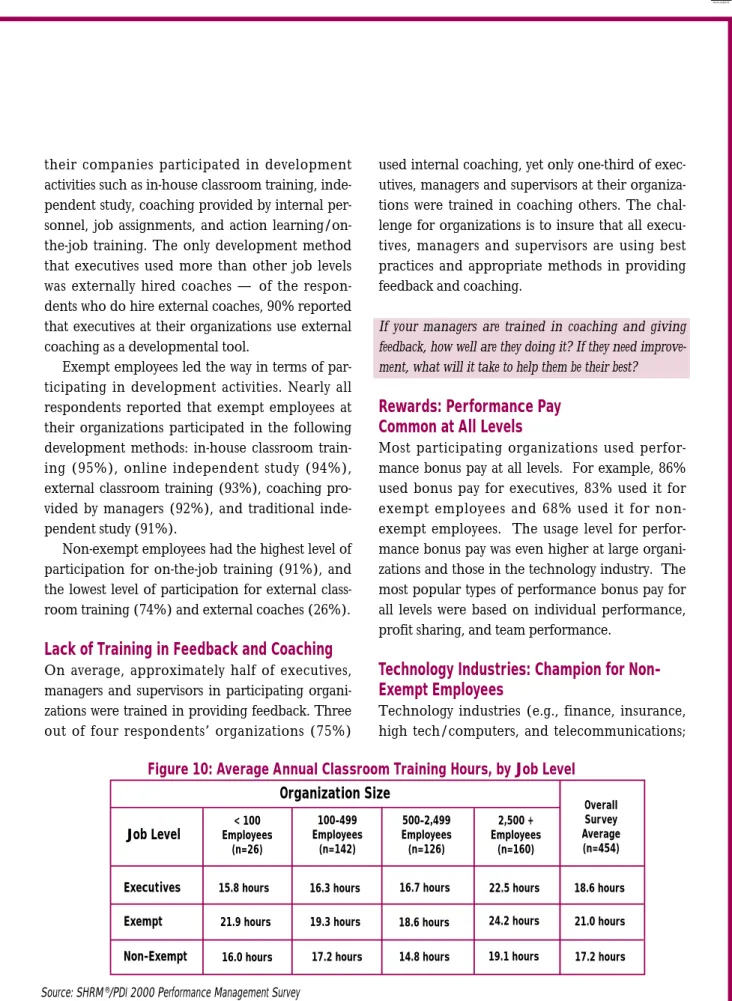
Although classroom training is popular and preferred, employees are not spending a
signifi-cant amount of time in the classroom. On average, exempt employees spent 2.6 days per year in class-room training compared to 2.3 days for executives and 2.1 days for non-exempt employees. Employ-ees at organizations with more than 2,500 employ-ees spent more time in the classroom on average compared with smaller organizations (see Figure
10).
The Fully Developed Executive?
Compared to exempt and non-exempt employees, fewer respondents reported that executives at
1 2 3 4 5 3.90 3.60 3.30 3.27 3.85 3.79 3.78 3.77
Figure 9: Development Method Effectiveness
Average Rating
Action
Learning/
OTJ Training
In-house
Classroom Manager Coaches External Classroom
Job
Assignments
External Coaching Online
Independent
Study
Traditional
Independent
Study
their companies participated in development activities such as in-house classroom training, inde-pendent study, coaching provided by internal per-sonnel, job assignments, and action learning/on-the-job training. The only development method that executives used more than other job levels was externally hired coaches — of the respon-dents who do hire external coaches, 90% reported that executives at their organizations use external coaching as a developmental tool.
Exempt employees led the way in terms of par-ticipating in development activities. Nearly all respondents reported that exempt employees at their organizations participated in the following development methods: in-house classroom train-ing (95%), online independent study (94%), external classroom training (93%), coaching pro-vided by managers (92%), and traditional inde-pendent study (91%).
Non-exempt employees had the highest level of participation for on-the-job training (91%), and the lowest level of participation for external class-room training (74%) and external coaches (26%).
Lack of Training in Feedback and Coaching
On average, approximately half of executives, managers and supervisors in participating organi-zations were trained in providing feedback. Three out of four respondents’ organizations (75%)
used internal coaching, yet only one-third of exec-utives, managers and supervisors at their organiza-tions were trained in coaching others. The chal-lenge for organizations is to insure that all execu-tives, managers and supervisors are using best practices and appropriate methods in providing feedback and coaching.
If your managers are trained in coaching and giving feedback, how well are they doing it? If they need improve-ment, what will it take to help them be their best?
Rewards: Performance Pay
Common at All Levels
Most participating organizations used perfor-mance bonus pay at all levels. For example, 86% used bonus pay for executives, 83% used it for exempt employees and 68% used it for non-exempt employees. The usage level for perfor-mance bonus pay was even higher at large organi-zations and those in the technology industry. The most popular types of performance bonus pay for all levels were based on individual performance, profit sharing, and team performance.
Technology Industries: Champion for
Non-Exempt Employees
Technology industries (e.g., finance, insurance, high tech/computers, and telecommunications;
Organization Size
Job Level < 100 Employees (n=26) 100-499 Employees (n=142) 500-2,499 Employees (n=126) 2,500 + Employees (n=160) Overall Survey Average (n=454) Executives Exempt Non-Exempt 15.8 hours 21.9 hours 16.0 hours 16.3 hours 19.3 hours 17.2 hours 16.7 hours 18.6 hours 14.8 hours 22.5 hours 24.2 hours 19.1 hours 18.6 hours 21.0 hours 17.2 hoursSource: SHRM®/PDI 2000 Performance Management Survey
organizations producing or highly dependent on rapidly changing technology) as a group led the way in using performance management tools for non-exempt employees, according to survey results.
The technology industry group also had the highest usage and satisfaction levels for all devel-opment methods other than job assignments. Not surprisingly, the biggest usage gap was in online independent study. Fifty-seven percent of
technol-ogy organizations reported using online indepen-dent study, compared with 41% of manufacturing organizations and 42% of services organizations. The technology industry group also had the high-est average annual classroom training hours for all levels (see Figure 11).
The Future: More 360-Degree Feedback
According to survey results, 360-degree feedback was used by only one-third of respondents’
organi-Figure 11: Usage of Performance Management Tools, by Industry Group
Source: SHRM®/PDI 2000 Performance Management Survey
Performance Management Tool
Technology Industry Group (n=99) Manufacturing Industry Group (n=166) Services/Other Industry Group (n=192) Performance plans for most*
non-exempt employees 60% 37% 46%
Development plans for most*
non-exempt employees 26% 17% 16%
Career plans for
non-exempt employees 35% 27% 21%
Link performance goals to operating
results for non-exempt employees 77% 63% 53%
Performance pay for
non-exempt employees 89% 71% 53%
Online independent study 57% 41% 42%
Classroom training, average annual hours per employee
Executives Exempt employees Non-exempt employees 21 hours 26 hours 23 hours 18 hours 20 hours 16 hours 17 hours 20 hours 16 hours *Denotes at least three out of four non-exempt employees
zations for executives (32%) and exempt employ-ees (29%), and only one-fifth (18%) of respon-dents’ organizations for non-exempt employees (see Figure 12). Larger organizations (with 2,500+ employees) tended to use 360-degree feedback to determine development needs and career plans. Respondents from mid-sized organizations (500-2,499 employees) reported the highest usage level for determining pay changes. Smaller organiza-tions (100-499 employees) tended to use 360-degree feedback to evaluate performance.
Although current usage is low, the near future looks bright for 360-degree feedback. Data shows it is the only specific performance management area where organizations planned to increase their activity during the next year. This is especially true for smaller organizations (with fewer than 2,500 employees). Longer term, there is opportunity for organizations to shore up their efforts in the other developmental areas that exhibited dissatisfaction such as leadership development, development planning and coaching.
Executives Exempt Non-exempt 68% 71% 82% 0% 10% 20% 30% 40% 50% 60% 70% 80% 90% 32% 29% 18%
Figure 12: Usage of 360-Degree Feedback
Source: SHRM®/PDI 2000 Performance Management Survey
Percent of
Organizations
Usage
Conclusion
The 2000 Performance Management Survey showed that performance management in organizations is in transition from a system dominated by the per-formance appraisal to a more comprehensive human resource management system that includes activities such as development and career planning, leadership development, coaching and 360-degree feedback. However, the transition is far from complete.
The biggest challenge facing HR professionals as they make this transition is to gain executive support for performance management systems. Currently, many executives are not reviewing or using the system, nor are they participating in development activities as much as other job levels. Executives need to be active “role models” for per-formance management and publicly support it in order for systems to have credibility.
According to survey results, the most important performance management system objectives were
employee-focused. However, HR professionals were not satisfied with system components that were most likely to help employees improve their performance — coaching, leadership develop-ment, 360-degree feedback and development planning. This dissatisfaction may be due to the fact that many organizations have been using tra-ditional methods (e.g. performance appraisals, dis-cipline) for a longer period of time and have only recently started to use developmental tools as part of their performance management system.
Several performance management system aspects require additional focus, including increased support and review from senior manage-ment, more emphasis on formal feedback systems, development and career planning. These aspects will allow the performance management system to reach its full potential as a tool to fully utilize the potential of the existing workforce, to retain cur-rent employees and to attract additional talent as necessary.
N
Nuummbbeerr ooff EEmmppllooyyeeeess –– TToottaall CCoommppaannyy::
Fewer than 100 employees 2%
100 to 499 employees 31% 500 to 999 employees 14% 1,000 to 2,499 employees 13% 2,500 to 4,999 employees 8% 5,000 to 9,999 employees 7% 10,000+ employees 20% No response 5% N
Nuummbbeerr ooff EEmmppllooyyeeeess –– TThhiiss LLooccaattiioonn::
Fewer than 100 employees 15%
100 to 499 employees 45% 500 to 999 employees 16% 1,000 to 2,499 employees 11% 2,500 to 4,999 employees 4% 5,000 to 9,999 employees 3% 10,000+ employees 2% No response 4% U
Unniioonniizzaattiioonn ((eexxeemmpptt eemmppllooyyeeeess iinn uunniioonnss))::
None 59%
Less than 10% of exempt
employees in unions 12%
11 to 50% of exempt
employees in unions 14%
More than 50% of exempt
employees in unions 9%
No response 6%
T
Tyyppee ooff OOrrggaanniizzaattiioonn::
Manufacturing 35% Finance/Insurance 13% Health Care 11% Services–profit 9% High Tech/Computers 5% Nonprofit 4% Transportation 4% Wholesale/Retail 4% Education 3% Government 3% Telecommunications 2% Utilities 2% Agriculture/Other 1% No response 4%
A Message from Personnel Decisions
International (PDI)
In today’s workplace, “human capital” is the prima-ry constraint in meeting organizational goals. Attracting and retaining talented employees and maximizing their performance have become of paramount importance. Thus, the role of HR pro-fessionals has never been more crucial to organiza-tional success.
At PDI, we are committed to helping the HR community succeed and believe that providing use-ful information, such as the Performance Manage-ment Survey, to HR professionals is our most important role. We are proud and excited to co-sponsor the 2000 Performance Management Survey with SHRM, and are confident that the information provided in this report has been helpful to you.
Our Performance Management Perspective
PDI is dedicated to advancing performance manage-ment practices. We believe that a holistic approach to performance management that focuses on defin-ing, measuring and, most importantly, developing capabilities is key to success. Our goal is to help our clients to advance their performance management processes so far that performance evaluations are no longer needed — employees will receive feedback and develop capabilities daily, thereby eliminating the need for an annual evaluation.
About PDI
Personnel Decisions International (PDI) is a global human resources consulting firm. Our services and tools are developed out of extensive research and more than 30 years of experience with client orga-nizations around the world. We know our services are effective because of our on-site, validated results with real clients in real business situations.
We work in partnership with our clients to pin-point their business needs, then bring together PDI consulting, services and tools to meet those needs. The solutions we create can be applied to individu-als, teams and organizations. PDI solutions help our clients to define, measure and develop capabili-ties for successful performance.
PDI has more than 20 operating offices around the world. Each office is staffed with consulting psy-chologists experienced in the cultures of their par-ticular region. Every PDI client is served by a team of people selected from one or several offices for the expertise required by the client’s business need.
For More Information:
Contact PDI for more information about our capa-bilities related to performance management or other business challenges. Call 1-800-633-4410 or visit our web site at www.personneldecisions.com for further information.
A Message from PDI
A Message from PDI
performance management, including performance planning and evaluation; development
and career planning; feedback, coaching, training and development, and rewards. All
responses are confidential.
Please complete the survey by July 28, 2000 and fax back to SHRM at (703) 836-0367 or mail to
SHRM, Survey Research, 1800 Duke Street, Alexandria, VA 22314. Or you may complete this
survey online at
http://www.surveyhost.com/perform/
. Your password is "survey".
If you have any questions about the survey, call Tom Eckstein or Sarah Kiecker, representatives for
PDI, at 800-750-4077.
1. Overall Characteristics of your Performance Management System
1a.
Using the following scale, please rate your
satisfaction with the following parts of your
current performance management system.
(Check one box per row.)
Performance planning/goal setting
. . . . .
Very Unsatisfied . .Neither . Very Satisfied NA
Performance evaluation . . . .
Development planning . . . .
360-degree feedback . . . .
Informal feedback . . . .
Coaching and/or Mentoring . . . .
Training . . . .
Leadership development . . . .
Rewards . . . .
Discipline . . . .
Overall performance management system . .
1b.
How frequently is the effectiveness of your
Performance Management System reviewed
by
Senior Company Executives?
. . .
Quarterly Semi-Annually Annually Every 2 Years Not Reviewed
Human Resources? . . . .
1c.
How is the effectiveness of your Performance Management System measured?
1d.
In your opinion, how well integrated with each other are the
components of your performance management system
(performance planning and evaluation; development and career
planning; feedback, coaching, training and development, and
rewards)? . . . .
1 Not Integrated 2 3 Average 4 5 Well IntegratedProvide information to managers for making pay decisions . . . .
Provide information to managers for making promotion/demotion
decisions . . . .
Provide documentation on performance for employee records. . . . .
Provide information to employees about perceptions of their
performance. . . . .
Provide information to employees about their development needs. . . . .
Other
2. Characteristics of Performance Planning/Goal Setting and Evaluation
2a
. What percentage of employees from each of
the following groups have WRITTEN
performance or goal plans? (Check one box
per row.)
Senior Executives
. . . .
None < 10% 10% -24% 25% -49% 50% -74% 75% -99% AllExempt . . . .
Non-Exempt . . . .
2b.
How frequently are performance evaluations
conducted
for employees in the following groups?
(Check one box per row.)
Senior Executives
. . . .
Quarterly Semi-annually Annually Every 2 Years OtherExempt . . . .
Non-Exempt . . . .
2c.
How frequently are performance plans/goals
reviewed
with employees from the following
groups? (Check one box per row.)
Senior Executives
. . . .
Quarterly Semi-annually Annually Every 2 Years OtherExempt . . . .
Non-Exempt . . . .
2d.
What percentage of performance plans for
employees in the following groups have
performance targets directly connected to
operating results? (Check one box per row.)
Senior Executives
. . . .
None < 10% 10% -24% 25% -49% 50% -74% 75% -99% AllExempt . . . .
Non-Exempt . . . .
2e
. Who has direct input into the performance
evaluation process? (Check
ALL
that
apply in each row.)
Senior Executives evaluations
. .
Direct Super-visor
Other
Manage-ment Self Peers
Direct Reports Cust-omers Others
Exempt evaluations . . . .
Non-Exempt evaluations . . . .
for each group? (Check one box per row.)
Senior Executives
. . . .
Quarterly Annually Annually Years Reviewed
Exempt . . . .
Non-exempt . . . .
3c.
How frequently are development plans
reviewed
for each group? (Check one box per row.)
Senior Executives
. . . .
Quarterly Semi-Annually Semi-Annually Every 2 Years Not ReviewedExempt . . . .
Non-exempt . . . .
3d.
Percent of employees from each group with
a WRITTEN career plan for next 2 to 5
years? (Check one box per row.)
Senior Executives
. . . .
None < 10% 10% -24% 25% -49% 50% -74% 75% -99% AllExempt . . . .
Non-Exempt . . . .
4. Characteristics of Feedback, Coaching and T&D
4a
. Which of the following development methods are used in your organization?
(Check yes or no in the first two columns below for all that are used.)
4b.
For each method used in your organization, please indicate which employee groups participate.
(Check all groups participating in the last three columns below.)
In-house, instructor-led classroom programs . . . .
Yes No
Sr.
Execs. Exempt
Non-exempt
External instructor-led classroom programs . . . .
Independent study using traditional methods . . . .
Independent study using online materials . . . .
Externally-hired coaches . . . .
Internal Coaches (HR, managers or other employees)
Systematic job assignments, job rotation . . . .
Action Learning and other On-the-Job training . . . .
4c
. How effective do you believe the following development methods are as used by your organization?
In-house, instructor-led classroom programs . . . .
Not at all Effective . Somewhat Effective . Very Effective NA
External, instructor-led classroom programs . . . .
Independent study using traditional methods . . . .
Independent study using online materials . . . .
Externally-hired coaches . . . .
Internal coaches (HR, managers, other employees) . . . .
Systematic job assignments, job rotation . . . .
Action Learning and other On-the-job training . . . .
following groups who are trained to coach
or mentor others? (Check one box per
row.)
Senior Executives
. . . .
None < 10% 10% -24% 25% -49% 50% -74% 75% -99% AllManagers . . . .
First-Line Supervisors . . . .
4f
. Average number of hours of overall classroom
training provided per year for each employee group?
(Check one box per row.)
Senior Executives
. . . .
None < 10 hrs. 11 -20 hrs. 21 -40 hrs. 41 -60 hrs. > 60 hrs.Exempt . . . .
Non-Exempt . . . .
4g.
What percent of the following employee
groups receive formal 360-degree
feedback? (Check one box in each
row.)
Senior Executives
. . . .
None
<
10%
10%
-24%
25%
-49%
50%
-74%
75%
-99%
All
Exempt . . . .
Non-Exempt . . . .
4h.
How is 360-degree feedback used
for each group? (Check all that
apply.)
Senior Executives
. . . . .
Evaluate
performance
Determine
development
needs
Determine
pay changes
Determine
career plan Do not use
Exempt . . . .
Non-Exempt . . . .
5. Characteristics of Rewards
5a
. What basis does your organization use for performance bonus pay for the following employee
groups? (Check all that apply per row.)
Senior Execs. . . . . .
Individual
Team Performance
Competency
or Skill Profit Stock None Other
Exempt . . . .
Non-Exempt . . . .
Informal feedback . . . .
1 2 3 4 5Coaching and/or Mentoring . . . .
1 2 3 4 5Training . . . .
1 2 3 4 5Leadership development . . . .
1 2 3 4 5Rewards . . . .
1 2 3 4 5Discipline . . . .
1 2 3 4 5Overall performance management system . . . .
1 2 3 4 56b.
What do you believe is the greatest challenge to improving your organization's current performance
management system?
7. Organization Characteristics
7a.
Number of Employees
in
This Location
Less than 100 100 - 499 500 - 999 1,000 - 2,499 2,500 - 4,999 5,000 - 9,999 10,000 and over7b
. Number of Employees
in
Entire Organization
Less than 100 100 - 499 500 - 999 1,000 - 2,499 2,500 - 4,999 5,000 - 9,999 10,000 and over7c.
Percent of Employees in
Unions
None Less than 10% 11 to 50% Over 50%7d.
Primary Industry
Computers, components and software Manufacturing - non-durables Manufacturing - durables Telecommunications Transportation Utilities Wholesale/Retail Finance Insurance Health Services -- profit Services -- non-profit Education Government Other:
8. Optional
Name:
Company:
Phone:
May we contact you if we need to
clarify any of your answers? . . . .
Yes NoPlease fax your responses to 703-836-0367 or mail it to SHRM, Survey Research, 1800 Duke Street,
Alexandria, VA 22314 before July 28, 2000.
Results will be available in October, 2000. SHRM members may obtain the report summarizing survey
results at no cost at www.shrm.org or may purchase a copy from the SHRM Store.
C
ompetition abounds in the business market-place as well as in the talent marketmarket-place. CEO after CEO calls for increased individual and organizational performance, while at the same time organizations wage campaigns to win the hearts and minds of employees and candidates. With this increased emphasis on performance improvement, competition for employees, and intense drive for increased retention, one would think that organizations would get better at perfor-mance management which is one of the primary organizational processes that can result in real, tan-gible improvement in performance, attraction, and retention of employees. Yet, performance manage-ment retains its untapped potential because organi-zations continue to limit it to an HR administrative system which remains surprisingly unrelated to the current or future business needs and continue to focus much of the performance management process on activities which actually serve to demoti-vate employees.Strong, effective performance management systems are one key to attracting and retaining high-value employees. Employees perform best – and stay with their employer – when they receive the proper sup-port from management, and when they know that their efforts will be rewarded. In an effective per-formance management system, goals are clearly defined, progress is tracked, feedback is provided regularly, performance is evaluated fairly and equi-tably, and career and development opportunities are available.
Despite its heightened importance, many compa-nies fail to provide strong performance
manage-ment systems. PDI believes that organizations can dramatically improve the effectiveness and rele-vance of their performance management processes by creating the foundation of the system in the organization’s competitive strategy and considering that performance management actually begins before employees even join the organization. PDI’s Talent Pipeline (Fig. C) illustrates that by aligning the business and human capital strategies of the organization from the start, a company increases its ability to identify the right people, make a compelling offer, develop a talent-building culture, and implement a strategy for maintaining great talent.
With the Talent Pipeline in mind, two major factors point toward the problems in today’s performance management systems:
• Few performance management systems are linked to the overall organization’s strategy or objectives. For example, if a company’s goal is to develop digi-tal commerce capabilities, it’s vidigi-tal for employees’ individual performance plans to include develop-ing their personal digital commerce abilities. Unless this connection between personal and com-pany goals exists, employees can easily feel that they don’t make a difference to the overall goals and success of their employer.
• Too many performance management systems are focused on measurement rather than development. Emphasizing evaluation and expectations rather than personal development puts employees on the defensive and demotivates them to participate actively in the process.
A Vital Key to Retention
By Diane Marentette
There is a better way to get the most from a com-pany’s human capital and develop a culture in which employee training and development is linked directly to the organization’s goals. But knowing what is wrong with today’s performance management systems and fixing them are two dif-ferent things. To help find the way, we first need to explore the weaknesses of traditional perfor-mance management systems.
Traditional Performance
Management Systems
A common blueprint for performance manage-ment systems includes four phases: performance planning, ongoing coaching and feedback, appraisal of accomplishments, and identifying areas for improvement. Typically, these elements follow an annual cycle.
The cycle, as illustrated here (Fig. A), begins with a planning process to set expectations for both the employee and employer. Throughout the year, the employee’s performance is guided through
ongo-ing coachongo-ing and feedback. Toward the end of the cycle, the employee’s performance is evaluated. Finally, this evaluation is shared with the employee to help improve his or her performance.
But something crucial is missing from this blue-print: This traditional system is not configured to directly support the employers’ overall goals and expectations. Beginning employee performance planning without understanding an organization’s strategy is like pouring concrete for a new build-ing’s foundation before the blueprint is finished. Securing a strategic foundation will not only build employees’ confidence in the relevance of the process, it will also make it possible to link the achievement of employees’ performance goals directly to the organization’s operating results. Currently, this isn’t happening very often, even in the upper echelons of organizations.
To lay the foundation properly, PDI contends a company must identify its strategic business goals,
T
HET
RADITIONALP
ERFORMANCEM
ANAGEMENTS
YSTEMPerformance
Planning
Identifying areas
Ongoing coaching
for improvement
and feedback
Appraisal of
Accomplishments
translate them into business plans, and incorpo-rate them into a “Performance Model” that defines the performance needs required to achieve the organization’s expectations and goals. (See Fig. B)
This performance model will spur top manage-ment to recognize the needs of the organization in human capital terms and understand the demands the organization will place on its employ-ees. For example, if the organization’s business goal is to grow aggressively in a highly competitive market, performance models should emphasize cultivating business development skills that the company doesn’t yet have. The performance model will also identify resources that must be acquired or developed to reach those perfor-mance expectations–this allocation of resources is
the true beginning of the performance manage-ment cycle. In addition, linking organizational goals with staff development will help attract exec-utive support for performance management sys-tems.
Performance Planning
The traditional system begins with a planning process intended to reveal and clarify perfor-mance expectations of both the employee and the employer. Most organizations have a very struc-tured planning process, with written goals for each employee.
When done well, the goals laid out in the perfor-mance plan are specific and comprehensive enough for employees to truly understand the organization’s needs. Often, performance
plan-Performance
Planning
Identifying areas
Ongoing coaching
for improvement
and feedback
Appraisal of
Accomplishments
Figure B
A
N
I
MPROVED
P
ERFORMANCE
M
ANAGEMENT
S
YSTEM
Strategic Business
Business
Goals
Plans
ning is not done well, however. Overall, this process can do well at clarifying expectations of both employees and the employer. However, two glaring problems complicate most performance planning processes:
1. If a performance model doesn’t exist, individ-ual employee goals may not be linked to the performance needs of the organization. The goals set during performance planning should extend from the organization’s performance needs as outlined in the performance model. 2. These goals are often simply handed to
employ-ees with little discussion of how achieving them will fulfill the organization’s needs. Therefore, employee buy-in to accomplish these goals may be low, leading to limited enthusiasm to do the work.
Ongoing Coaching and Feedback
Once goals have been established, the typical per-formance management system requires the man-ager to hold performance reviews with the employ-ee periodically and to provide ongoing coaching and feedback. This frequent communication also supplies opportunities to revisit the goals and con-sider any changes that should be made to reflect changed circumstances.
Surprisingly, coaching and feedback aren’t often regarded as very important. Few managers cur-rently provide regular coaching and feedback, and some simply don’t do it at all. And, even many human resource professionals don’t consider coaching to be an important objective of a perfor-mance management system.
Appraisal of Accomplishments
Toward the end of the cycle, the employee’s per-formance is evaluated. This information can be
used to benefit both the company and the employ-ee, such as:
• to recognize employee accomplishments • to make compensation decisions • to determine development needs
But consider the sensitivity surrounding evalua-tion. While it is important for employees to under-stand their level of performance, it is human nature for people to feel that they are doing a good job–perhaps even a great job. It can be very wounding for the ego should the performance evaluation find differently. Feeling one’s efforts are unappreciated–compounded by the compa-ny’s failure to provide help for improvement through coaching and development–demotivates employees and can perpetuate subpar perfor-mance.
Identifying Areas for Improvement
Typically, performance evaluation information is shared with the employee to improve his or her performance, usually through the use of a opment plan. Like performance planning, devel-opment planning is often dictated by the manag-er, whose suggestions for improvement are expect-ed to be actexpect-ed upon whether the employee believes in it or not. Yet without the employee’s agreement that improvement in a specific area is necessary, it is very unlikely that any real improve-ment will happen. What’s more, if these areas of improvement are not linked closely to organiza-tional goals, the employee will see even less reason to work to improve.
Overall, there are two main weaknesses of the tra-ditional performance management system. First, employees are often not clear how their perfor-mance goals link to the companies’ needs and
expectations — whether because no performance model was created or because the link was not explained to the employee. And secondly, not enough value or effort is given to supporting the employee’s ability to perform at their best.
A Better Way – PDI’s Talent Pipeline
While most traditional performance management systems don’t even start to engage employees until after they’ve been on the job for months, PDI believes that optimizing employee performance begins even before the person is hired.
Managers, co-workers and the general work envi-ronment all affect employee performance. The Talent Pipeline outlines five specific junctures that have a critical impact on how well employees per-form.
Attract
As soon as the performance model identifies a need to fill or create a position, the company must identify its current and future expectations for that position. This will help the company define a compelling value proposition for candidates and market that message to the right audience. The company needs to communicate that it expects its employees to be constantly learning
and growing so they perform well in their current and future roles. In return, the company offers its employees the opportunity for continuous learn-ing and the chance to grow into new, more inter-esting and rewarding roles.
Select
Screening and pre-employment testing processes can help determine if the candidate has the skills and personality traits that match the company’s expectations. Then, for much the same reason, those expectations should be discussed with the candidate during the interview process. The inter-view is an opportunity for candidates to share what motivates them and what they expect from their career and their employer. This communication is critical for finding the right person — someone who possesses the required competencies, has the ability to adapt to changes in expectations as future requirements become necessary, and who is a likely fit with the organization’s culture and values. The employee must clearly understand the expec-tations of the job — or at least have a “realistic pre-view” — in order to decide whether he or she is a right fit for the company and the position. Align-ing the company’s needs with those of the poten-tial employee is critical to maximizing the perfor-mance of each new employee.
Business
Strategy
Human
Resource
Strategy
PDI’
S
T
ALENT
P
IPELINE
Performance Model
Attract Select Mobilize Develop Retain
Mobilize
Once an employee is hired, he or she needs to be mobilized to do the job and meet or surpass expectations. This means the company and the manager need to communicate clear and accurate expectations. The employer must orient the employee to the organization and his or her new role, and provide the training needed for the employee to perform the job.
The culture of the organization and context of the work will greatly affect how successful the employ-ee will be. Along with day-to-day information about how to use the fax machine and where to pick up a paycheck, companies must help the new employee begin to understand the unwritten rules of working within the organization’s culture – those things that can’t be understood until they are experi-enced. The company must take care to integrate new employees into company activities, group meetings and social events to help them under-stand the organization’s culture and heritage, what it stands for and how it operates. Lessons learned and mindsets locked in during this acclimation process can last the entire tenure of a person’s employment, affecting the performance and suc-cess of both the employee and the organization. Mobilizing requires ongoing evaluation, feedback and adjustments, and is frequently the driver behind traditional performance management sys-tems. However, key characteristics of successful mobilization are: 1) the regular clarification of performance expectations, and 2) the ongoing feedback and coaching provided to help the employee perform at his or her best immediately and consistently.
This is not a one-sided process. The manager and the employee must work together to ensure buy-in
and even enthusiasm for meeting expectations, being open to feedback, and regularly exchanging ideas about how everyone involved can achieve their best and the company’s best. PDI developed the GAPS Model (Fig. D) to highlight the critical information needed during the mobilization process.
G
Gooaallss aanndd vvaalluueess::The only way to ensure people
will perform their best is to understand what moti-vates them. Managers should not assume they know what matters to employees – they must ask them. Regular conversations about what gets them charged up, what they like to do, and what they care about will help the manager understand what drives their behavior. The more that is known about an employee’s personal interests, val-ues, desires, work objectives and career aspira-tions, the better prepared the manager is to talk about their performance.
A
Abbiilliittiieess::Managers must explore the employee’s
view of his or her own capabilities, style and per-formance – especially in relation to important goals, values and success factors. This provides great information about how employees see them-selves compared to how others see them.
P
Peerrcceeppttiioonnss::Managers should share with
employ-ees how others perceive their capabilities, style, performance, motives, priorities and values. Oth-ers’ perceptions aren’t necessarily true, but they do represent a slice of reality. It is the manager’s role to help the employee understand the reality created by identified perceptions and to help them decide whether they can be successful in that setting. This can be the basis of change, once an employee understands how his or her own goals may not be met successfully without his or her attention.
S
Suucccceessss ffaaccttoorrss:: Managers must clarify what
mat-ters to other people in the organization, including the manager as well as others important to the employee’s success, such as senior management, peers and direct reports.
Once the dialogue between the manager and employee has strengthened to a point where infor-mation is available to both in all “cells” of the GAPS model, related and important conversations can take place.
• Is there a gap between what the organization expects of the employee (success factors) and what the employee wants to do (goals and values)? • If so, is it possible for both to be accomplished? • If not, is this job or even organization the best place for this employee to be successful?
• Is there a disconnect between what the employ-ee thinks he or she is good at (abilities) and what others perceive (perceptions)?
• What impact is that having on the employee’s ability to accomplish his/her own goals?
Throughout the mobilization process, these conver-sations deepen the commitment to high levels of performance, as well as help the manager and the employee understand the constraints to achieving it.
Develop
Because evaluation and feedback are part of mobi-lizing an employee, it is important to follow up with opportunities for the employee to develop in the areas where he or she needs or wants to improve. An employee who is encouraged and enabled to develop his or her skills will be much more satisfied and loyal to the employer. Also,
GAPS
Where the
person is
Where the
person is going
The
Person’s
View
Other’s
Views
ABILITIES
How they see themselves
GOALS & VALUES
What matters to the person
PERCEPTIONS
How others see the person
SUCCESS FACTORS
What matters to others
Figure D
increasing an employee’s versatility, adaptability, and effectiveness for future assignments and chal-lenges will make him or her a more valuable and valued employee.
The organization’s culture is critical to develop-ment. The Successful Executive’s Handbook (PDI, Oct. 1999) lists ten characteristics of an environ-ment that supports employee developenviron-ment: • Open discussions with people about perfor-mance and development needs are common. • People feel like they get honest feedback. • People feel responsible to focus and meet their objectives.
• Leaders encourage others to take appropriate risks to pursue learning.
• People are willing to try new things.
• New ideas and fresh perspectives are welcomed. • People can challenge the status quo.
• The culture encourages people to do new things. • People are held accountable for meeting objec-tives and delivering on commitments.
• People trust their leaders to walk their talk. Enhancing the organization’s culture to support development has a tremendous impact on enhanc-ing performance of individual employees. When employees can expect honest, candid feedback on all aspects of their performance, they will work harder to avoid unpleasant feedback and generate positive feedback. If employees are encouraged to be curious and challenge the barriers that stifle their performance, they are more likely to
improve their ability to overcome those barriers. Finally, if employees are held accountable for enhancing their performance, the organization will see the support of development throughout the culture.
Retain
Employee turnover costs companies both hard and soft dollars. It is expensive to interview, hire and train someone. Plus, an employee’s departure can cause poor customer service, reduced morale and employee uncertainty. The time and energy it takes to hire a new employee pays off only if the employee was right for the job in the first place and stays with the company.
Many elements affect retention, including the level of compensation and benefits, work environ-ment comfort, relationship with co-workers and boss, feelings of being appreciated, and personal factors that are completely uncontrollable by the company. However, the connection between enhancing performance and retention is strong — when people are actively and passionately pursu-ing bepursu-ing their best, they are less likely to leave. By the time the employee is being provided with development, it should be clear which employees are not a good fit with the position or the organi-zation. Releasing with dignity those who don’t fit and helping them find other opportunities is not a punishment. In fact, it is just one more step neces-sary to help them achieve their best performance and be personally successful.