WORKING PAPERS
Agricultural Policles
Agriculture and Rural Development Department and the International Trade Department
The World Bank March 1993
WPS 1116
Implications
of Agricultural
Trade Liberalization
for the Developing
Countries
Ant6nio Sa'i-r P. Brandao
and
Will Martin
Global trade liberalization - reducing both negative and
posi-tive protection in line with the Dunkel proposal - would gain
developing couniries an estimated $60 billion a year.
olicy RewCachWoikingPaper din n ethe findinge of woikin proges and encouagethe exchange of ideas amnongBank staff and otloh nemsted in dcvclop1naues. Thesepaperx.disEibutedby theReserchAdvisoy Staff, carythcnames oftheauthors,reflect
onlyt bdrviewo, andd Bauldbeuand citsd accordingly. lefindiagsent, oietations, acadeonclusionsa:theathors'own.leyshould not be attnamted to the Wodld Bank., its Board of Dircos, its man tgemata, or any of its memnber countries.
Public Disclosure Authorized
Public Disclosure Authorized
Public Disclosure Authorized
Agricultural Pol- 'e
WPS 1116
This paper-ajoint product of the the Agricultural Policies Division, Agriculture and Natural Resources Department, and the Intemational Trade Division, Intemational Economics Department - is part of a larger effort in the Bank to assess the imr.plications of trade policy reforms. The study was funded by the Bank's Research Support Budget under research project "Implications of Agricultural Policy Reform for Developing Countrics" (RPO 676-11). Copies of this paper are available free from the World Bank, 1818 H Street NW, Washington, DC 20433. Please contact Dawn Gustafson, room S7-044, extension 33714 (March 1993, 39'pages).
Brandso and Martin examine the implications for suffer overall losses, and those would be small in the developing countries of a range of liberaliza- relation to overaU gains.
tion proposals along the lines of the Dunkel
proposal. First, the analysis considers liberaliza- If developing countries had chosen not to tion in the OECD countries alone, then global participate in the Round, and to rely on liberal-liberalization of all (positive and negative) ization only by the industrial countries, their protection. Since the current Dunkel proposal gains would have been less than $1 billion -requires reduction only in positive assistance, and a number of important regions would have this specific proposal is assessed. Finally, the suffered significant welfare losses.
implications of the developing countries acting
alone, perhaps in the absence of a successful The gains to developing countries could be Uruguay Round, are evaluated. greatly enhanced by a more comprensive
liberal-ization. If developing countries reduced all Virtually all research on agricultural trade agricultural distortions, including agricultural liberalization has focused oni the case of total taxation, by the proportions specified in the liberalization, an unlikely outcome in the near Dunkel package, their total gains would increase future. The earlier work p. -vides useful insights to almost $60 billion a year - even without into the effects of partial liberalization on world productivity gains stimulated by rising world prices, but may be misleading as a guide to the prices for agricultural commodities.
welfare implications of partial liberalization in a
second best context of continuing distortions in With productivity gains taken into account, both agriculture and manufacturing. total gains from partial reform would be more
than $1 SO billion a year for non-OECD econo-Brandao and Martin consider partial liberal- mies.
ization along the lines of the Dunkel proposal: a
reduction of 36 percent in (positive) border The predicted gains are greater here than in protection and 20 percent in domestic support in earlier studies because Brandao and Martin have industrial countries, with smaller reductions in included more commodities and the welfare developing countries. This partial reform would measure explicitly considers the partial naiure of produce gains of $20 billion a year for develop- the liberalization being considered.
ing countries. These benefits are widely spread among developing countries. Few regions would
ThePo|cy ResexchWorking Produced by the Policy Research dis of wor der way Cn therBan. Anobjiveof the series
is to get these findings out qliickly, even if presentations aic- less than fully polished. The fmdings, interpretations, and conciusions in these papers do not necessarily represent of fic;al Bank policy.
the Developing Countries
by
Antonio
Salazar
P. Brand&o*
and
Will Martin**
* World Bank and Escola de Pds Graduagao em Economia da Funda;Ao Gettlio Vargas in Rio de
Janeiro (on leave). ** World Bank.
Table of Contents
1. Introduction 1
2.
The Pattem of'Agricultural Protection
3
3.
Recent Studies of the Impact of Agricultural Liberalization
7
Model results
8
4.
Implications of Agricultural Liberalization for the
Developing Countries: Results from the RUNS Model
12
Model results
15
5.
Summary and Conclusions
23
References
26
1. Introduction
The Uruguay Round has been the most complex of the eight rounds of multilateral negotiations among the contracting parties to the General Agreement on Tariffs and Trade (GATr). With tariffs on most manufactured goods already reduced to low levels in developed countries, issues put aside in earlier rounds have been brought to the forefront of the discussions. Agriculture has assumed a key role in the process and the conclusion of the Round has been delayed several times primarily because of difficulties in reaching an agreement on agriculture.
Substantial progress towards an agreement on agriculture has been made. The US and the Cairns group have drawn back from their initial bold proposals for complete elimnination of subsidies and the EC has proposed to undertake significant reforms of its own agriculture (Ar.drews, Roberts and Love 1992). However, significant differences on the approach to reform, on adjustment of border measures, domestic support and market access, mainly (but not uniquely) between the US and the EC positions, persisted until recently.
The exclusion of agriculture from previous GAIT Rounds has meant that national agricultural policies have been largely outside the disciplines imposed on other traded goods. The resulting situation has been aptly described as one of "disarray" in which a plethora of
' The authors would like to express their gratitude to Marinos Tsigas for his assistance in running the experiments and particularly for introducing the US set-aside policy into the RUNS model for this paper. Thanks are also due to Rod Tyers for valuable comments on an earlier draft of the paper. The views expressed here are those of the authors and should not be attributed to their respective organizations. This paper is part of a joint World Bank/OECD Development Centre study of agricultural trade liberalization and was prepared for inclusion in a Special Issue of Agricultural Economics on Trade and Development. It is
being made available in this form because of current interest in the issue of agricultural trade reform.
distortionary policies have been applied: sometimes to raise domestic prices relative to world prices; sometimes to lower domestic prices; and frequently to insulate domestic prices from movements in world prices. Much of this intervention has ultimately been self-defeating, with the combined effects of national policies designed to raise and stabilize domestic prices being to depress and destablize the world prices to which virtually all domestic prices are linked in the long run (Mundlak and Larson 1992). In developing countries, in particular, the agricultural sector is also typically burdened with indirect taxes imposed through protection to the manufacturing and services sectors. There is increasing awareness that the costs of policies in developing countries are typically greater than they first appear (Krueger, Schiff and Valdes 1988, 1991).
Increasing awareness of the contradictory global effects of independent national policies and of their full costs has contributed towards a desire for reform of which the
inclusion of agriculture in the Uruguay Round is one manifestation. Another important type of reform has been occurring at the national level, with many countries moving towards reform of their agricultural policies to reduce the budgetary or social costs. Some liberalization is also occurring through the formation of regional trading blocs such as the North American Free Trade Agreement. Another, more fundamental type of reform is occurring in the formerly centrally planned economies whose agricultural sectors are being radically restructured.
The Uruguay Round is the first in which the developing countries have played an important role and a numuer of these countries have been influential in the agricultural negotiations. Developing country food exporters have played an active role in the Cairns group supporting liberalization with a view to raising world prices of their exports. Food importers have raised concerns about the likely impact of the policy reform on world prices of agricultural commodities and about their capacity to bear a higher import bill, although recent analysis suggests that, given the typical structure of developing country policies, many food importers are likely to gain from multilateral trade reform (Loo and Tower 1990, Anderson and Tyers 1991).
How are the developing countries going to be affected by a liberalizing outcome from the Uruguay Round and the unilateral agricultural policy reforms occurring in parallel with the Round? The answer to this question depends heavily upon the type of policy reforms undertauen and on the characteristics of these countries. As we shall see in this paper, the effects on a particular country will depend heavily upon whether it participates in the liberalization and hence reaps efficiency gains. In addition, it will depend upon their trading position in the commodities affected: in general, importers would be expected to benefit from reforms which lower the prices of their imports, and exporters to gain from price rises, but this need not always be the case in the real world situation where sizeable distortions remain after a partial trade reform.
In this paper we review several quantitative assessments of the possible implications of the Uruguay Round, focusing on the effects on developing countries. This is done as follows: section 2 provides some background for the rest of the paper with a brief discussion of the agricultural policy distortions whose liberalization is to be examined; se,, -ion 3 reviews the results of previous studies which have examined the impact of agricultural liberalization at a disaggregated level; section 4 presents results of a partial liberalization analysis using a world trade model, RUNS (Rural-Urban/North-South), which has recently been updated in a joint research project of the World Bank and the OECD Development Centre (Goldin, Knudsen and van der Mensbrugghe). In section 5 some concluding remarks are offered.
2. The Pattern of Agricultural Protection
In the early stages of development, the relatively large share of agriculture in the economy and in exports and the relative ease of collection of border taxes have predisposed governments to taxing agricultural exports. The relatively high costs associated with effective political organization of large numbers of producers in remote rural areas and the resulting political weakness of the farm sector relative to urban interests have also greatly strengthened this tendency. Many analysts now argue that developing countries have frequently taxed agriculture beyond the level which achieves the desired policy objectives.
Untargeted subsidies to urban consumers through price controls, overvalued exchange rates and mechanisms of industrial assistance frequently also impose a serious burden on developing ccuntry agriculture.
The World Bank undertook a major study of agricultural pricing policies in place in 18 "representative" developing countries2 during the period 1960-84 (Krueger, Schiff and Valdes 1988, 1991). One of the objectives of the study was to uncover the nature and extent of taxation of agriculture in these countries. An important feature of the study is the use of a common methodology which allows intercountry comparisons. Schiff and Vald6s (1992) have analyzed the broad characteristics of price interventions in the 18 countriMs. Some of their findings are summarized below:
a. Most of the sample countries taxed the agricultural sector, with the tax rate being highest in the poorest countries. The countries with the highest level of per capita income, Korea and Portugal, protected agriculture during the period.
b. The effects of indirect policy measures (exchange rate overvaluation and industrial sector protection) were typically stronger than the effects of direct policies for most countries. The average rate of direct agricultural assistance was -7.9 percent, while the average total rate of assistance was -30.3 percent.
c. Direct policies tend to be used to protect importable commodities even when these are staple foods. Exportables are frequently taxed. On average, the rates of direct assistance for staples and importables were 6 and 14 percent respectively. The corresponding average total rates of protection were -16.5 and -8.6 percent respectively. For exportables, direct (negative) protection averaged -12.6 percent and total (negative) protection averaged -34.6 percent. For all countries total protection for exportable
2Argentina, Brazil, Chile, Colombia, Cote d'Ivoire, Dcmnican Republic, Egypt, Ghana, Korea, Malaysia, Morocco, Pakistin, Philippines, Portugal, Sri T anka, Thailand, Turkey, and Zambia.
commodities was negative, though its level was very low for Portugal.
d. Two of the three Sub-Saharan countries included in the sample, Cote d'Ivoire and Ghana, had positive total protection of staples and importables. The average for Sub-Saharan Africa was negative due to the extremely high taxes imposed in Zambia.
e. Other countries .hat protected staples and importables, taking into account direct and indirect policies, were Brazil, Korea, Malaysia, Portugal, and Sri Lanka.
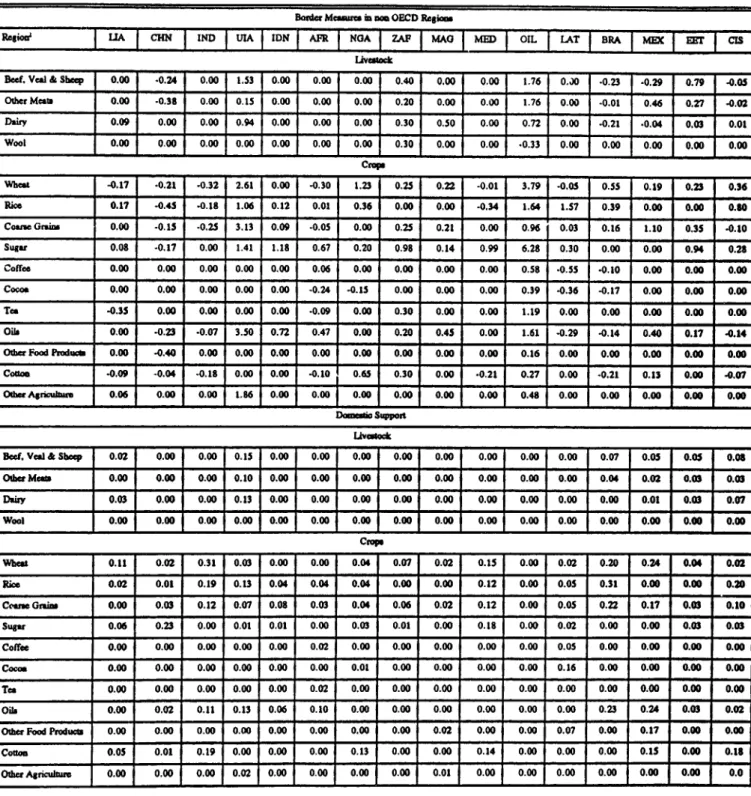
The protection database compiled for the RUNS project provides another, more recent, indication of agricultural protection levels in developing countries. This database was compiled largely on the basis of data on agricultural trade distortions collected by the Economic Research Service (ERS) of the USDA3 (see Webb, Lopez and Penn, 1990) supplemented, where necessary, with estimates from the Krueger, Schiff and Valdes study. The estimates used were averages for 1985 to 1987, a period for which a reasonably wide coverage of countries is available. Regional averages were formed from production weighted averages of the available national estimates. The estimated rates of assistance (expressed as a percentage of undistorted values) were divided into two categories: the first being border protection measures which introduce a distortion between internal prices and world market prices; and the second being assistance provided directly to producers.
A number of pattems are evident from the assembled data, shown in Table 1:
a. Upper Income Asia protects the majority of agricultural commodities heavily. This is consistent with the results of Krueger, Schiff and Valdes and others who have noted the tendency for the higher income countries to protect agriculture.
3 We are grateful to Carlos Mabbs-Zeno and Renata Penn of the ERS for supplying as yet unpublished estimates prepared after publication of the Webb, Lopez and Penn (1990) volume.
b. China taxed most agricultural commodities heavily in the sample period.
c. Rice and sugar are typically protected with China being an important exception in the case of rice.
d. Coarse grains are also typically protected. Exceptions were China, Africa and India.
e. Nigeria, an oil exporter, protected most commodities. However, it taxed cocoa, a nonfood exportable.
f. In the other regions, a mixed pattern of taxation and protection is evident.
While these results confirm some of the findings of Krueger, Schiff and Valdes, they also highlight the fact that the pattem of protection in the developing countries is quite diverse. Taxation of agriculture continues to be an important component of the policies adopted in these regions, but protection, sometimes at high rates, is observed for a number of commodities and regions.
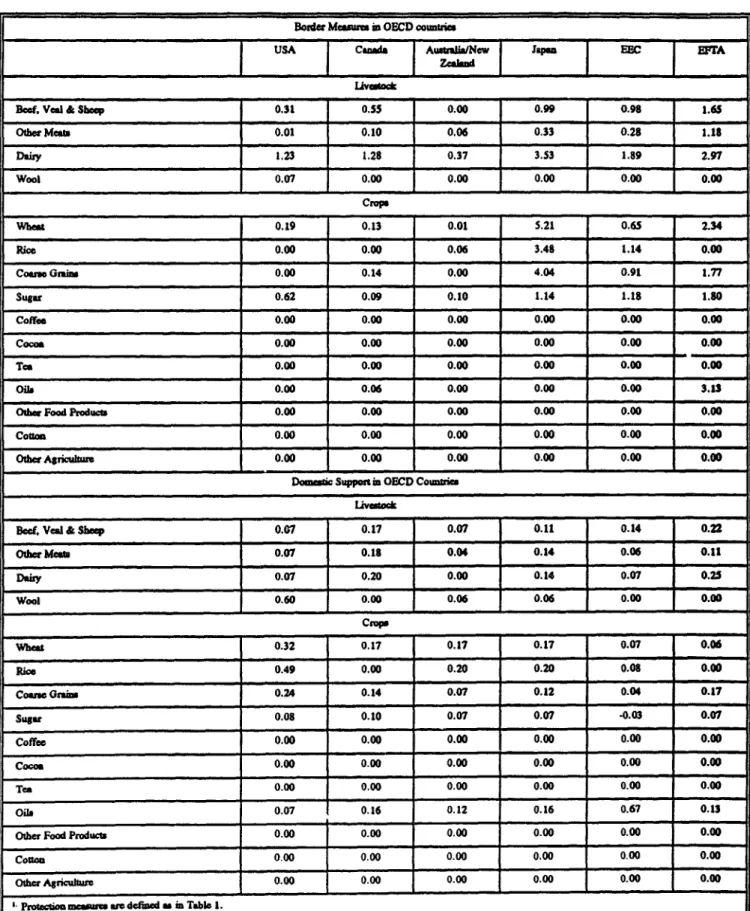
Estimates of the assistance (taken from OECD, 1991) provided to their agricultural sectors by the OECD countries are presented in Table 2. By contrast with the developing countries, direct assistance to agriculture was always positive for both border protection measures and domestic subsidies. Commodities such as dairy products and sugar were heavily supported in virtually all developed countries and beef, veal and sheep meats were heavily assisted by border measures in all but Australia/New Zealand. For most other major temperate commodities, rates of border assistance were high in Japan, the EC and EFTA, but low in the more land-abundant regions (the USA, Canada and Australia/New Zealand).
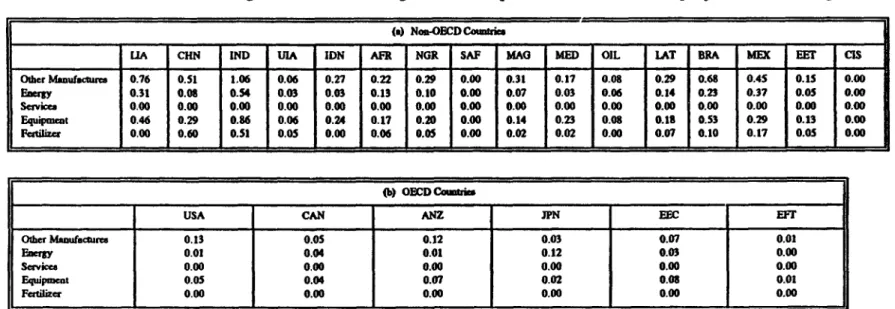
Since the RUNS model is fully general equilibrium in scope, it can take into account the effects of agricultural protection/taxation in the context of distortions in other traded
goods markets. Estimates of average protection rates in each RUNS region to four aggregate non-agricultural commodities (energy, fertilizer, machinery and other manufactures) were compiled by Roland-Holst (1991) and are reported in Table 3. From these estLiates, it is clear that rates of protection to the manufacturing sector in developing countries were typically positive and higher than the rates of assistance to agriculture. By contrast, manufacturing sector protection was much lower than assistance to agriculture in the developed couintry regions.
3. Recent Sltdies-ofheImpaMt f rigitural Liberalization
Perhaps fortunately, the commencement of the Uruguay Round closely followed the development of large scale agricultural trade models able to provide answers to the fundamental questions arising in the implementation of global agricultural trade liberalization. The models allow the instruments manipulated by policy makers such as tariffs and quotas to
be linked to ultimate objectives of trade liberalization such as national welfare and distribution, thus avoiding the need to focus exclusively on proximate targets such as trade creation4 whose implications may be very misleading. The attention given to agricultural trade liberalization in the Round greatly stimulated the development of trade models during the 1980s. The model results. and the insights generated, were made widely available and appear to have influenced the positions of many of the negotiators.
Global agricultural modeling is a complex balancing effort, with a difficult balance to be drawn between capturing the central features of the issue and retaining a workable model. The agricultural sector is extremely diverse, with multiple outputs from a common resource base being the nr:ii; and with the agricultural resources of countries being strongly differentiated, requiring the inclusion of a relatively wide range of commodities. Vertical
4Rules of thumb based on estimates of trade creation such as that suggested in The Economist (1992, p.S5) ... for countries previously separated by quite high trmde barriers, the gain in welfare due to trade liberalization equals about one fifth of the expansion of trade' cannot be expected to give reliable results in a multilated context.
market linkages, particularly for feed grains, introduce further complexities.
In addition, the
long absence of agriculture from GATI disciplines has contributed to the plethora of
domestic and trade policy instruments, many of which are non-transparent
and difficult to
model.
Without full trade liberalization
being a possibility, the negotiations
have remained in
the notoriously
diffict'lt domain of second best welfare evaluation
where nothing is known in
general about the welfare consequences
of a single liberalization.
Only if a model is carefully
specified to deal with this problem can definitive welfare conclusions be obtained. Second
best approaches to welfare evaluation are likely to be important within agriculture, where
there is generally considerable
diversity between commodities
in levels of assistance and also
bo.tween
agriculture and the remainder of the econamy. The importance of this point was
higilighted by the striking findings of Loo and Tower (1990) that net food importers could,
uiider realistic circumstances,
gain from higher world prices.
In most models, productivity
growth has been viewed as exogenously
determined. In
the sAirit of modern endogenous
growth theory, however, some of the more recent studies of
agricultural trade liberalization
(e.g., Anderson and Tyers 1990; Brandao, Tsigas, van der
Mensbrugghe and Goldin 1992) have incorporated an endogenous, positive response of
research ans development and hence technology to the level of producer prices. With
liberalization in the developed countries, producer prices tend to fall in the developed
countries and to rise in the developing
countries, so that technical progress accelerates
in the
developing
world relative to the developed
countries.
Model results
While the ultimate objective of trade liberalization policies must be to enhance
welfare, much of the modeling work has focussed upon an intermediate
effect: the impact of
liberalization on world prices of agricultural commodities. Most studies, except the
own-and cross-price effects own-and there has been a tendency for the elasticities used to converge over time, particularly once extensive compendia of agricultural elasticities became available (Sullivan, Wainio and Roningen 1989). There has also been a marked tendency towards convergence in the estimates of the magnitude of the policy-induced distortions, with heavy reliance placed on the estimates collected by the OECD for developed countries and the USDA (ERS) for developing countries.
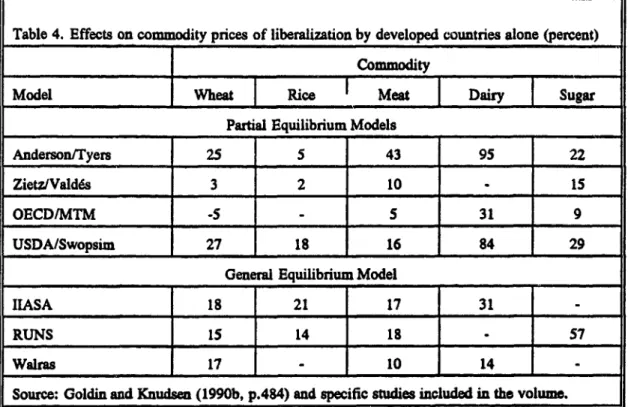
Comparable estimates of the effects of trade liberalization on agricultural prices have been produced by several studies. Most of the models have been used to provide indications of the consequences of trade liberalization in developed countries. A summary of the estimated impacts on world prices of major commodities from these studies is given in Table 4.
While there is considerable variation in the results presented in Table 4, there are also some consistent patterns. With agricultural protection eliminated, supply from the developed countries falls and the world prices of most commodities are, in most cases, predicted to rise. The prices of the relatively heavily protected dairy, sugar and meat commodities are generally estimated to rise by more than other commodities. Wheat prices are generally expected to rise substantially, reflecting the removal of the high average rates of protection in the developed countries. There is, however, an important caveat on this last-mentioned result, associated with the generally crude treatment of agricultural protection in the models: once the effects of supply-reducing features of current policies are considered, output in the United States and in some other developed country suppliers may increase and prices could fall (Whalley and Wigle 1990). For virtually all of the studies, the price of rice is expected to rise by less than the price of all of the other grains. This result reflects the relatively minor importance of t.he developed countries as a group in the world rice market.
Although there are exceptions to the rule, there is a tendency for the price rises estimated by the three models listed at the bottom of the table, the general equilibrium models, to be somewhat less than the estimates obtained from the partial equilibrium models.
This result likely reflects the greater substitution possibilities in the general equilibrium models, where the flow of resources between sectors is explicitly incorporated.
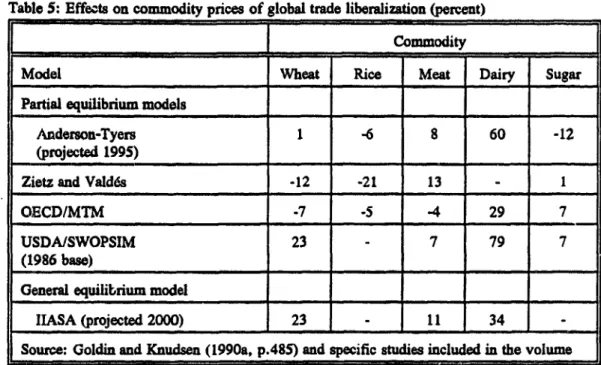
Much less evidence is available on the consequences of liberalization involving both the developed and developing countries since most modeling efforts have focussed on OECD policy liberalization alone. The set of available estimates of the effects of simultaneous liberalizption in both developed and developing country markets is presented in Table 5.
The estimates presented in Table 5 involve the removal of the frequently positive protection in developed countries and the frequently negative protection in the developing countries. The estimates thus refer to a broad-based move to liberalization of all agricultural trade distortions, including negative producer distortions whose removal is unlikely to be required by a GATI agreement. The effect on rice is very clearly reversed relative to the OECD liberalization case, with the negative protection in the developing world outweighing the positive effect from the developed countries. The positive effects on wheat prices are reduced or reversed in most cases. However, the picture is less clear cut for dairy products and meat where many developing countries provide positive assistance. The estimates of the consequences of including developing country liberalization are far more diverse than the estimates for developed country liberalization alone, in part because of the poor quality of the estimates of developing country policy distortions available to these studies and in part because of the frequently offsetting nature of the distortions in developed and developing economies.
The available evidence on the effects of liberalization on welfare in the developing countries is even more limited and diverse than the evidence on world prices. Most early research tended to focus on the temperate agricultural products primarily exported by the developed countries and concluded that developing countries, as net importers of these products, would lose from liberalization-induced price increases. Once developing country liberalization is included, this linkage becomes somewhat less consistent, with world prices of commodities produced subject to negative assistance in developing countries falling, and
with the developing countries themselves experiencing efficiency gains as a consequence of the removal of their own policy distortions. The results obtained also depend heavily upon whether allowance is made for endogenous productivity growth.
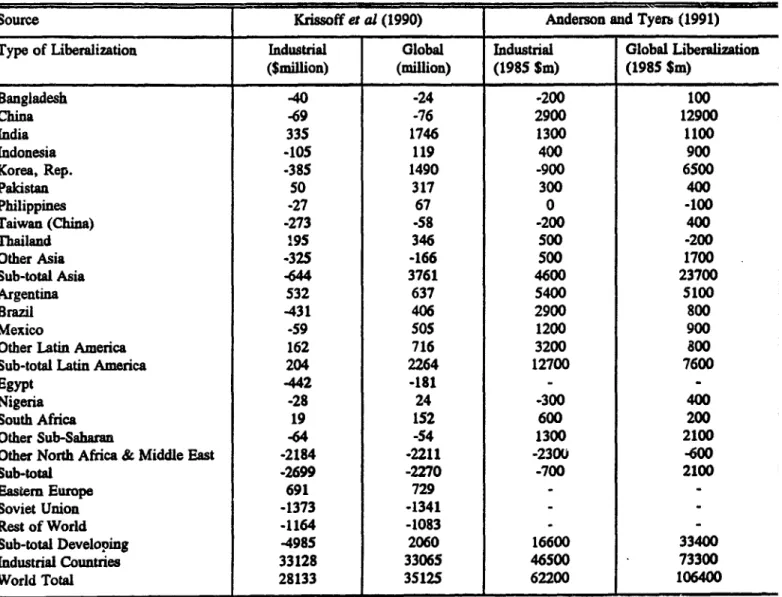
Reasonaoly comparable results for the welfare consequences of complete trade liberalization are available from a recent study by Anderson and Tyers (1991, p. 26) and a USDA study by Krissoff, Sullivan, Wainio and Johnston (1990, p. 45-6). The USDA study is "conventional" in not including any feedback from price changes to productivity growth. The Anderson and Tyers study, by contrast, incorporates feedback from price changes to technological advance. The results obtained in both studies include those from an experiment in which only the industrialized economies liberalize and results when all economies participate in the liberalization.
When the developed countries alone liberalize, the Krissoff et al results (presented in Table 6) point to losses for most developing countries, although these are small relative to developing country GDP. However, when the developing countries participate in the liberalization process, the picture changes considerably as they benefit from reductions in deadweight losses and, in some cases, from terms of trade changes. With global liberalization, most of the economies of Asia and Latin America are projected to experience gains. In Africa, the food importing countries of North Africa and the Middle East experience losses while Sub-Saharan Africa as a whole experiences a small welfare gain. The former Soviet Union is projected to experience a substantial welfare loss because of increases in the price of imported food.
In the Anderson and Tyers results, the developing countries in aggregate gain, even in the case where only the OECD countries liberalize. However, the gain to the developing countries is much larger when they participate in the liberalization: in this case, the welfare gain more than doubles-from US$16.6 billion to $US33.4 billion. In the case where only the industrial countries liberalize, the developing countries which lose are primarily heavy food importers such as the North African oil exporters, Taiwan (China) and Bangladesh. When the
distortionary effects of policies in the developing economies are removed in the second experiment, only a very few developing economies continue to experience losses and these are relatively minor. From a comparison with the Krissoff et al results, and with earlier results with the Tyers-Anderson model, it appears that the inclusion of endogenous technical change has major implications for the results.
The focus of most of the literature has been on the implications of complete liberalization despite the fact that complete trade liberalization will clearly not occur as a result of the Uruguay Round. Recent studies by Loo and Tower (1990), Tyers and Falvey (1989) and by Martin, Knudsen, Tsigas and van der Mensbrugghe (1992) make it clear that the consequences of partial liberalization cannot be assumed to be a simple fraction of the consequences of total liberalization. Loo and Tower (1990) demonstrate that apparently paradoxical results, such as food importers gaining from increases in the price of food, are feasible.
The analysis undertaken for this paper differs from the earlier studies in dealing specifically with several types of partial liberalization in order to capture the potentially important welfare consequences of this liberalization. It focusses on agricultural liberalization, rather than the overall liberalization of agricultural policies considered by Goldin and van der Mensbrugghe (1992), but utilizes the full general equilibrium framework provided by the RUNS model to capture the full set of interactions between commodities. The analysis in this paper is also tailored more specifically to the specific features of the Dunkel liberalization package than are the earlier studies.
4.Implications of Agricultural Liberalization for the Developing Countries: Results from the RUNS model
The RllNS model was originally developed by Jean-Marc Bumiaux and Jean Waelbroeck. The current version of RUNS is described in Goldin, Knudsen and van der Mensbrugghe (forthcoming) and documented comprehensively in Burniaux and van der
Mensbrugghe (1991)5.
The model contains the 22 regions described in the footnote to Table 1. There are two agricultural sectors in each region: crops and livestock. The crops sector produces eleven commodities and the livestock sector four. Five manufacturing goods are produced by single output sectors.
There is perfect substitution between domestic and traded agricultural commodities. For manufactures, however, goods are differentiated according to region of origin using the Armington specification (with a CES function for imports and a CET function for exports).
There are four primary factors: capital, labor, land and draught cattle. Investment is driven by savings. The capital stock in the manufacturing sector is fully mobile across commodities. In the rural sectors, capital and dry land are aggregated into a composite factor and labor, draught cattle, and irrigated land are combined in another composite factor. Rural investment is determined by the relative profitability of the various assets: dry land, irrigated land, tractors and draught cattle.
A labor migration equation, driven by the difference between urban and rural per-capita incomes, together with population growth, determines the allocation of labor between the rural and urban sectors. In the version of the model used here, a flexible wage rate maintains constant employment of labor.
Land is modeled considering both an estimated upper bound on availability and actual demand. As actual demand gets closer to the maximum availability, the marginal cost of land use increases.
The specification of demands for current consumption goods and for saving is based
on the Extended Linear Expenditure System for both the urban and the rural households. Rural disposable incomes consist of net (of factor taxes) returns to factors, the rural sector's share of the net government revenue generated by price distortions and the value added tax, and a part of the costs of stock operations.6 Urban disposable incomes consist of net (of
factor taxes) retums to factors and the residual of net government revenue from market distortions, the value added tax, and stock operations.
Govemment expenditures are assumed to grow at the same rate as GDP. Govemment revenues are obtained from trade taxes on agricultural and non-agricultural commouides, from a tax on value added and from agricultural stockholding operations. In the closure used in this analysis tax rates were exogenous, making government savings (the budget surplus/deficit) endogenous.
The model was closed with the assumption of an exogenous balance of trade constraint or, equivalently, supply of foreign savings to the economy. With domestic private and government consumption and savings decisions explicitly modeled, investment spending was determined by the availability of savings. The model was calibrated with data for 1985 and is solved until the year 2002 in three-year increments.
The data base includes estimates of price distortions on agricultural and non-agricultural goods. The non-agricultural price distortions in OECD countries were obtained from OECD (1991) estimates for the years 1986, 1987, 1988 and 1990, straddling the base periods used in the current proposals for trade reform. As discussed above, estimates of agricultural distortions in the developing countries in the 1985-87 period were constructed using USDA (ERS) and World Bank data.
The agricultural policy instruments in RUNS consist of ad valorem wedges for divergences between domestic and world prices, and for divergences between the prices
received by producers and paid by consumers. The first measure is expressed as a fixed tariff equivalent while the second is interpreted as a producer subsidy equivalent incorporating all assistance paid directly to producers without directly affecting the market price. The results presented below deal with the long run response to liberalization and hence full price transmission between world and domestic prices is assumed.
Since the specification of the model is based strongly on economic theory, it is possible to relate the model results to the underlying expenditure and revenue functions, and hence to measure welfare changes using a modification of the Trade Expenditure Funcdon approach (Anderson and Neary 1992; Martin 1992). The approach measures the effects of changes in all variables on the cost of achieving a given level of utility, less any effects on revenues from production and taxation. As demonstrated by Martin et al (1992), this approach has the advantage of allowing consistent measures of the welfare consequences of policy changes in the presence of multiple distortions.
Model Results
From a trade liberaLization perspective, the best outcome now likely to be achieved under the Uruguay Round is an agreement along the lines of the Dunkel (GATT 1991) proposal. Key features of this proposal for agricultural policy reform under the GATT are:
(i) Tariffication of import barriers and their reduction by an average of 36 percent from their 1986-88 average tariff equivalents.
(ii) Reduction of 36 percent in budget oudays on export subsidies from a 1986-89 base and a reduction of 24 percent in the volume of subsidized exports.
(iii) Reduction of 20 percent in aggregate measure of domestic support (AMS) relative to a fixed 1986-88 average extemal reference price.
The reduction requirements apply to positive protection, and imply no requirement to reduce export taxes or import subsidies. Further, developing country members of GAIT are
allowed special and differential provisions which require reductions only two thirds the size of those required of developed countries, and least developed countries are exempted from reduction commitments.
Some simplification .s required if the broad features of a likely global agreement are to be captured. Tariffication of import barriers and their reduction by 36 percent is readily captured in the modeling framework used in this study. However, a 36 percent reduction in the value of export subsidies by a single country would typically require less than a 36 percent reduction in the ad valorem equivalent of such an export subsidy since the value reduction would result from changes in both the rate of assistance and in the quantity exported. In a multilateral context, reductions in export subsidies are likely to raise world prices, offsetting the reduction in export volumes implied by declines in export subsidies. Thus, treating reductions in export subsidies as a 36 percent reduction in export subsidy rates seems likely to provide a reasonable approximation to the effects of the proposal.
The limitation on the volume of subsidized exports that is also part of the proposal was not considered in the experiment. Either the price instrument or the quantity constraint, but not both, can be effective and, in a growing world economy, the price instrument is more likely to be effective in the long run.
The actual requirement imposed on domestic subsidies by the Dunkel proposal is specified through a 20 percent reduction in the value of an Aggregate Measure of Support (AMS), including both domestic subsidies and border measures. Since the support provided by border measures is to be reduced by more than 20 percent, the required reduction in purely domestic support measures may initially be less than the 20 percent. However, the use of a fixed reference price will raise the calculated AMS if world prices of commodities rise following liberalization and place a counteracting downward pressure on domestic assistance. Over time, further downward pressure may be placed on domestic assistance levels by erosion of the real value of the fixed Aggregate Measure of Support. On balance, specifying a reduction of 20 percent in the rate of assistance provided by d-omestic supports seems likely
to provide a reasonable representation of the effects of the proposal.
Four broad liberalization scenarios are considered: the implementation of the Dunkel package in the developed country; a similar reduction in all protection (positive and negative) in developed and developing countries; a package like the complete Dunkel proposal, with smaller protection reductions in the developing countries, and a further experiment under which only the developing countries liberalize by the same amount as the developed countries in the other simulations.
All results shown below are for the year 2002, and so incorporate most of the long run supply and demand adjustments that will follow the liberalization process. Due to space limitations, only two sets of results are discussed below: the impact on world prices (expressed relative to the model's numeraire, the average price of OECD exports of manufactures) and on welfare.
World Prices: The first two columns of Table 7 display the impacts on world prices of Dunkel type partial liberalization in the OECD countries alone. In the first column, it is assumed that the US land set aside policy is unchanged following liberaization. Dairy, sugar, beef and wheat are the commodities for which the largest price increases are observed, reflecting the high levels of protection in the OECD countries. All other price increases are smaller than 3 percent. The prices of coffee and cocoa, crops not directly affected by the policy change, are only marginally affected. Tea, another crop not directly affected by the price change, experiences a somewhat larger price increase. This is likely due to the fact that developing countries that are important producers of tea will move away from the crop into wheat, sugar, coarse grains and livestock.
The estimated effects on world prices obtained from this simulation appear broadly in line with the results obtained in the earlier studies reported in Table 4 when allowance is made for the fact that we have considered only partial agricultural liberalization of the type likely to result from the Uruguay Round while the earlier studies considered full
liberalization. Given this di 'erence, we might expect our results to be in the order of a third to a quarter of the magnitude of those observed in the earlier studies. When scaled up to reflect this, our result for wheat is of the same order of magnitude as most of the results in Table 4. Rice, similarly, falls well within the range observed in the earlier studies, as do the results for meat. Our dairy result is consistent with the OECD/MTM model results and the IIASA results but well below the estimates reported by Anderson and Tyers and by the USDA/SWOPSIM model. The sugar result is much closer to the results reported for other models than for the earlier version of the RUNS model.
Commodity policy in the United States contains two broad types of instruments: price support payments which tend to increase the level of output; and land set aside requirements which tend to reduce the level of output. While the exact link between the two instruments is difficult to specify, higher levels of price support increase the ability of policy makers to induce farmers to withdraw land from production and, by placing downward pressure on world prices, require reductions in US production. The use of producer subsidy equivalents ignores the effects of set aside requirements. To assess the sensitivity of the model results to changes in this parameter, set aside ratios for the major field crops in the United States (wheat, coarse grains, cotton and rice7) are relaxed by 20 percent from their average values
over the period 1985 to 1991, in line with the reduction in domestic support levels. In this experiment, world prices increase slightly less than before, except for oils. Clearly, the reduction in the set aside requirements for competing crops, such as corn, draws land away from soybeans, thus reducing the world supply of oilseeds.
In the next two columns of Table 7, all protection rates in the developed and developing countries are reduced to the same extent as in the first column. This scenario clearly goes beyond the liberalization specified by the Dunkel proposal in requiring
7 The average set aside requirements as a percent of planted area used were 26.1 percent for wheat, 17.4 percent for coarse grain, 44.8 percent for rice, and 26.7 percent for cotton. Estimates of the supply impact of smaller set aside acreage are based on Love and Foster (1990). Soybean yields are adjusted to take into account the fact that some of the land coming out of set asides will be used for soybeans, without changes in total soybean acreage.
reductions in negative as well as positive assistance and is intended to explore the consequences of GATT liberalization complemented by a corresponding wave of liberalization undertaken either unilaterally or through regional arrangements.
As noted previously, due to the fact that some commodities such as dairy products and sugar are protected in most developing countries (and in the former socialist countries of Eastern Europe and the CIS), the price rises following global liberalization are frequently larger than when only the industrial countries liberalize. However, except for wool, livestock products experience smaller price increases with global liberalization. This is also the case for coffee and cocoa which are typically taxed in the producing countries. An interesting case is rice. It is protected in most countries but heavily taxed in China. The supply response there is strong enough to reverse the sign of the price change in relation to the OECD liberalization experiment. The relaxation of the US set asides leads only to marginal modifications in the results, as noted in the discussion of OECD liberalization.
The next column, following more closely the spirit of the Dunkel proposal (detailed above), shows the price changes implied by the same reduction in pggitive protection in the OECD countries and a reduction in the non-OECD countries of two-thirds of that made in the OECD countries (no changes in the US set asides). Typically, price changes in this scenario are higher than under OECD liberalization because only positive protection in the non-OECD regions is reduced. The price changes also tend to be larger than under the GLOBAL liberalization where all distortions (positive or negative) are reduced, because removing negative protection stimulates supply and depresses world prices. Because the reduction in protection in non OECD countries is lower in this experiment than in GLOBAL (only two-thirds of the cuts in GLOBAL), the price changes are lower than under GLOBAL for some commodities, such as sugar, where protection is ubiquitous.
The last column of Table 7 displays the consequences of partial liberalization along the lines of the OECD and GLOBAL experiments undertaken by the developing countries only. This experiment is not directly related to the Uruguay Round, but will be useful to
20
indicate the welfare implications
of various kinds of policy reforms. As expected the impacts
on world prices are relatively small. There are exceptions, of course, which are due to the
large share of these countries in production and trade of commodities such as cocoa and
coffee.
Table 8 displays the impacts on world prices of the same policy experiments
presented in Table 7 with endogenous
response of productivity
to prices incorporated in the
analysis. Most of the elasticities of productivity to price changes are taken from Fulginiti
and Perrin (1993). A complete list of all the elasticities
is given in Brandao, Tsigas, van der
Mensbrugghe
and Goldin (1992) and a conceptual description of the experiment is in the
Technical Appendix
to that paper. As in Table 7, the first two columns of the table contain
the results of liberalization
only in the OECD countries. In this experiment, the typical
response in the OECD countries is a slowdown in the rate of productivity increase in
response to lower producer prices. The opposite typically takes place in the non-OECD
countries. Therefore, whether the price changes are larger or smaller than in the previous
experiment depends on the share of production in these two regions. As can be seen from
comparing
the first columns of Tables 7 and 8, the majority of prices increase slightly more
with endogenous
technical change considered. Similarly, with liberalization
in all countries
(GLOBAL liberalization) and with the Dunkel liberalization scenario, the world price
changes are not very far apart in the scenarios with and without induced response of
productivity. It should be noted that in the Dunkel experiment, the balance between the
slowdown
in productivity
growth in countries with positive protection and the acceleration
of
productivity
growth in the other countries determines
whether the price increases in Table 8
are bigger or smaller than the corresponding
ones in Table 7. For all but one commodity,
the results are similar to those observed for the OECD experiment, i.e., either the price
increase in Table 8 is larger than the corresponding
price increase in Table 7 in the two
experiments
or the price increase is smaller in both. The exception is wheat, where in the
Dunkel experiment the price increase is somewhat smaller with endogenous productivity
change and the opposite is true in the OECD experiment.
Welfare effe: The welfare effects of trade liberalization arise from three components: efficiency gains from liberalization; terms of trade impacts, and second-best welfare effects manifested in induced changes in tariff revenues. Table 9 displays the welfare impacts of liberalization, without endogenous productivity growth, in the OECD countries, in all countries (GLOBAL), in all countries that subsidize agricultural commodities (Dunkel), and in the developing countriess. The first two columns show, for the OECD liberalization, the welfare gain (loss) in dollars and as a percentage of CDP for each one of the 22 regions of RUNS. A numnber of developing countries are hurt but, taken as a group, they experience a (small) gain of US$ 629 million. This result lies between the loss of $ 5 billion estimated by Krissoff et al (see Table 6) and the gain of $16.6 billion estimated by Anderson and Tyers for full liberalization and so does not seem to be out of the range implied by the earlier literature.
The net gain of the developing countries in this experiment can be attributed largely to terms of trade effects, with exporters gaining from world price rises and importers tending to lose. The largest gainers from industrial country liberalization are Brazil, other Latin America, and India. As usual in this kind of analysis, the gains and losses for each region tend to be a small percentage of GDP. With the Dunkel experiment, however, there is a marked increase not only in the total gains for developing countries, which are now US$ 20 billion, but also in the gains to individual regions. The most spectacular change is in Upper Income Asia which under the Dunkel experiment gains about half of the total gain for the developing countries while it lost from OECD liberalization. Although this region is a net importer of agricultural goods, it appears that the efficiency gains from liberalization are large enough to compensate for the negative terms of trade effect. A similar analysis applies to the oil exporting countries. While Other Latin American (LAT) countries (excluding Mexico) gain in the OECD liberalization, this gain is almost doubled under the Dunkel experiment and the additional gain for Brazil is about 29 percent. Mexico experiences an
8 In view of the small impact of the release of US set asides on world market outcomes, these results ae
extremely large welfare gain in this scenario, very likely due to the efficiency gains associated with the reduction in the protection rate for corn and wheat.
When liberalization in all countries (GLOBAL) is considered, the gains for the developing countries as a whole tend to increase substantially in relation to the OECD and the Du1ikel experiments, with few exceptions. It is worth noting the case of sub-Saharan
Africa which, even in this scenario, does not gain from the policy chang;, even though its losses are reduced in relation to the other two scenarios. The developing countries as a group gain about US$ 59 billion in this scenario. This estimate of the gains to developing countries is much larger than the estimate of US$ 2 billion reported by Krissoff et al and larger than
the US$ 33.4 billion reported by Anderson and Tyers, even though these results refer only to partial liberam zation and do not incorporate linkages through induced productivity changes. As would be expected, the result reported in this paper is smaller than the $90 billion estimated by Goldin and van der Mensbrugghe (1992) who considered a liberalization in which domestic support measures were reduced by a larger proportion.
One major influence on the difference between the RUNS results and those obtained from the partial equilibrium model results of Anderson and Tyers (1991) and Krissoff et al
(1990) is likely to be the general equilibrium nature of the RUNS model, with resources able to flow between agriculture and other sectors. A second influence is the much wider commodity coverage of our analysis, which includes tropical crops, oilseeds, cotton and tobacco, all of which are excluded from the Anderson and Tyers (1991) study. Another is the approach to modeling welfare changes used in this study, which captures the effects on welfare resulting from changes in govemment revenues induced by the liberalizaton. We consider reductions in assistance which are less than a third of the full liberalization reductions in assistance undertaken by Krissoff, et. al., (1990) and Anderson and Tyers (1991). An important feature of the gains from partial trade liberalization is their front end loaded nature, with greater gains from the initial stages of liberalization than from subsequent stages (Martin, et. al. (1991)), so that our results should be more than one-third of the gains from full liberalization.
These experiments indicate that the bulk of the gains for the developing countries would come from reforming their own policies, including positive and negative protection. Even countries that gain in the OECD scenario, such as Mexico, experience a substantially higher gain from unilateral reform. The results of the fourth scenario shown in Table 9, liberalization by the developing countries only, is intended to make this fact explicit. Notice, for example, that about 60 percent of the gain of Low Income Asia under GLOBAL liberalization would be obtained under DEVELOPING COUNTRY liberalization alone. Even though the African region loses from GLOBAL liberalization, it would gain under DEVELOPING COUNTRY liberalization alone. The total gain for the developing countries under DEVELOPING COUNTRY liberalization is of the order of US$ 56 billion, that is about 95 percent of the gain under GLOBAL liberalization.
Even though the gains for the developing countries in the Dunkel experiment are only about one-third of those in GLOBAL, they are high in comparison to the OECD only experiment. This reinforces the important point that full participation in the GATT process is strongly in the interest of most developing countries.
The set of results displayed in Table 10 reflects the inclusion of endogenous productivity change. The gains for the developing countries tend to be larger while those for
the OECD countries tend to be smaller than in the absence of productivity change (see Table 9 for comparison). As a group, the OECD countries gain about US$73 billion dollars under OECD liberalization; taking endogenous productivity growth into account this drops to approximately US$71 billion. The corresponding figures for GLOBAL liberalization are US$73 billion and US$65 billion. With liberalization in the OECD, the developing countries as a group increase their overall gain from US$629 million without productivity endogenous to about US$30 billion with endogenous productivity. The estimates are US$60 and US$131 billion, respectively, for global liberalization, $US19 and $US44 billion for the Dunkel package, and US$56 and US$98billion, respectively, for liberalization only by the developing countries.
This paper is essentially comprised of two parts. In the first, the structure of agricultural protection in developing and developed countries is outlined and the literature on estimating the implications of trade liberalization is reviewed. The second part utilizes a recently revised version of the RUNS model to analyze the consequences of agricultural trade liberalization.
The first experiment reported estimated the consequences of implementing the Dunkel proposal in the OECD countries only. A second experiment includes a comparable reduction in all assistance (including both positive and negative protection) in all countries (GLOBAL). A third experiment examines the implications of an experiment closer to the actual Dunkel proposal: a reduction of distortions applied to agriculture by the OECD countries and a reduction of positiv protection in the developing countries in the order of two-thirds of that in the OECD. A final experiment considers a reduction of all protection (negative and positive) rates in the developing countries alone.
The results of the first experiment indicate that agricultural policy reform in the OECD countries will have significant impacts on world prices of a limited number of commodities, mainly dairy, beef, sugar and wheat. The main gainers from this reform are the OECD countries themselves. The developing countries as a whole experience a small gain; among this group food exporters are likely to be the main beneficiaries
In marked contrast with this result, when the policy reform is extended to all countries, there is a substantial increase in the benefits going to the developing countries, indicating clearly that the major source of welfare gains for this group of countries is the reform of their own policies. While still small relative to GDP, the gains to the developing countries from partial liberalization undertaken by all countries are considerably larger than those reported in earlier studies.
It seems that the developing countries in aggregate could expect to achieve small welfare gains if the Dunkel package were implemented by the developed countries alone and
the developing countries chose not to participate in the liberalization process. Very much larger gains would be realized if the dweloping countries choose to participate wholeheartedly in the world tradinb, system by undertaking agricultural reforms of their own. If the developing countries instead choose to participate in a GATT agreement along the lines of the Dunkel proposal and reduce only their positive assistance to agriculture, they might siil experience a relatively significant gain. In the non-participation scenario, a significant minority of developing country regions could be expected to suffer welfare losses. By contrast, in the active participation scenarios, only a small number of developing country regions would be expected to lose, and the magnitude of these losses would be extremely small relative to the gains to other developing regions.
The potential gains discussed in this paper capture only a portion of the potential gains from a comprehensive move to liberalization in world agriculture. Even if the gains from an initial liberalization were small, there would likely be future gains from the incorporation, at last, of agriculture within the multilateral trading system. As is evident from the experience of manufactures where average protection levels have been reduced dramatically over a series of GATT Rounds, the incorporation of agriculture in GAIT could have very major long term benefits. Further, the stimulus to productivity in developing countries provided by liberalization would have cumulative benefits, compounding the gains reported in this paper.
References
Anderson, J. and Neary, J. P. (1992) "Trade reform with quotas, partial rent retention, and tariffs"
Econometrica 60(1):57-76.
Anderson, K. and Tyers, R. (1990) "How developing countries could gain from agricultural trade liberalization in the Uruguay Round", in Goldin, I. and Knudsen, 0. eds. Agricultural Trade Liberalization: Implicationsfor Developing Countries, OECD and the World Bank.
-(1991) "More on welfare gains to developing countries from liberalizing food trade", Mimeo, Australian National University.
Andrews, N., Roberts, I. and Love, G. (1992) "Recent developments in the Uruguay Round for agriculture", Agriculture and Resources Quarterly 4(2):196-208.
Brandao, A., Tsigas, M., van der Mensbrugghe, D. and Goldin, 1. (1992) "Agricultural productivity growth and trade liberalization: _ general equilibrium analysis", Mimeo, World Bank. Forthcoming in Goldin, Knudsen and van der Mensbrugghe
Burniaux, J. M. and van der Mensbrugghe, D. (1991) "Trade Policies in a Global Context: Technical Specification of the Rural/Urban-North/South (RUNS) Applied General Equilibrium Model",
OECD Development Centre Technical Papers, No. 48, November.
Economist (1992), "America builds a trade block", Economist August 15, p. 55-6.
Fulginiti, L.E. and Perrin, R.K. (1993) "Prices and Productivity in Agriculture", Review of
Economics and Statistics (forthcoming).
GATT (1991), Draft Final Act Embodying the Results of the Uruguay Round of Multilateral Trade Negotiations, MTN/TNC/W/FA, General Agreement on Tariffs and Trade, Geneva.
Goldin, I and Knudsen, 0. eds. (1990a), Agricultural Trade Liberalization: Imnplications for the Developing Countries, OECD and the World Bank, Paris and Washington DC.
-(1990b), "Implications of agricultural trade liberalization for developing countries", in Goldin, I. and Knudsen, 0. eds. Agricultural Trade Liberalization: Implications for the Developing
Countries, OECD and the World Bank, Paris and Washington DC.
Goldin, I., Knudsen, 0. and van der Mensbrugghe, D. (forthcoming) Trade Liberalization: Towards 2002, OECD Development Centre and the World Bank.
Goldin, I. and van der Mensbrugghe, D. (1992), Trade liberalization: what's at stake? OECD Development Centre Policy Brief No. 5, OECD Development Centre, Paris.
Krissoff, B., Sullivan, J., Wainio, J. and Johnston, B. (1990), Agricultural Trade Liberalizaton and
Developing Countries, ERS Staff Report No AGES 9042, Economic Research Service, United
States Department of Agriculture.
Krueger, A., Schiff, M. and Valdes, V. (1988) "Agricultural Incentives in Developing Countries: Measuring the Effect of Sectoral and Economywide Policies", World Bank Economic Review, vol. 2, No.7, September.
Krueger, A., Schiff, M. and Valdds, A. (1991) The Political Economy of Agricultural Pricing Policy,
Johns Hopkins University Press for the World Bank.
Loo, T. and Tower, E. (1990), 'Agricultural liberalization, welfare, revenue and nutrition in the developing countries' in Goldin, I and Knudsen, 0. eds. Agricultural Trade Liberalization:
Implications for the Developing Countries, OECD and the World Bank.
Love, H. A. and Foster, W. E. (1990) "Commodity Program Slippage Rates for Corn and Wheat",
Western Journal of Agricultural Economics, vol. 15, No. 2, pp. 272-28 1.
Martin, W. (1992) "Measuring welfare changes in distorted economies" Paper presented to the Annual Meetings of the Eastern Economic Association, New York, March.
Martin, W., Knudsen, O., Tsigas, M. and van der Mensbrugghe, D. (1991), "Welfare implications of partial agricultural trade liberalization in a distorted world economy", paper presented at the International Agricultural Trade Research Consortium Annual Meetings, New Orleans, December.
Mundlak, Y. and Larson, D. (1992), "On the transmission of world agricultural prices", World Bank
Economic Review, Vol 6, No. 3, pp399-422.
OECD (1991), Tables of Producer Subsidy Equivalents and Consumer Subsidy Equivalents:
1979-1990. Paris.
Roland-Hoist, D. (1991), EstImates of non-agricultural trade control measures for applied general
equilibrium analysis, Mimeo, Mills College, California.
Schiff, M. and Valdes, Alberto (1992) A Comparative Study of the Polidcal Economy of Agricultural Pricing Policies. Synthesis: The Economics of Agricultural Price Intervention in Developing
Countries, forthcoming.
Sullivan, J., Wainio, J. and Roningen, V. (1989), A Database for Trade Liberalization Studies, Staff Report No AGES89-12, Economic Research Service, United States Department of Agriculture.
Tyers, R. and Falvey, R. (1989), 'Border price changes and domestic welfare in the presence of subsidized exports' Oxford Economic Papers 41:434-51.
Valdes, A. and Zietz, J. (1980), Agricultural Protection in OECD Countries: Its Cost to Less
Developed Countries, Research Report 21, International Food Policy Research Insdtute,
Washington DC.
Webb, Alan J., Lopez, Michael and Penn, Renata (1990) Estimates of Producer and Consumer
Subsidy Equivalents: Government Intervention in Agriculture, 1982-87, United States
Department of Agriculture, Economic Research Service.
Whalley, J. and Wigle, R. (1990), 'Terms of Trade Effects, agricultural trade liberalization and developing countries' in Goldin, I. and Knudsen, O., eds., Agricultural Trade Liberalization: Implications for the Developing Countries, OECD and the World Bank, Paris and
Table 1: Agricultural Protection' in non OECD regions Bordcr MeawA im o OECD Regias
Region' UA |CHN IND UIA I IDN AFR NOA I ZAF MAO MED I OIL LAT BRA MM |EET Cis
UV|AOck
Beef. Veal & Sheep 0.00 -0.24 0.00 1.53 0.00 0.00 0.00 0.40 0.00 0|00 1.76 |0.0 |0.23 T0.29 0.79 | .05
|Other Meat 0.00 .0.38 0.00 0.15 0.00 0.00 0.00 0.20 0.00 0.00 1.76 0.00 -0.01 0.46 0.27 40.02 Dairy 0.09 0.00 0.00 0.94 0.00 0.00 0.00 0.30 0.50 0.00 0.72 0.00 .0.21 0.04 0.03 0.01 Wool '_ 00 000 000 0.00 0.00 0.00 000 0.30 000 000 033 000 000 000 0.00 0.00 Crap Whea -017 -21 032 2.61 0.00 _0.30 1.23 0.25 022 001 3.79 .0.05 055 0.19 0.23 0.36 Rice 0.17 4.45 *0.18 1.06 0.12 0.01 0.36 0.00 0.00 0.34 164 1.57 0.39 0.00 0.00 0.80 CoarseGmim 0.00 0.15 0.25 3.13 0.09 -0.05 0.00 0.25 0.21 0.00 0.96 0.03 0.16 1.10 0.35 |0.10 Sugar 0.08 0.17 0.00 1.41 1.18 0.67 0.20 0.98 0.14 0.99 6.28 0.30 000 0.00 0.94 0.28 Coffee 0.00 0.00 0.00 0.00 0.00 0.06 0.00 0.00 0.00 0.00 0.58 0.55 .0.10 0.00 0.00 0.00 Cocoa 0.00 0.00 0.00 0.00 0.00 -0.24 .0.15 0.00 0.00 0.00 0.39 -0.36 -0.17 0.00 0.00 0.00 Tea 4.35 0.00 0.00 0.00 0.00 -0.09 0.00 0.30 0.00 0.00 1.19 0.00 0.00 000 000 000 Oil 0.00 0.23 -0.07 3.50 0.72 0.47 0.00 0.20 0.45 0.00 1.61 40.29 -0.14 0.40 0.17 .014 OtherFoodPrduc 0.00 4.40 0.00 0.00 0.00 0.00 0.00 0.00 0°00 000 0.16 0.00 0.00 0.00 0°00 0l00 coCoe o0.09 0.04 -0.18 0.00 0.00 .0.10 0.65 0.30 0.00 -0.21 0.27 0.00 -0.21 0.13 0.00 -0.07 OdiwA#nCZUri 0.06 0.00 0.00 t.86 0.00 0.001 0.00 0.00 0. 00 00 0.48 0.00 0.00 0.00 000 0.00 DD o Suppost
Bae.Vc & Sbeep §0.02 0.00 0.00 0.15 0.00 0.00 I 0.00 0.00 0.00 0.00 0.00 0.00 0.07 0.05 0.05 0.08
Othermetew 0.00 000 000 0.100 0.00 0.001 0.00 0.00 0.00 0.00| 0.00 o.o0 0.04 0.02 0.03 0.03 Dairy 0.03 0000 0.00 0.00 0.0 0.00 0.00 0.00 0.00 0.00 0.00 0.010.030.07 wool 0 0.00 0.00 0.00 0.00 0.00 0.00 0.00 0 .0 0.00 0.0 0. 0 Wbhea 0.11 0.02 0.31 0.03 0.00 0.00 0.04 0.07 0.02 0.15 0.00 0.02 0.20 0.24 0.04 0.02 Rioe 0.02 0.01 0.19 0.13 0.04 0.04 0.04 0.00 0°00 012 000 0.05 0.31 0.00 0.00 0.20 Cc.ueGwuna 0.00 0.03 0.12 0.07 0.08 0.03 0.04 0.06 0.02 0.12 0.00 0.05 0.22 0.17 0.03 0.10 Sugar 0.06 0.23 000 0.01 0.01 0.00 0.03 0.01 0.00 0.18 0.00 0.02 0.00 0.00 0.03 0.03 Coffee 0.00 0.00 0°00 0.00 0.00 0.02 0.00 0.00 0.00 0.00 0.00 0.05 0.00 0.00 0.00 0.00 cocoa, 0.00 0.00 0.00 0.00 0.00 0.00 0.01 0.00 0.00 0.00 0.00 0.16 0.00 0.00 0.00 0.00 Teo 0.00 0.00 0.00 0.00 0.00 0.02 0.00 0.00 0.00 000 0.00 0.00 0|00 0.00 0.00 0.00 Oils 0.00 0.02 0.11 0.13 0.06 0.10 0.00 0.00 0.00 0.00 0.00 0.00 0.23 0.24 0.03 0.02 Odier°Food Pd C 0.00 -a ° 0.00 0.00 0.00 0.00 0.00 0.00 0.00 002 000 000 0.07 0.00 0.17 0.00 0T00 Conon 0.05 0.01 0.19 0'00 0.00 0 00 0.13 0.00 000 014 000 0.00 000 015 000 018 OdierAgnciulom 0.00 0.00 0.00 0.02 0.00 0 0.00 0 0001 0.00 000 0.00 0.00 000 0.00 00
fto
Table 2. Agricultural Protection' in OECD Countries
Border Mews in OECD counin
USA Caa AuMliewN Jay EEC EFITA
LJvasock
Beafe Veal & Sheep 0.31 0.55 0.00 0.99 0.98 1.65
OtherMeaw. 0.01 0.10 0.06 0.33 0.28 1.18 Dairy 1.23 1.28 0.37 3.53 1.89 2.97 wool 0.07 0.00 0.00 0.00 0.00 0.00 cCo0 Wbeat 0.19 0.13 0.01 5.21 0.65 2.34 Rice 0.00 0.00 0.06 3.49 1.14 0.00 Coane Gmi 0.00 0.14 0.00 4.04 0.91 1.77 Sugar 0.62 0.09 0.10 1.14 1.18 1.80 Coffee 0.00 0.00 0.00 0.00 0.00 0.00 Cocoa 0.00 0.00 0.00 0.00 0.00 0.00 Tea 0.00 0.00 0.00 0.00 0.00 0.00 Oils 0.00 0.06 0.00 0.00 0.00 3.13
Odher Food Products 0.00 0.00 0.00 0.00 0.00 0.00
Counn 0.00 0.00 0.00 0.00 0.00 0.00
Other Aire 0.00 0.00 0.00 0.00 0.00 0.00
Domasc Suppon a OECD Coim Lvmtoek
Beef. Veal & Sheep 0.07 0.17 0.07 0.11 0.14 0.22
ODier Mc 0.07 0.18 0.04 0.14 0.07 0.2l Daierleay . 0.07 0.20 0.00 0.14 0.07 0.25 Wool 0.60 0.00 0.06 0.06 0.00 0.00 Crops Wheat 0.32 0.17 0.17 0.17 0.07 0.06 Rics 0.49 0.00 0.20 0.20 0.08 0.00 CoaenacOm 0.24 0.14 0.07 0.12 0.04 0.17 Sugar 0.08 0.10 0.07 0.07 -0.03 0.07 Coffee 0.00 0.00 0.00 0.00 0.00 0.00 Cocoa 0.00 0.00 0.00 0.00 0.00 0.00 Tea 0.00 0.00 0.00 0.00 0.00 0.00 Oil. 0.07 0.16 0.12 0.16 0.67 0.13
Other Food Products 0.00 0.00 0.00 0.00 0.00 0.00
Conoa 0.00 0.00 0.00 0.00 0.00 0.00
Other Agricuue 0.00 0.00 0.00 0.00 0.00 0.00