University of Kentucky University of Kentucky
UKnowledge
UKnowledge
Theses and Dissertations--Computer Science Computer Science
2019
A Machine Learning Approach to Artificial Floorplan Generation
A Machine Learning Approach to Artificial Floorplan Generation
Genghis Goodman
University of Kentucky, [email protected]
Digital Object Identifier: https://doi.org/10.13023/etd.2019.391
Right click to open a feedback form in a new tab to let us know how this document benefits you. Right click to open a feedback form in a new tab to let us know how this document benefits you. Recommended Citation
Recommended Citation
Goodman, Genghis, "A Machine Learning Approach to Artificial Floorplan Generation" (2019). Theses and Dissertations--Computer Science. 89.
https://uknowledge.uky.edu/cs_etds/89
This Master's Thesis is brought to you for free and open access by the Computer Science at UKnowledge. It has been accepted for inclusion in Theses and Dissertations--Computer Science by an authorized administrator of
STUDENT AGREEMENT: STUDENT AGREEMENT:
I represent that my thesis or dissertation and abstract are my original work. Proper attribution has been given to all outside sources. I understand that I am solely responsible for obtaining any needed copyright permissions. I have obtained needed written permission statement(s) from the owner(s) of each third-party copyrighted matter to be included in my work, allowing electronic distribution (if such use is not permitted by the fair use doctrine) which will be submitted to UKnowledge as Additional File.
I hereby grant to The University of Kentucky and its agents the irrevocable, non-exclusive, and royalty-free license to archive and make accessible my work in whole or in part in all forms of media, now or hereafter known. I agree that the document mentioned above may be made available immediately for worldwide access unless an embargo applies.
I retain all other ownership rights to the copyright of my work. I also retain the right to use in future works (such as articles or books) all or part of my work. I understand that I am free to register the copyright to my work.
REVIEW, APPROVAL AND ACCEPTANCE REVIEW, APPROVAL AND ACCEPTANCE
The document mentioned above has been reviewed and accepted by the student’s advisor, on behalf of the advisory committee, and by the Director of Graduate Studies (DGS), on behalf of the program; we verify that this is the final, approved version of the student’s thesis including all changes required by the advisory committee. The undersigned agree to abide by the statements above.
Genghis Goodman, Student Dr. Brent Harrison, Major Professor Dr. Miroslaw Truszczynski, Director of Graduate Studies
A Machine Learning Approach to Artificial Floorplan Generation
THESIS
A thesis submitted in partial fulfillment of the requirements for the degree of Master of Science in the
College of Engineering at the University of Kentucky
By
Genghis Goodman Lexington, Kentucky
Director: Dr. Brent Harrison, Assistant Professor of Computer Science Lexington, Kentucky
2019
ABSTRACT OF THESIS
A MACHINE LEARNING APPROACH TO ARTIFICIAL FLOORPLAN
GENERATION
The process of designing a floorplan is highly iterative and requires extensive human labor. Currently, there are a number of computer programs that aid humans in floorplan design. These programs, however, are limited in their inability to fully automate the creative process. Such au-tomation would allow a professional to quickly generate many possible floorplan solutions, greatly expediting the process. However, automating this creative process is very difficult because of the many implicit and explicit rules a model must learn in order create viable floorplans. In this pa-per, we propose a method of floorplan generation using two machine learning models: a sequential model that generates rooms within the floorplan, and a graph-based model that finds adjacencies between generated rooms. Each of these models can be altered such that they are each capable of producing a floorplan independently; however, we find that the combination of these models out-performs each of its pieces, as well as a statistic-based approach.
KEYWORDS: Automated Floorplan Design, Creative Artificial Intelligence, Generative Machine Learning Models, Sequence-based Models, Graph-Based Models
Genghis Goodman
Author
09/05/2019
A Machine Learning Approach to Artificial Floorplan Generation
By Genghis Goodman Brent Harrison Director of Thesis Miroslaw TruszczynskiDirector of Graduate Studies
09/05/2019
Acknowledgements
I would like to thank Dr. Brent Harrison for his continual commitment as a research mentor and professor alike. It was through one of his classes where I first learned about Machine Learning, and it was through his mentor-ship I was able to pursue my interest further in the form of this research project. Furthermore, his guidance has helped significantly in my decision making - professional and academic. I would like to thank Dr. Nathan Jacobs and Dr. Angus Eade for their help and guidance on this project as well.
I would also like to thank Dr. Hunter Moseley, who first introduced me to computer science when I was just a senior in high school, and continued to mentor me throughout college by accepting me into his bioinformatics lab. There are countless other professors and mentors who have helped me throughout my college career, although I cannot list all of them, I also cannot thank them enough. Finally, I’d like to thank my friends and family for their support. Without the dependability of such good friends outside of the classroom, I would not have been able to perform well inside the classroom. My family and parents have always given me the perfect amount of support, yet freedom to follow whichever path I desired. It was because of this that I was able to find areas and fields of study for which I am truly passionate.
Contents
Acknowledgements . . . iii
1 Introduction 1 2 Related Work 4 2.1 Automated floorplan Generation . . . 4
2.1.1 Graph and Combinatorial methods . . . 4
2.1.2 Machine Learning Techniques . . . 5
2.2 Creative Artificial Intelligence . . . 6
3 Background 7 3.1 Recurrent Neural Networks . . . 7
3.1.1 Long-Short-Term-Memory Nodes . . . 8
3.2 Generative Adversarial Networks . . . 9
3.3 GraphGANs . . . 10
4 Methods 11 4.1 Generation of room features through sequence prediction . . . 12
4.2 Assembly through graph edge prediction . . . 13
4.3 Graph to image . . . 14
4.4 Co-creative framework . . . 16
4.4.1 Generation of room features through sequence prediction . . . 16
4.4.2 Finding room adjacencies . . . 16
4.4.3 Adding the new room onto the image . . . 17
5 Evaluation 18 5.1 Data . . . 19
5.1.1 Preprocessing . . . 19 5.1.2 Clean Dataset . . . 21 5.2 Baselines . . . 21 5.2.1 Sequence . . . 21 5.2.2 Graph . . . 22 5.2.3 Average . . . 22 5.3 Training . . . 22 5.3.1 Sequence . . . 22 5.3.2 Graph GAN . . . 23 5.4 Overlap Calculation . . . 24
5.5 Results & Discussion . . . 25
6 Conclusion 27
Bibliography 28
List of Figures
3.1 Recurrent Neural Network Architecture . . . 8
3.2 Generative Adversarial Network schema . . . 9
4.1 Hybrid Model Architecture . . . 12
4.2 Graph Generative Adversarial Network . . . 14
4.3 Graph to image process . . . 15
5.1 Evaluation Pipeline . . . 18
5.2 Data in vector form and visualized . . . 19
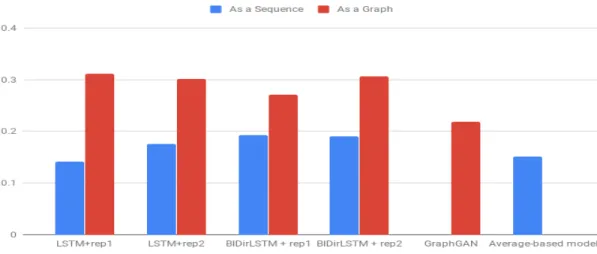
5.3 Approximating the (x1, y1) values of a room using the upward and leftward walls . 20 5.4 Overlap calculations for sequential and hybrid models using the LSTM, BiDirec-tional LSTM networks as well as two separate representations of rooms. The Graph-GAN method’s performance is shown second to the right. The Average-based model is shown on the right . . . 24
Chapter 1
Introduction
The design of a home is an interesting problem. Homes are designed through the creation of floor-plans, which are diagrams of rooms that compose a building, and their spatial relationships to one another. Rooms are simply areas designed for some specific purpose. In homes, rooms could be kitchens, dining rooms, bedrooms, etc. Each of these rooms is intended to be used for a specific task or set of tasks. Floorplans are surprisingly complex, as they must satisfy a variety of functional and artistic purposes. There are a variety of explicit and implicit rules that must be followed when achieving these purposes. For example, in order to effectively show the spatial relationships between rooms, floorplan must explicitly have some number of rooms and walls that separate or compose such rooms. The arrangement of these rooms, while not placed under formal restriction, must fol-low certain implicit guidelines. It would not be very functional for a bedroom to be placed within a kitchen. While a design must obey these rules, there is a high degree of freedom in how these rules can be followed. This freedom allows for an incredibly large amount of possible floorplans that could satisfy a set of desires (Such as number of rooms, size, etc.). Creating such floorplans is a creative process that requires imagination as well as mathematical skills. People can be trained to perform the task relatively well; however, the process is still a rather strenuous one.
In a professional setting, floorplans are created through an iterative revision process between a customer and an architect. The architect will design rough diagrams of the building, show them to the customer, receive feedback, then revise the design. Through this process, the architect must draw upon years of architectural training and expertise to consider a multitude of variables such as lighting, heating, and aesthetic. This process repeats until a rough design is agreed upon, and then further development of the building is completed. Many trials are often the key to success in
layout creation. Without clear objective metrics to optimize, it is often the best strategy is to create a multitude of possibilities and choose whichever the customer sees fit. Generating many designs for a single success is highly inefficient, however, and the large amount of human time needed to create a single design leads to high expense. Reducing the amount of human time needed for each iteration would significantly reduce the time of the overall process. Thus, it is desirable to reduce the amount of human time required to produce a layout, or even automate the process altogether.
Home design is something that is both professional and personal. Outside of professional home development, there are many non-architects/designers that are looking to remodel or build their home. However, hiring private designers can be quite expensive and many people do not have an aptitude, or interest, in home design. There would be significant value in democratizing this skill. This can be best achieved through software automation. A software that could automatically, or co-creatively design homes would allow non-professionals a cost-effective way of obtaining otherwise expensive architectural services. Furthermore, such a software could also reduce the cost of the rather expensive iterative process that occurs in professional settings.
While tools such as AutoCAD, Revit, and sketchup exist to help the architects create floorplans, none exist that actively work to intelligently design the plan alongside the creator.
This software would require a significant amount of intelligence as it must follow the explicit and implicit rules of floorplan design. Hard coding these rules would be near-impossible because they are often based on a multitude of factors and difficult to define. Furthermore, if the possi-bility did exist, this task would be incredibly time-consuming and largely subjective. Rather than hard-coding these rules into the program, it would be best if the program could learn these rules from existing examples. The massively growing field of machine learning may provide some po-tential solutions such as computer vision applications, sequential models, and adversarial networks. However, finding and applying the appropriate solution is non-trivial. While architectural rules are simple for many people to understand, even the most basic of requirements, such as the presence of walls, rooms, and doors may be difficult for some machine learning models to fully grasp. A machine learning model must also learn subtleties such as common room adjacencies or how the sizes of certain rooms relate to the sizes of others. Finally, simply representing the problem in a way a machine learning model can understand is difficult due to the model’s lack of knowledge of the semantics or inherent structure of floorplans.
One possible approach to using ML with this problem is to take advantage of models designed for computer vision tasks. These models reason about images. A floorplan can be represented as an
image, but this presents a number of recognition problems that would prove to be difficult for leading computer vision methods to solve. First, the model must recognize walls, and how they are arranged in a certain pattern to form rooms (not all rooms contain four walls or are shaped uniformly). Next, the model would have to learn about the characteristics of various types of rooms. Finally, the model would need to learn how various room types are arranged relative to one another. While learning the placements and characterizations of rooms is unavoidable for any agent attempting to learn to construct floorplans, it is especially difficult to do so when first learning the concept of such objects solely from pixels.
A floorplan can also be represented as a list of vectors, where each vector contains information about an object within the plan. This representation reduces the dimensionality of the object recog-nition problem. Rather than learning object characteristics through hundreds of pixels, a model is able to learn object characteristics through information contained in the vectors such as size, end-point coordinates, type of object, etc. This representation is promising, but contains further challenges when considering the variable length of each floorplan and how the model will need to learn the positional relationships between each object, as such relationships may not be explicitly represented through a list of vectors.
use graphs to encode structural information of floorplans. In this paper, we explore machine learning approaches to design floorplans. Namely, we test sequence predicting models using Long-Short-Term-Memory networks, generative graph models using Generative Adversarial Networks, and a hybrid model formed from a combination of the two. Such approaches are used to work towards a software which can reduce the workload on architects and everyday people alike by providing a co-creative platform for floorplan development.
Chapter 2
Related Work
There are two main bodies of work that are relevant to this paper: automated floorplan generation and the use of machine learning for creative endeavors. Automated floorplan generation can be further split into graph and combinatorial methods as well as machine learning applications. Other creative endeavors machine learning has been used for include: text, music and drawing.
2.1
Automated floorplan Generation
The problem of floorplan design automation has been ongoing for over 50 years [7]. Originally, graph theory applications and combinatorial methods were among the first approaches that were proposed [7]. As genetic algorithms and machine learning methods grew in sophistication and pop-ularity, researchers revisited the problem using these state-of-the-art techniques [10]. Yet, current deep learning methods, such as recurrent neural networks, have not been applied. We believe these methods present promising opportunities in their ability to recognize patterns within existing objects and their success with similar creative endeavours.
2.1.1 Graph and Combinatorial methods
Levin became the first to abstract a floorplan into a graph where clearly defined functional areas are represented as nodes and adjacencies between functional areas are represented as edges. [7] While this approach was also used by Cousin [1], a common shortfall was the inability to system-atically convert the abstraction back to a floorplan. This shortfall persisted for another decade until Grason proposed a method of realizing graph abstractions by limiting room shapes to purely rect-angular structures [4]. The proposed limitation allowed for the creation of algorithms that could
find all possible floorplans that a given graph could represent. This added restriction does, however, significantly reduce the amount of floorplans that can be constructed.
The process of constructing a floorplan from graph knowledge was later refined using combina-torial methods. Galle proposed a method to generate all possible rectangular plans on modular grids, subject to constraints on total area, room areas, wall lengths, room adjacencies, and room orientation [2]. This algorithm, however, does not solve the original problem of automatically, yet intelligently, creating such constraints such as total area, room areas, wall lengths and room adjacencies.
It is also important to note that early work focused primarily on constructing floorplans for functional facilities such as office buildings or factories. This is more convenient for graph or mathematical solutions because certain functional buildings can be evaluated in a more objective manner - in how well they serve their function. However, residential home layouts must serve both a functional purpose and an aesthetic/artistic one. There are also many different types of home styles that some people prefer over others. Creating mathematical functions for each style, or even to accurately model the artistic intricacies, is unfeasible. Thus, an approach using solely mathematics or graph theory would be insufficient.
2.1.2 Machine Learning Techniques
In ”Architectural Layout Design Optimization”, Michalek et al [10] presented two decision making processes. One processes optimizes the overall geometry of the plan, while the other optimizes the topology, or relationships between the rooms. The topology model accomplishes the same task as the graph representation of earlier solutions, while the geometry model helps convert the relation-ships between rooms into a geometrical representation. For both models, Michalek et al [10] uses simulated annealing and genetic algorithms to optimize mathematically defined design objectives and constraints. The ability of the model was also dependent on the pre-defined mathematical func-tions. We believe an approach that learns from existing examples may be less rigid and produce more feasible results.
As machine learning techniques have grown in popularity, some machine learning solutions have been proposed for this problem. In the paper Computer-Generated Residential Building Layouts, Merrell et al. presents a method for automating building layout generation using a Bayesian network trained on real-world data [9]. This network can assist in the creation of the building layout, the internal organization of spaces within the building, as well as the external appearance. The program takes a concise list of high-level requirements (number of beds, number of baths, approximate
square footage) as an input. The output is a list of rooms, their adjacencies, and each rooms size. While this work accomplishes a similar goal, we believe a neural net approach may be better suited for creative tasks such as this one.
2.2
Creative Artificial Intelligence
Neural network architectures have been used for a variety of creative and generative tasks. Sutskever used a modified version of a traditional recurrent neural network to generate text by prompting the model to generate a probability distribution of next characters in a sequence [12]. A character was chosen stochastically from this distribution and added to the sample. This idea was taken further by Zhang et al in their paper ”Chinese Poetry Generation with Recurrent Neural Networks” [15]. This work shows both the artistic and functional ability of recurrent neural networks as poems must make semantic and syntactic sense. Recurrent neural networks were used in other natural language pro-cessing projects such as the application of long-short-term-memory networks for spoken dialogue systems [14] and even automatic rap lyric generation [11].
Recurrent neural networks have also been used in conjunction with other machine learning methods in creative tasks like music and character generation. In ”Generating Music by Fine-Tuning Recurrent Neural Networks with Reinforcement Learning”, Jaques et al combined a RNN with Q-learning in order to generate realistic music [6]. Gregor used RNNs as the components in an auto-encoder for character generation (MNIST) [5].
These studies show the broad ability of sequential learning models to generate work that serves functional and artistic purposes. Although natural language may seem very different than rooms with in a floorplan, both forms demonstrate clear explicit rules that must be followed, and implicit rules that dictate the artistic nature of the piece. Furthermore, sequential neural networks are also used in conjunction with other models to form a larger generative system.
Chapter 3
Background
In this paper we use a combination of a sequential and graph model to generate floorplans. Recurrent neural networks are central to our implementation of the sequential model. Generative adversarial networks, and the graphGAN variant, is central to our graph model. Below we provide background information on these networks.
3.1
Recurrent Neural Networks
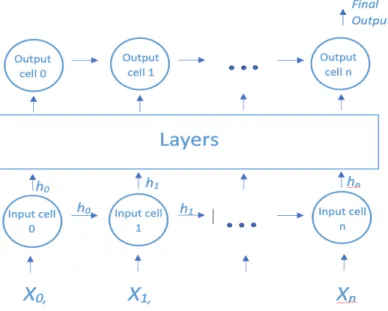
Recurrent neural nets are specialized for sequential data such as text, time-dependent data, or mu-sical notes. While feed-forward neural networks propagate all data throughout the network simul-taneously, a recurrent neural net processes the items in a dataset sequentially. The network makes informed decisions about the next item in the sequence by storing the context of previously seen inputs as ahiddenstate.
A recurrent neural network consists of cells. Each cell performs a calculation with learned weights and certain input values. The input values for a vanilla recurrent neural network cell is an item from the input sequence and the hidden state received from the previous cell. These inputs are multiplied by learned weights and entered into anactivationf unction. The result is passed to the next cell as a hidden state, or outside of the network as an output. Below is the mathematical representation of each state,htthat is produced as a result of termxt. The term is multiplied by a learned weight matrix, W, whileht−1 is multiplied by weight matrix U. The sum ofW xtand
U ht−1is input into the activation functionφ, which is generally atanhfunction.
Time, ort, is used to represent thetthterm in the example, because the network processes the terms one after another.
Figure 3.1: Recurrent Neural Network Architecture
A diagram of a recurrent neural network’s structure is shown in figure 3.1. As shown, cells are aligned sequentially. Layers are also shown in the figure. A cell’s output can be the input for another layer of cells. Extra layers allow for increased complexity within the model.
ht=φ(W xt+U ht−1)
Recurrent neural nets, because of their sequential nature, are very good at detecting patterns, how-ever, often suffer to remember information through an extended period of time.
3.1.1 Long-Short-Term-Memory Nodes
A Long-Short-Term-Memory network is a type of recurrent neural network that was created to remember information over a longer period of time. The LSTM network contains two forms of context. Like a regular recurrent neural network, an LSTM contains a hidden state that is passed through the network; however, an LSTM also has an extra memory cell. The purpose of this cell is to store relevant information that could be used many iterations into the future. The flow of information in and out of this cell is regulated by input, output and forget gates. These gates learn what type of information is useful to store, output, and forget. This allows for the LSTM network to ”remember” information many data points into the future.
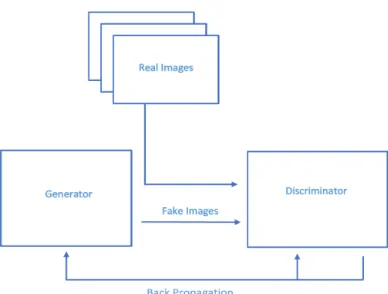
Figure 3.2: Generative Adversarial Network schema
3.2
Generative Adversarial Networks
Generative Adversarial Networks were created in 2014 as a tool to create new data samples [3]. GANs have two main components: the generator and the discriminator. In many machine learning models, the goal is to approximate some label, y, given some number of variables, x. This can be denoted as the probability of y given the distribution x, P(y|x). The generator’s function is the contrary. The generator approximates x given yP(x|y). In order to train this model, the generator needs a measure of how well it is approximating the x values. In order to provide this measure, a second model is introduced. The discriminator approximates the probability any given x is produced by the generator. The ability of the discriminator to differentiate between the produced x values and the real x values is a direct measure of the generators performance.
The driver of the GAN algorithm is a minimax function where the generator’s reward is the discriminator’s loss and the discriminator’s reward is the generator’s loss. Over time, both the generator and discriminator become increasingly good at their task, and the generator will be able to produce data indistinguishable from real-world data. The minimax function is shown below, in equation 3.1. Here,logD(x)is the approximated probability the real data distribution, x, is indeed real. The discriminator is more correct as this value trends towards 1. The valuelog(1−D(x)) is the approximated probability the generated data distribution,G(z), is real. The discriminator is more correct asD(x)trends towards 0, and therefore more correct aslog(1−D(x))trends towards
1. Thus, the discriminator wants to maximize the sum oflogD(x) andlog(1−D(x)), while the generator want to minimize the sum.
min
G maxD V(D, G) =Ex∼pdata(x)[logD(x)] +Ez∼pz(z)[log(1−D(G(z)))] (3.1)
3.3
GraphGANs
After the introduction of the GAN in 2014, countless variants have been proposed. Its versatility has allowed researchers to interchange the different components with various types of machine learning models. GANs have performed exceptionally well with rendering artificial images which are virtually indistinguishable from real-world images. Thus, a vast majority of research has been conducted on optimizing the GAN framework for image production. An exception to this trend is the Graph Generative Adversarial Network (GraphGAN), which was proposed by Wang et al [13]. The graphGAN uses a generatorG(v|vc)to find the connectivity distributionp(v|vc), wherevcis a selected node. The goal is for the generator to generate the most likely edges to form fromvc. The discriminator tries to distinguish between real vertex pairs and generated ones. While this method is good for the creation of edges in an already existing graph, it does not allow for the creation of new nodes, and thus expansion of a graph.
Chapter 4
Methods
The floorplan problem can be broken down into two sub-problems:
1. The model needs to learn how to generate each room type in the context of rooms that have already been generated
2. The model needs to learn how to assemble rooms together.
To solve the first sub-problem, we propose a sequence model that is trained to generate a list of rooms with their respective feature vectors. This model takes an existing list of rooms and generates the next room in the sequence. The generated room is added onto the list of rooms and the process is repeated as necessary.
In order to solve the second sub-problem, we consider the floorplan as a graph. In the graph representation, rooms are considered nodes and adjacencies between rooms are edges. By finding realistic edges between nodes in this graph, we are able to gain information on how rooms should be assembled. From the generated list of rooms, we consider all possible edges between any two rooms. These edges are given to a discriminator, which prunes unrealistic edges. The output of the discriminator is a final edge set for the generated floorplan.
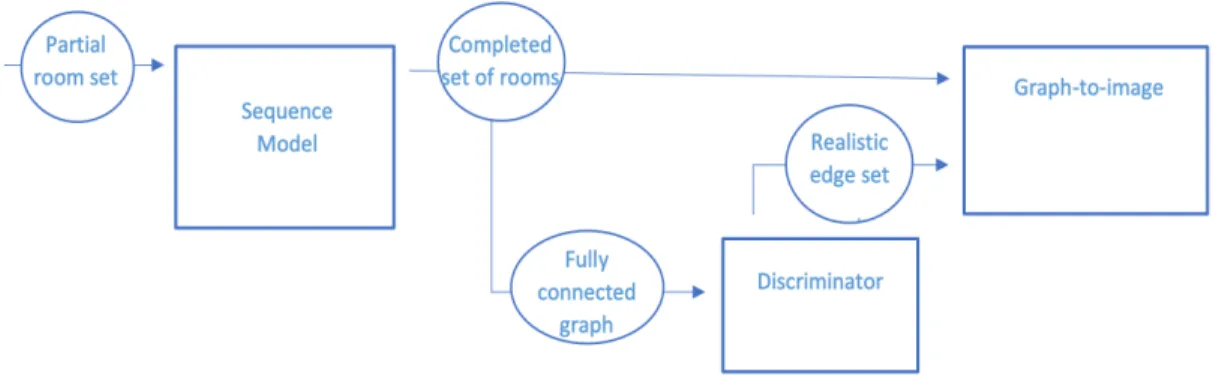
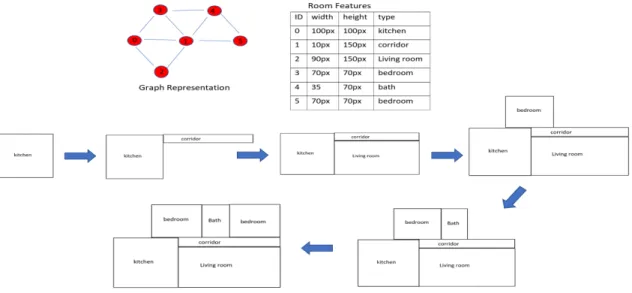
From the two models, we obtain both a feature vector and an edge set, completing our graph representation. We convert the graph representation into a full floorplan through a graph-to-floorplan algorithm detailed in 4.3. A diagram of this pipeline is shown in figure 4.1.
Figure 4.1: Hybrid Model Architecture
4.1
Generation of room features through sequence prediction
We consider the rooms of a floorplan as a sequence. We reason about floorplans in this way because we believe the next room in a sequence of rooms depends heavily on the context of the already exist-ing rooms and must obey certain patterns and relationships in order to be passable for work created by a human. A sequential machine learning model will be able to learn these patterns and rela-tionships, and as a result, be able to predict the next item in the sequence. However, these patterns and relationships can become increasingly complex through higher dimensional representations of rooms. In high detail, rooms can be represented with size, material, shape, lighting, etc. Recurrent neural nets have been shown to perform well when predicting the next items in a sequence, even in high dimensional data sets. Furthermore, a variant of recurrent neural networks, long-short-term-memory networks, are especially capable of retaining significant contextual clues over longer sequences. This becomes important when considering larger buildings. For these reasons, we chose a long-short-term-memory network as our sequential model.
In order for the model to learn patterns and relationships in the sequence, it is necessary for the sequence to be consistently ordered. We ordered the floorplan based on position. Our sequence began with the top-left most room in the floorplan, moving first to the right, then downwards, then to the left (in a ”snaking” manner). Formally, if shared walls form connections between rooms, the sequence of rooms is generated via a depth-first-search algorithm beginning with the top-left room and assigning preference to (”right”,”left”,”down”,”up”) when ordering neighbors.
given to the model is 2 dimensional. For our experiments, we identified three critical features: width, height, and type of the room. Without these features, it would be impossible to visually construct a room. The model reads the critical features of the existing rooms and outputs the same features of the next room in the sequence. The network is a many-to-one function. Given a number of rooms, the model predicts the next room in the series of rooms. The new room is also represented as a vector of characteristics, and is added onto the sequence. This process is repeated until the desired number of rooms is reached.
4.2
Assembly through graph edge prediction
The sequential model is able to generate a set of rooms; however, to create a floorplan, we need both a set of rooms, and information on how these rooms are connected. We believe converting floorplans into graphs and introducing a model capable of graph representation learning is the best way to learn room connectivity. This is because the graph representation of a floorplan allows a direct encoding of the structural knowledge of a floorplan.
In this representation, each room is considered a node and shared walls are considered edges. The graph can be denoted byG(V|E), whereV is the set of vertices andE is the set of edges. In this example, vertices are used synonymously with nodes or rooms. Edges must be undirected, and each vertex must have an edge with at least one other vertex in the graph. By learning to construct edges between nodes in this graph representation, the model is able to learn adjacencies between rooms.
We learn to construct edges between nodes by constructing a discriminator capable of differen-tiating between real and fake edges. This discriminator reads the critical features of two rooms: the width, height, and room type, and predicts the probability these two rooms are adjacent.
After all rooms are constructed via the sequential model, we represent these rooms as nodes in a fully connected graph. Each edge in this fully connected graph is assessed by the discriminator. Edges which are considered to be fake are pruned out of the graph. After the process is complete, the remaining graph contains only edges which are considered to be realistic.
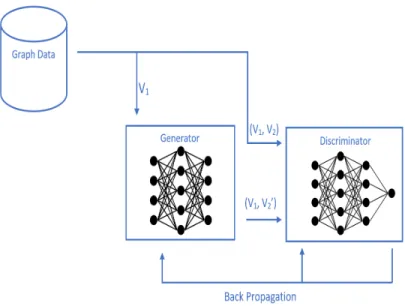
We trained the discriminator as a part of a generative adversarial network. We altered the exist-ing GraphGAN to create a model that can evaluate the likelihood that any two nodes are connected. We propose a slight alteration to the existing graphGAN paradigm. We define the Generator,
Figure 4.2: Graph Generative Adversarial Network
discriminator,D, such thatD(vi, vj)calculates the probability that the edge[vi, vj]belongs inE. We put our generator and discriminator in aminimaxgame so that our generator tries to create an edge with an existing node and a generated node, while our discriminator tries to discern between real and fake edges.
min
G maxD V(D, G) =Ex∼pdata(x)[logD(v1, v2)] +Ez∼pz(z)[log(1−D(v1, G(v1)))] When training, the discriminator and generator work in opposition, as an increase in each model’s reward directly leads to an increase in the other model’s loss. However, when generating a graph, both models are useful. The generator, trained to create realistic nodes, adds nodes to the graph by choosing an existingvand predicting avc. Thevcis added to the graph, then the discriminator, which is trained to detect realistic edges, tests pairs[vi, vc]for allviin existing graph. AnyD(vi, vc) value above a certain threshold results in the creation of edge(vi, vc).
4.3
Graph to image
Our graph representation of a floorplan contains information on how each room should be repre-sented in space (using their width and height features) and which rooms are adjacent to each other. However, our graph representation does not show a spacial relationship across rooms. One way to express special relationships is to assign each room coordinates in a coordinate plane. We assume
Figure 4.3: Graph to image process
rooms can only hold a rectangular shape, thus, a room can be represented with just 2 coordinate points, the minimum x and y values as well as the maximum x and y values (the top left and bottom right corners). The goal of the graph to image algorithm is to convert a graph representation of a floorplan to a list of coordinate points, one for each room. A floorplan can be seen as an image when each room is plotted on a coordinate plane. In the rest of this section, the coordinate representation of a floorplan is referred to as an ”image”.
The graph to image algorithm generates all possible images that can be constructed using the set of rooms and room adjacencies provided by the sequence and adversarial model. There are many possible images that can be formed from one graph representation of a floorplan. Generally, the more edges in the graph, the smaller the solution set because of increased constraints. The algorithm iterates through the graph, converting nodes in the graph to coordinates in the image. A room can generally be added in different positions in the existing image. Therefore, the algorithm maintains a set of all possible images. The set grows with each possible image that can occur as a result of a node being added.
When iterating through the graph, the algorithm begins with an outside node and adds neighbors in DFS order until all nodes have been satisfied. A node is only added to the image if it can satisfy all of the adjacency requirements with the rooms that currently exist in the image. A node can be placed in at most 4 different places, either ”up”, ”down”, ”left, or ”right” of it’s neighbor(s).
solutions, the average case is much, much lower, as a room with more than one edge has significantly fewer placement options. Figure 4.3 shows an example of a progression of one solution when converting a graph and accompanying feature matrix to an image. If a single image must be chosen, the image that is most compact is chosen.
Compactness is determined by dividing the total area covered by the total area utilized. Total area covered is determined by multiplying the differences between the minimum x and y value to the maximum x and y value. The total area utilized is the sum of each room’s area. If the total area covered divided by the total area utilized is 1, then the floorplan’s shape is a perfect rectangle.
4.4
Co-creative framework
Above, we assume the floorplan is being constructed using no assistance from a human observer. A significant benefit of the approach is that it can be used to co-creatively generate floorplans. In the co-creative framework, the steps are the same: rooms are predicted using the sequential model, room adjacencies are predicted using the discriminator, and rooms are added onto the coordinate representation of the floorplan. Unlike the previous framework, the co-creative framework only generates one room at a time. This allows a human creator to choose which rooms the model creates and intervene at any point. We assume part of the floorplan is already created, and represented using coordinate points.
4.4.1 Generation of room features through sequence prediction
If a floorplan already exists as a vector of coordinate points, the critical features of rooms are first extracted. The width and height are found by finding the difference between the minimum and maximum x and y values. Room features are ordered in a sequence based on their position (in the same way detailed in section 4.1) and given to the sequential model. The model then predicts the features of an additional room.
4.4.2 Finding room adjacencies
Adjacencies between the newly generated room and existing rooms are found using the same dis-criminator detailed in 4.2. This is done by first considering the all edges between the new room and the existing rooms. The discriminator is given these edges and predicts the likelihood each edge is
real. All edges which are unlikely to exist are pruned out. The result of the discriminator is a graph which contains realistic edges connecting the newly created room and previously existing ones.
4.4.3 Adding the new room onto the image
After the new room is generated and adjacencies between existing rooms are detected, the coordinate points are found for the room. The coordinate points for the new room are selected so that the new room is the appropriate width and height and is adjacent to the appropriate rooms.
Chapter 5
Evaluation
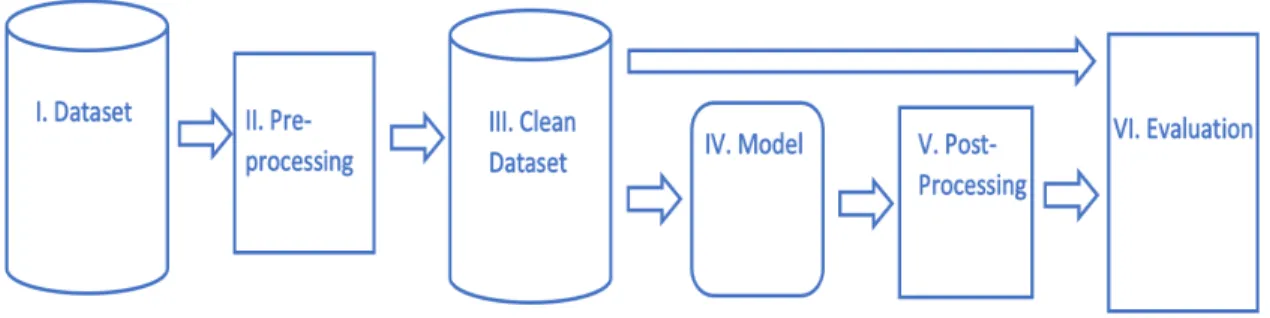
We compared our hybrid model to three types of baselines. We used the sequence and graph models individually to construct floorplans. On their own, each component of the hybrid model provides a baseline that allows us to evaluate the effectiveness of combining the two. We also created an average-based model, which generated floorplans based on aggregated statistics from our dataset. In order to evaluate our method we designed an algorithm to compare floorplans. While it is difficult to measure the floorplan’s ability to serve human interest, we decided to compare the overall shape of the plans. We did this by finding the overlap of the two floorplans when one is optimally overlaid over another. Details on how we found this overlap are below. Each model was given the first room of a real plan from the vector-graphics representation of the LIFILL data set and was tasked to complete the rest of the plan. The overlap between the real plan and the generated plan was then calculated.
Figure 5.2: Data in vector form and visualized
5.1
Data
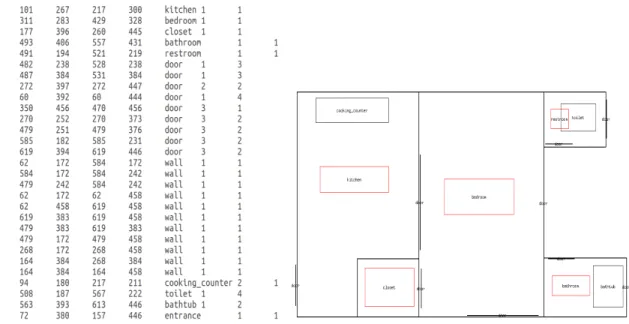
We utilized the vector-graphics representation of the LIFULL data set. The LIFULL dataset con-tains raster images of 100,000 floorplans [8]. The vector-graphics representation of this data set was created algorithmically in the project ”Raster-to-Vector: Revisiting Floorplan Transformation” by Lui, Wu, Kohli, and Furukawa [8]. Each vector within the dataset represents a different object (such as a room label, wall, door, or object) and contains[x1, y1, x2, y2, category, dump1, dump2]Note:
x1 < x1, y1 < y2. It’s also important to note that room labels do not specify the dimensions of a room, instead, a room label is an object with arbitrary dimensions inside of the walls that compose the actual room. This is largely because some rooms are not of a simple rectangular shape and thus cannot be represented fully by a singlex1, y1, x2, y2representation.
5.1.1 Preprocessing
In order to train our sequence model, we needed the width, height, and room type of each room in the floorplan. Our data did not have room dimensions, instead, it defined room labels within the walls of a room. These room labels were formed from arbitrary coordinates, and gave no indication of the room’s dimensions. The right side of figure 5.2 shows an example of a floorplan visualized. Here, the room labels are highlighted in red.
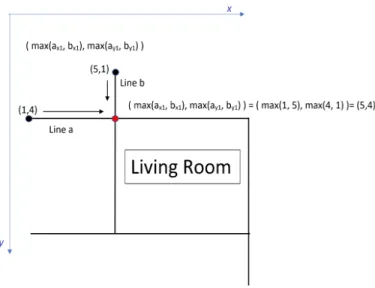
Figure 5.3: Approximating the (x1, y1) values of a room using the upward and leftward walls
Although some rooms are impossible to represent using just width and height dimensions, it was necessary to approximate these features so that our model could learn adjacency’s between rooms and rough dimensions.
In order to find the width and height of the room, we first found the minimum and maximum x and y values that composed the room. The minimum x and y values are referred to as (x1,y1) while the maximum x and y values are referred to as (x2,y2). Our preprocessing algorithm first found the walls that enclosed the room. These were the walls that were immediately above and below, left and right of the room label provided in the dataset (the algorithm only considered walls that spanned the full length of the room label).
Next, the walls are used to approximate the (x1,y1) and (x2,y2) corners. It is important to remember each wall has its own (x1,y1) and (x2, y2) corners. For horizontal walls, the y1 and y2 values are the same, for vertical walls, the x1 and x2 values are the same. A room corner is formed from a horizontal and vertical wall. If the walls both stop at the same corner, the relevant (x,y) values of the horizontal and vertical walls will be the same. However, it is usually the case that only a small part of a wall is relevant in enclosing a specific room. In other words, any given wall is most likely to extend past the confines of a room. When determining a corner of a room using horizontal and vertical walls, the x and y values should be chosen such that they are closest to the center of the room.
the x1 and y1 values can be found by finding the intersection of these two lines. The intersection of the lines occur below the beginning of the vertical line, and to the right of the beginning of the horizontal line. In this coordinate plane, y increases in the downward direction and x increases in the rightward direction. Thus, the appropriate y can be found by finding the maximum of the two lines’ y1 values (the value closest to the bottom) while the appropriate x can be found by taking the maximum of the two lines’ x1 values (the value closest to the right). This process is shown in 5.3.
Similarly, when finding the (x2,y2) values of the room, walls often extend past their intersection. In this case, the walls extend too far to the right and too far below, so the intersection can be found by finding the minimum of the walls’ x2 and y2 values.
5.1.2 Clean Dataset
Our clean dataset is smaller than the original vector-graphics representation of the LIFULL dataset. This is because we filtered out many floorplans due to a high amount of error during preprocessing. Error was generally caused by the inability of certain rooms to be approximated as a vectors of length 4. Our clean dataset contains 23000 separate floorplan files. Each floorplan file contains rooms and some objects in vector representation form. This form isx1, y1, x2, y2, rt. Wherex1 <
x2, y1< y2and rt represents the room category. Although our current model ignores other objects, we hope they will be useful in future projects that can both create the layout and place objects inside in an intelligent manner. The dataset contained single story houses/apartments.
5.2
Baselines
To evaluate quality of our method, we compare against the following baselines: sequence-only approach, graph-only approach, and an averages-based approach. Each of these baselines will be discussed in greater detail below.
5.2.1 Sequence
By adding a room’s directional relationship to the previous room in the sequence, the sequence approach can be used to generate floorplans on its own. The directional relationship is the angle between the top left nodes of the two rooms. For instance, the angle between room j and room i is found from tan(y1j - y1i / x1j - x1i ). The generated sequence is directly used as an input for a sequence-to-floorplan algorithm, which uses the directional relationship between rooms to calculate
each room’s position. The algorithm finds the position of the next room in a sequence by referencing the position of the previous room (the first room in the sequence can be placed at some arbitrary point). The algorithm adds rooms by satisfying the following constraints: the new room’s top left corner and the previous room’s top left corner form the predicted angle, the previous room and the new room are adjacent, each room is the predicted height and width.
5.2.2 Graph
The graph approach can be used as a standalone model by using the generator from the adversarial network to predict a neighboring room to one of the existing rooms. After a room is generated, the discriminator checks for new edges between the recently created room and the current existing rooms. This is done for each room that needs to be generated. Once the graph is complete, it is converted to a floorplan using the algorithm detailed in section 4.4.
5.2.3 Average
The average model acted very similarly to the sequential model. Rather than using learned weights, the average model predicted rooms based on the averages found in the dataset. The percent likeli-hood of each room type was used to stochastically determine the next room type in the sequence. The average width and height of that room type was used as the width and height of the newly generated rooms. The direction between one room and the next was determined using the average angle between the two room types found in the training data. Finally, the sequence was converted to a floorplan using the sequence to image algorithm discussed in section 5.5.1.
5.3
Training
5.3.1 Sequence
In training, the model was given input sequences of length 15 and a single output entry representing the next room in the sequence. If the input sequence did not have 15 rooms, the entries in the sequence were zero-padded. A single floorplan was divided into many training examples. For each room,ti, in the floorplan, a training example was formed via a zero padded vector containingt0to
ti−1as the x variables whileti was the y variable.
It was necessary for the sequence to be consistently ordered. Our sequence began with the top-left most room in the floorplan, moving first to the right, then downwards, then to the left (in
a ”snaking” manner). Formally, if shared walls form connections between rooms, the sequence of rooms is generated via a depth-first-search algorithm beginning with the top-left room and assigning preference to (”right”,”left”,”down”,”up”) when ordering neighbors. The directions are represented by angles in radians, so the words ”right”, ”left”, ”down”, and ”up” refer to the range of radians that would face the corresponding direction i.e the interval(−π/4, pi/4)points ”right”.
Two different networks and two different room representations were tested. Each combination of network and representation was tried for a total of 4 experiments. Each network was trained for 5 epochs on a training set size of 20,000 floorplans with a batch size of 100 plans. The network had two layers of 128 and 256 nodes. The model’s loss was mean squared error. We used ADAM as the optimizer.
Below the different networks and representations are listed.
• Network 1: LSTM network
• Network 2: BiDirectional LSTM
• Representation 1: width, height, room type.
• Representation 2: width, height, room type and the type of the next room in the sequence. The type of the next room was added in this model to allow co-collaboration when designing a floor-plan. A human observer would be able to specify a desired room and the model would generate a room tailored to that request.
5.3.2 Graph GAN
Our adversarial model consisted of two feed forward neural networks with two layers containing 128 and 256 nodes. One for the generator and one for the discriminator. The generator took a three dimensional vector as input and produced a three dimensional vector as output. These vectors represented the width, height, and room type of individual rooms. The discriminator took a 2 by 3 dimensional vector as input, which represented two rooms, and output a single number, the probability those rooms are adjacent. The model trained for 30 epochs on a training set of size 20000.
The model was trained with room adjacencies from the clean dataset. The room adjacency contains two rooms that share a wall in a floorplan, let these rooms be denotedroom1 androom2. The generator was given room1 and generated a second room, roomF ake. The combination of
Figure 5.4: Overlap calculations for sequential and hybrid models using the LSTM, BiDirectional LSTM networks as well as two separate representations of rooms. The GraphGAN method’s per-formance is shown second to the right. The Average-based model is shown on the right
room1androomF akeis considered a fake adjacency, or edge. The real edge and the fake edge were fed into the discriminator, which approximated the probability of each being real. After assessing the accuracy of the discriminator, the generator and discriminator were updated.
5.4
Overlap Calculation
We calculated the maximum overlap between two floorplans when positioned on top of each other at different orientations. This is a difficult calculation, especially because each floorplan, in theory, could be extremely complex with any number of sides.
To compute the maximum area shared between two floorplans, we first adjusted the coordinated of the floorplans such that they shared their top left corner. We then found all the coordinates that lie within each floorplan. We defined two sets of coordinates, one for each floorplan. The overlapping of the two plans can be calculated by finding the intersection of the aforementioned sets. By dividing the size of the intersection by the size of the union, we were able to find the percentage overlap of the two plans.
We calculated this value at 4 different orientations. After each measurement, we rotated one of the floorplans by 90 degrees then took another measurement. The maximum value was used.
5.5
Results & Discussion
To test our approaches, we sampled the first room from a real floorplan. The first room was given to a model, which generated and assembled the remaining rooms. The overlap was then calculated between the real floorplan and the generated one.
We tested the stand-alone sequence, stand-alone graph, combined, and average approaches. We ran 4 different trials for both the combined and sequence approach. These trials tested the combinations of 2 different room representations and 2 different networks during the generation phase of the pipeline. In figure 5.4, the combined approach experiments are grouped with sequence approach experiments that used the same representation and network. Also pictured in 5.4 is the stand-alone graph and average approaches.
The stand-alone sequence approach using the LSTM network and the first representation of a room is shown in blue on the far left side. The hybrid model using the same representation and network is shown in red. The floor plans generated using the stand-alone sequence approach are only 14 percent similar, on average, to the ground truth floorplans, while the hybrid model, using the same sequential network, had a 31 percent similarity.
In the second set of experiments, the LSTM network is used in conjunction with the second representation of a room. In these experiments, the stand-alone sequence model performed slightly better than the stand-alone sequence model in the previous experiment, while the hybrid model per-formed slightly worse. However, it remains consistent that the hybrid model performs significantly better than it’s stand-alone sequence counterpart; the results were an 18 percent average similar-ity and a 32 percent average similarsimilar-ity for the stand-alone sequence approach and hybrid approach respectively.
In the third experiment, the BiDirectional LSTM network is trained with the first room repre-sentation. The stand-alone sequence approach scored an average of a 19 percent similarity while the hybrid approach scored an average of a 27 percent similarity.
In the Fourth experiment, the BiDirectional LSTM network is trained with the second room representation. The stand-alone sequence model performs similarly to the previous BiDirectional model, with a score of 19 percent; however, the combined approach performs much better, with a score of 31 percent. The stand-alone graphGAN performance is shown. The graphGAN performs much better than each sequence baseline, with an average score of 22 percent, but is still not as good any of the hybrid approaches. Finally, the averages-based approach was outperformed by
nearly every other model, with an average score of 15 percent.
The sequence approach seemed to produce rooms with reasonable features; however, the floor-plans constructed often lacked a realistic shape. This is likely because much of the information about a floorplan’s shape is lost when converting it into a sequence. The graph approach produced plans of reasonable shapes; however, often overestimated the size of each room. This is likely be-cause the generator in the graph approach did not have the full context of all rooms that already existed. The combined approach was able to use the benefits of both models, producing reasonable features for generated rooms using the sequence approach and connecting such rooms using the graph approach. As a result, the combined approach was able to outperform the two stand-alone models, as well as the average-based model, using our metrics.
Chapter 6
Conclusion
The floorplan generation problem has existed for many decades. Although the problem has not changed, various approaches have been proposed throughout the years as computing tools (both algorithmic and hardware) have advanced. Our proposal builds off of previous proposals as a com-bination of deep learning techniques and graph application techniques. We propose a method of floorplan generation that utilizes a sequential machine learning model to generate rooms and a graph model to predict adjacencies between rooms.
In our experiments, our hybrid model outperformed both of its components when they were tested on their own. Furthermore, our model was also able to outperform an average-based model that generated floorplans using dataset average statistics. We believe this is because the hybrid approach was allowed to use the best aspects of each model.
Although our results were interesting, we believe they are quite limited. We recognize there is a large room for improvement in reducing the limitations on room shapes. For our purposes, it was necessary to impose a rectangular shape on all rooms, but this requirement does not exist in the real world, and may even reduce the feasibility and artistic nature of design. Our Artificial Neural Network methods, however, may allow for changes in input sizes that could lead to a capability of producing rooms of various shapes given a dataset that can accurately represent such rooms.
Bibliography
[1] Jean Cousin.Organisation topologique de l’espace architectural.: Topological organization of architectural spaces.72.01. Presses de l’Universit´e de Montr´eal, 1970.
[2] Per Galle. “An algorithm for exhaustive generation of building floor plans”. In: Communica-tions of the ACM24.12 (1981), pp. 813–825.
[3] Ian Goodfellow et al. “Generative adversarial nets”. In:Advances in neural information pro-cessing systems. 2014, pp. 2672–2680.
[4] John Grason. “An approach to computerized space planning using graph theory”. In: Pro-ceedings of the 8th Design automation workshop. ACM. 1971, pp. 170–178.
[5] Karol Gregor et al. “DRAW: A Recurrent Neural Network For Image Generation”. In:CoRR
abs/1502.04623 (2015). arXiv:1502.04623.URL:http://arxiv.org/abs/1502. 04623.
[6] Natasha Jaques et al. “Generating Music by Fine-Tuning Recurrent Neural Networks with Reinforcement Learning”. In:Deep Reinforcement Learning Workshop, NIPS. 2016.
[7] Peter Hirsch Levin. “Use of graphs to decide the optimum layout of buildings”. In: The Architects’ Journal7 (1964), pp. 809–815.
[8] Chen Liu et al. “Raster-to-vector: revisiting floorplan transformation”. In:Proceedings of the IEEE International Conference on Computer Vision. 2017, pp. 2195–2203.
[9] Paul Merrell, Eric Schkufza, and Vladlen Koltun. “Computer-generated residential building layouts”. In:ACM Transactions on Graphics (TOG). Vol. 29. 6. ACM. 2010, p. 181.
[10] Jeremy Michalek, Ruchi Choudhary, and Panos Papalambros. “Architectural layout design optimization”. In:Engineering optimization34.5 (2002), pp. 461–484.
[11] Peter Potash, Alexey Romanov, and Anna Rumshisky. “Ghostwriter: Using an lstm for auto-matic rap lyric generation”. In:Proceedings of the 2015 Conference on Empirical Methods in Natural Language Processing. 2015, pp. 1919–1924.
[12] Ilya Sutskever, James Martens, and Geoffrey E Hinton. “Generating text with recurrent neu-ral networks”. In:Proceedings of the 28th International Conference on Machine Learning (ICML-11). 2011, pp. 1017–1024.
[13] Hongwei Wang et al. “Graphgan: Graph representation learning with generative adversarial nets”. In:Thirty-Second AAAI Conference on Artificial Intelligence. 2018.
[14] Tsung-Hsien Wen et al. “Semantically conditioned lstm-based natural language generation for spoken dialogue systems”. In:arXiv preprint arXiv:1508.01745(2015).
[15] Xingxing Zhang and Mirella Lapata. “Chinese poetry generation with recurrent neural net-works”. In:Proceedings of the 2014 Conference on Empirical Methods in Natural Language Processing (EMNLP). 2014, pp. 670–680.
Vita
Genghis Goodman
Education
• University of Kentucky
B.S - Computer Science Aug ’15 - May ’18
B.S - Economics Aug ’15 - May ’18
Professional experience
• UNIVERSITY OF KENTUCKY - Lexington, KY Aug ’18 - May ’19 APP Math Graduate Teaching Assistant
• JP MORGAN CHASE & CO - Chicago, IL June ’18 - Aug ’18 Summer Technology Analyst
• UNIVERSITY OF KENTUCKY - Lexington, KY Mar ’18 - May ’18 R-workshop Student Lecturer
• UNIVERSITY OF KENTUCKY - Lexington, KY Aug ’17 - Dec ’17 Undergraduate Teaching Assistant
• GE APPLIANCES - Louisville, KY May ’17 - July ’17
Cloud Architect Intern
• UNIVERSITY OF KENTUCKY - Lexington, KY Jan ’17 - May ’17 Undergraduate Researcher
• MOSELEY BIOINFORMATICS LAB - Lexington, KY Sep ’14 - May ’18 Paid Lab Assistant
Scholastic and Professional Honors
• DEANS LIST - Lexington, KY Aug ’15 - May ’19
• JP MORGAN CODE FOR GOOD - Chicago, IL Sep ’17
1st Place Winner
• JP MORGAN CODE FOR GOOD - Columbus, OH Oct ’16
1st Place Winner
• CHELLGREN STUDENT FELLOW - Lexington, KY Apr ’16 - May ’18
• KHEES SCHOLARSHIP SCHOLARSHIP - Lexington, KY Aug ’15 - May ’18
• COMMONWEALTH SCHOLARSHIP - Lexington, KY Aug ’15 - May ’18