ISSN (print): 1978-1520, ISSN (online): 2460-7258
DOI: 10.22146/ijccs.37666 127
Optimization of ARIMA Forecasting Model Using
Firefly Algorithm
Ilham Unggara*1, Aina Musdholifah 2, Anny Kartika Sari 3
1
Master Program of Computer Science; FMIPA UGM, Yogyakarta, Indonesia
2,3
Department of Computer Science and Electronics, FMIPA UGM, Yogyakarta, Indonesia e-mail: *[email protected], [email protected] , [email protected]
Abstrak
Prediksi time series bertujuan untuk mengendalikan atau mengenali perilaku sistem berdasarkan data pada periode waktu tertentu. Salah satu metode yang banyak digunakan dalam prediksi time series adalah Autoregressive Integrated Moving Average (ARIMA). Akan tetapi, ARIMA memiliki kelemahan dalam menentukan model yang optimal. Riset ini menggunakan algoritme firefly untuk melakukan optimisasi model ARIMA (p,d,q) dengan mencari nilai Akaike Information Criterion (AIC) terkecil untuk menentukan model ARIMA terbaik. Data yang digunakan dalam penelitian yaitu data saham harian Indeks Harga Saham Gabungan (IHSG) periode Januari 2013 sampai dengan Agustus 2016 dan data kunjungan wisatawan mancanegara ke Indonesia periode bulan Januari 1988 sampai dengan November 2017. Hasil pengujian menunjukkan, untuk data IHSG, hasil prediksi dengan model ARIMA Box-Jenkins menghasilkan RMSE 49,72, sedangkan prediksi dengan model ARIMA Optimisasi menghasilkan Root Mean Square Error (RMSE) 49,48. Untuk data kunjungan wisata mancanegara, hasil prediksi dengan model ARIMA Box-Jenkins menghasilkan RMSE 46088,9, sedangkan hasil prediksi dengan ARIMA optimisasi menghasilkan RMSE 44678,4. Dari hasil tersebut dapat disimpulkan bahwa optimisasi model ARIMA dengan Algoritme Firefly menghasilkan model peramalan yang lebih baik dari pada model ARIMA tanpa Optimisasi. Kata kunci—Optimisasi, Peramalan, ARIMA, Algoritme Firefly, AIC, RMSE.
Abstract
Time series prediction aims to control or recognize the behavior of the system based on the data in a certain period of time. One of the most widely used method in time series prediction is Autoregressive Integrated Moving Average (ARIMA). However, ARIMA has a weakness in determining the optimal model. This research utilizes firefly algorithm to optimize ARIMA model (p, d, q) by finding the smallest Akaike Information Criterion (AIC) value in determining the best ARIMA model. The data used in the study are daily stock data of Indonesia Composite Index (IHSG) for the period of January 2013 until August 2016 and data of foreign tourist visit to Indonesia for the period of January 1988 to November 2017. The study finds, for IHSG data, the prediction result obtained with ARIMA Box-Jenkins model produced Root Mean Square Error (RMSE) 49.72, whereas the prediction with the ARIMA Optimization produced RMSE 49.48. For the data of foreign tourist visit, the prediction result with ARIMA Box-Jenkins model generated RMSE 46088.9, whereas the prediction with ARIMA Optimization generated RMSE 44678.4. From these results it can be concluded that the optimization of ARIMA model with firefly algorithm produces better forecasting model than ARIMA model without optimization.
1. INTRODUCTION
Time series analysis is an important tool for predicting the future based on past history. Forecasting is a powerful assistant for decisions making and planning for the effective management of modern organizations. It is an essential part of econometric analysis [1], for some people perhaps the most important, to estimate economic variables, such as gross domestic product, inflation, stock prices, exchange rates and unemployment rates. Time series forecasting is a growing field of interest, playing an important role in many practical fields such as economics, finance, marketing, planning, meteorology and telecommunications.
One of the most widely used method in time series prediction is Autoregressive Integrated Moving Average (ARIMA). [2] In comparison to Autoregressive Conditional Heteroskedasticity (ARCH) and Generalized Autoregressive Conditional Heteroskedasticity (GARCH), ARIMA produced smallest error in predicting the exchange rate of IDR against USD for the period of January 3rd, 2000 to July 7th, 2014. [3] Forecasting using the ARIMA method on ISO 14001 certification data in the Americas and its 13 countries between 1996 and 2015 showed that the prediction results were close to realization.
Nevertheless, although ARIMA is better at forecasting than the ARCH and GARCH models, the method has a weakness in determining the optimal model [2]. Therefore, a supporting algorithm is needed to optimize the ARIMA model. [4] A combination of linear and nonlinear methods could improve the accuracy of the time series data. [5] Application of Modified Firefly Algorithm (MFA) obtained Support Vector Regression (SVR) parameters accurately and effectively on the data of electrical load demand in Fars, Iran. [6] A multilayer perceptron (MLP) hybrid model integrated with the Firefly Optimizer Algorithm (MLP-FFA) to predict wind speed in northwestern Iran resulted in a lower RMSE score than the classic MLP. The firefly algorithm developed [7] is the best metaheuristic algorithm for optimization.
This research combines two methods which are ARIMA [8] and Firefly Algorithm [7] to analyze two time series data of the Indonesia Composite Index (IHSG) [9] and foreign tourist visit to Indonesia [10]. From these two data testing, it is presumed that the ARIMA model with firefly algorithm could find the most optimal model. The ARIMA Optimization process uses firefly algorithm to search for the smallest AIC value, [11] which is the criteria to find the best ARIMA (p,d,q) models [11] and determines the parameters of the firefly algorithm to perform optimization [8]. The ARIMA optimization model obtained is then used for forecasting. Forecasting results are calculated based on its accuracy using Root Square Mean Error (RMSE) and its model quality using Akaike Information Center (AIC) [12]. The results will be compared with the search results of the ARIMA Box-Jenkins model [13]. The ARIMA Optimization model is expected to improve the accuracy of forecasting.
2. METHODS
The research methods in this study involves the process of literature studies, data collection and selection, ARIMA Optimization model platform development, data testing on the optimization model and its comparing model and result analysis. The IHSG data were taken from Yahoo Financefor the period of January 2013 to August 2016, i.e. 888 days [9]; whilst foreign tourist visit data were acquired from the Central Bureau of Statistics for the period of January 1988 to November 2017, i.e. 359 months [10]. The ARIMA Optimization model was developed using R-Studio package which are R-Studio 3.4.1, MetaheuristicOpt 1.0.0, Tseries 0.10-44 and Forecast 8.3. The final stage of the research is testing both data in the ARIMA Optimization model and ARIMA Box-Jenkins model as its comparing model. The results are then analyze to find the best forecasting model with the smallest RMSE and AIC values.
2.1 ARIMA Model Box-Jenkins
Autoregressive Integrated Moving Average (ARIMA), popularly known as Box-Jenkins Methodology, searches the ARIMA model using an iterative approach in identifying the most appropriate model over various models. The temporary model that has been selected is tested again with the observed data to see whether the model is adequate or not. Model is considered adequate if the residuals, i.e. the predicted difference with the observed data, are distributed randomly, small and independent of each other. Stages of designing ARIMA Box-Jenkins model implemented is described in Figure 1 as follows:
Stasioner Data, Augmented Dickey–Fuller (ADF)
Model ARIMA (p,d,q) Identify the tentative
(Model ARIMA)
Autocorrelation Function (ACF) Partial Autocorrelation Function (PACF)
Estimation of parameters over the tentative model AR , MA
NO
START
Dataset
STOP Diagnostic test Residual ACF and PACF
YES
Figure 1 Model of ARIMA Box-Jenkins
1. Preprocessing of stationary identification data model. Identification of time series data model is done by stationary test of time series data through Augmented Dickey-Fuller (ADF) test. Information about data trend and stationary could be obtained from the ACF and PACF plot generated.
2. Estimation of parameters in the model. Estimation includes coefficients of the ARIMA model (φ and θ) and variance values of the residuals. The statistical t test is
used to test the significance of the estimated coefficients and the null hypothesis for the Autoregressive (AR) model parameters.
3. Selection of the best model. Prasimony, or simplicity, principle is a criteria for best model selection by choosing the most minimum AR (p) and moving average (MA) (q) parameter values. For example, between AR (1) and AR (2), the best model according to prasimony principle is AR (1) model.
4. Identification of correlation among residuals. Ljung-Box test is used upon an assumption in time series that residuals follow a white noise process which means it must be independent (uncorrelated) and normally distributed with an average of close to 0. If there is no lag out of the significance line, it can be said that there is no autocorrelations.
2. 2 Estimation of ARIMA Model using Firefly Algorithm
The search of ARIMA Optimization model using firefly algorithm is based on the best parameters in the firefly algorithm. The process of designing ARIMA Optimization model using firefly algorithm is portrayed in Figure 2 as follows:
1. Selecting the time series data used for searching the ARIMA Optimization model. 2. Initializing the population and parameters of the firefly algorithm. Initialization process
is done by determining the number of population and iterations to be performed, determining the values of β0 (base beta), γ (gamma) and α (alpha) variables to calculate the level of interest, distance and movement between i, in which the number of population is the number of solution candidates that has been determined in the determination of the candidate solution combination, as well as Max (p,d,q) and Min
(p,d,q) on the determination of ARIMA model.
Ii = f(x)
(1) 3. Determining the firefly dimensions and generating random numbers as firefly initial
position value (p,d,q). This value is a combination of previously generated candidate solutions, in which there are two dimensions, i.e. dimension i and dimension j. The number of i and j dimension is determined by the number of firefly population, that is the number of desired candidate solutions.
β = β0*e
- yr2
(2) 4. Calculating the light intensity, i.e. the AIC value, of each firefly using equation (3). To
get the light intensity value, the result value from the objective function evaluation (p,d,q) is required. Therefore, the value of fitness that has been obtained previously is used as the light intensity value of each firefly. Because the purpose of the problem is to find the minimum AIC value, the smaller the value of the function, the higher the intensity value.
AIC = -2 (3) 5. Determining the Global best (Gbest) value, which is the brightest light intensity value of all firefly, i.e. the smallest AIC value. Having obtained its intensity value, each firefly is then compared to find firefly with the smallest AIC value using equation (4). The position value of firefly with the highest light intensity will be used as the updated Gbest for the AIC value.
xi’ = xi + β0e - yr2
(xj - xj) + α (rand - ) (4)
6. Calculating the distance position and attraction between firefly with equation (5), using base beta, gamma and distance constants, the distance of each firefly to firefly with the highest intensity of light, i.e. Gbest, is calculated using Euclidea method.
(5) 7. Performing movement on firefly. The position of each firefly moves to firefly with brightest light intensity; hence producing a new position as in equation (4) except for Gbest which remains because it does not move.
8. Ranking the firefly based on its new light intensity by reducing the scrambler parameter value [14]. The fitness value generated by the new candidate solution will be used as the new firefly light intensity value.
9. Checking the candidate solution convergence. The value is said to be convergent if the firefly position reaches the goal position or the best position. However, if the new position value exceeds the minimum and maximum value limits on each dimension or it has not reached the maximum iteration, then its position should be return back in the range of values in that dimension and repeat the step of looking for new Gbest firefly until Max Generation iteration is complete.
Start
calculate the AIC value
Update best solution
Generation = MAX
Generation
AIC Firefly I > AIC Firefly J Gbest (Global best) End YES I = MAX Population Generation Generation + 1 I 0
CALCULATE AIC FIREFLY IN COORDINATES I AND J
Parameter Initialization Firefly
β0 (base beta), γ (gamma), α (alpha), Max Generation, Max Population, Max(p,d,q)
dan Min (p,d,q). Generate value (p,d,q) Generation 0 Data I I + 1 J 0 NO J = MAX Population J J + 1 NO YES RANK AIC YES NO MOVE FIREFLY I TO FIREFLY COORDINATES J NO YES
3. RESULT AND DISCUSSION
3.1 Determination of Firefly Algorithm Parameters
The parameters proposed to optimize the ARIMA model based on the most significant parameters that influence the movement of search model are presented in Table 1. Parameters that have significant influence are base beta and alpha because base beta is used to determine the random starting point while alpha is to calculate the distance between firefly in finding the brightest light intensity. The search for ARIMA Optimization model (p,d,q) is limited with values (0,0,0) to (7,7,7) for calculating the smaller AIC values with higher probability to get an optimal model of optimization.
Table 1 Testing of Firefly Algorithm Parameters
3.1.1 ARIMA Model Optimization on IHSG Data
Results from five testing conducted on IHSG data with firefly algorithm parameters, as shown in Table 2, found the same model that is (0,1,7) with AIC -5535.6. Therefore, the parameters used is the first test Generation 10, Population 100, Alpha 0.1, Gamma 1.0 and Base Beta 0.1. The process of model optimization was done within 3 minutes and 48 seconds.
Table 2 ARIMA Optimization Model Search Trial on IHSG Data No. Generation Population Alpha Gamma Base
Beta (p,d,q) AIC 1 10 100 0.1 1.0 0.1 (0,1,7) -5535.6 2 20 400 0.2 1.0 0.2 (0,1,7) -5535.6 3 20 600 0.4 1.0 0.3 (0,1,7) -5535.6 4 40 800 0.4 1.0 0.4 (0,1,7) -5535.6 5 40 1000 0.2 1.0 1 (0,1,7) -5535.6
3.1.2. ARIMA Model Optimization on Foreign Tourist Visit Data
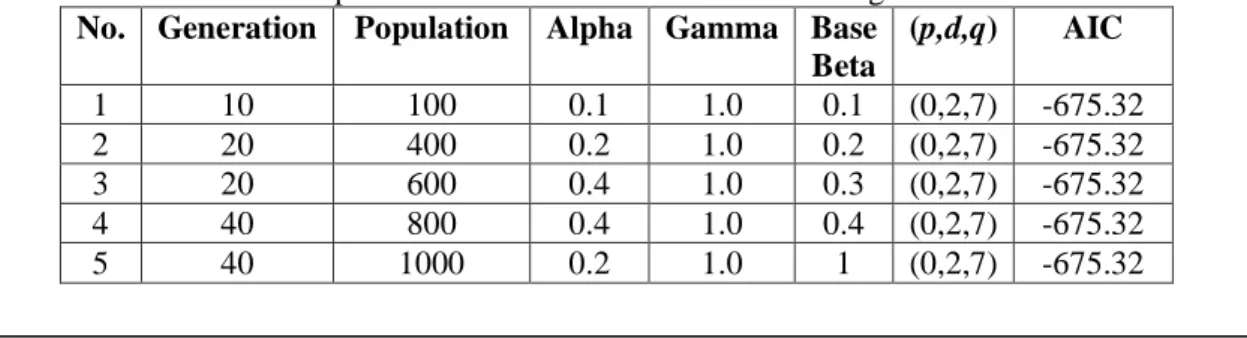
Results from five testing conducted on foreign tourist visit data with firefly algorithm parameters, as shown in Table 3, found the same model that is (0,2,7) with AIC -675.3268. Therefore, the parameters used is the first test Generation 10, Population 100, Alpha 0.1, Gamma 1.0 and Base Beta 0.1. The process of model optimization was done within 5 minutes and 58 seconds.
Table 3 ARIMA Optimization Model Search Trial on Foreign Tourist Visit Data No. Generation Population Alpha Gamma Base
Beta (p,d,q) AIC 1 10 100 0.1 1.0 0.1 (0,2,7) -675.32 2 20 400 0.2 1.0 0.2 (0,2,7) -675.32 3 20 600 0.4 1.0 0.3 (0,2,7) -675.32 4 40 800 0.4 1.0 0.4 (0,2,7) -675.32 5 40 1000 0.2 1.0 1 (0,2,7) -675.32
No. Generation Population Alpha Gamma Base Beta Min (p,d,q) Max (p,d,q) 1 10 100 0.1 1.0 0.1 (0,0,0) (7,7,7) 2 20 400 0.2 1.0 0.2 (0,0,0) (7,7,7) 3 20 600 0.4 1.0 0.3 (0,0,0) (7,7,7) 4 40 800 0.4 1.0 0.4 (0,0,0) (7,7,7) 5 40 1000 0.2 1.0 1 (0,0,0) (7,7,7)
4.1. Forecasting Results Using ARIMA Optimization Model on IHSG and Foreign Tourist Visit Data
Models that have been obtained from the optimization of ARIMA model are used for forecasting. From the IHSG and foreign tourist visit data used in searching for the optimization model, the forecasting accuracy is calculated based on RMSE value.
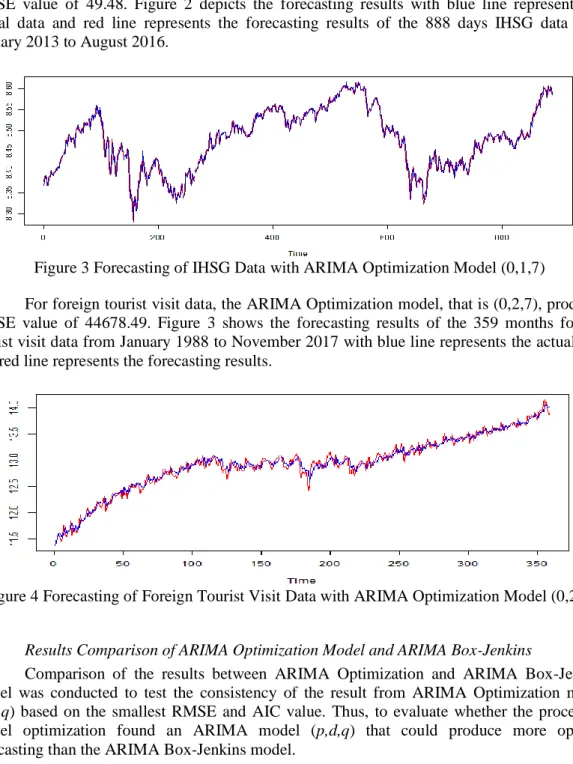
The ARIMA Optimization model obtained from IHSG data, i.e. (0,1,7), generated RMSE value of 49.48. Figure 2 depicts the forecasting results with blue line represents the actual data and red line represents the forecasting results of the 888 days IHSG data from January 2013 to August 2016.
Figure 3 Forecasting of IHSG Data with ARIMA Optimization Model (0,1,7)
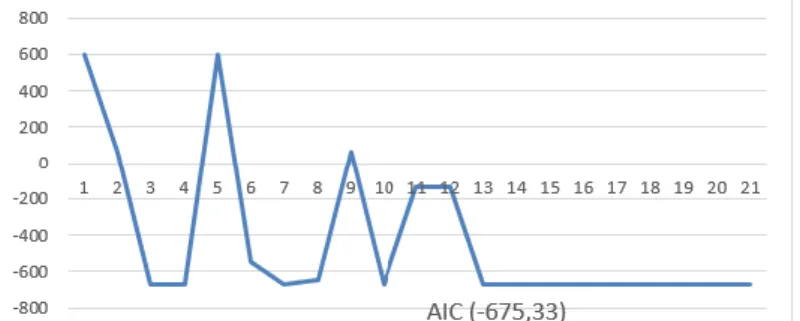
For foreign tourist visit data, the ARIMA Optimization model, that is (0,2,7), produced RMSE value of 44678.49. Figure 3 shows the forecasting results of the 359 months foreign tourist visit data from January 1988 to November 2017 with blue line represents the actual data and red line represents the forecasting results.
Figure 4 Forecasting of Foreign Tourist Visit Data with ARIMA Optimization Model (0,2,7)
5.1. Results Comparison of ARIMA Optimization Model and ARIMA Box-Jenkins
Comparison of the results between ARIMA Optimization and ARIMA Box-Jenkins model was conducted to test the consistency of the result from ARIMA Optimization model (p,d,q) based on the smallest RMSE and AIC value. Thus, to evaluate whether the process of model optimization found an ARIMA model (p,d,q) that could produce more optimal forecasting than the ARIMA Box-Jenkins model.
Table 4 ARIMA Model Comparison Based on AIC Value
DATA ARIMA MODEL AIC Difference Percentage %
IHSG (2,1,1) Box-Jenkins -5532.4 3.2 0.057
As seen in Table 4, for IHSG data, the ARIMA Box-Jenkins with model (2,1,1) generated AIC -5532.4; whereas the ARIMA Optimization model (0.1,7) yielded AIC -5535.6. Since the optimization model has a smaller AIC value, the optimization model (0,1,7) is more optimal than ARIMA Box-Jenkins model with difference of 3.2 or 0.057 percent. Furthermore, for foreign tourist visit data, the ARIMA Box-Jenkins with model (0,1,2) produced AIC -671.1; whlist the ARIMA Optimization model (0,2,7) generated AIC -675.3. The smallest AIC value is resulted from the optimization model (0,2,7); hence performing better result than the ARIMA Box-Jenkins model by 0.625 percent or 4.2 difference.
Figure 5 AIC Search Movement on IHSG data
Figure 5 portrays the search movement for the smallest AIC value on IHSG data using the application of integer numbers on firefly algorithms. The result shows that the ARIMA Optimization model obtained is (0,1,7) with Generation (10), Population (100), Alpha (0.1), Gamma (1.0) and Base Beta (0.1). The process of optimizing the model was done in 3 minutes and 48 seconds. With the AIC value of -5535.6, it indicates that the optimization of the ARIMA model improved the process of finding the best model. Over the Max Generations computed, the best model is obtained on the 13th population producing the ARIMA model (0,1,7).
Figure 6 AIC Search Movement on Foreign Tourist Data
Figure 6 depicts the search movement for the smallest AIC value on foreign tourist visit data using the application of integer numbers on the firefly algorithm. The result shows that the ARIMA model obtained is (0,2,7) with Generation (10), Population (100), Alpha (0.1), Gamma (1.0) and Base Beta (0.1). The process of optimizing the model was carried out in 5 minutes and 58 seconds. With the AIC value of -675.33, it indicates that the search for ARIMA model enhanced the process in finding the best models. Over the Max Generations computed, the best model is found in the 13th population producing the ARIMA model (0,2,7).
Foreign Tourist Visit
(0,1,2) Box-Jenkins -671.1 4.2 0.625
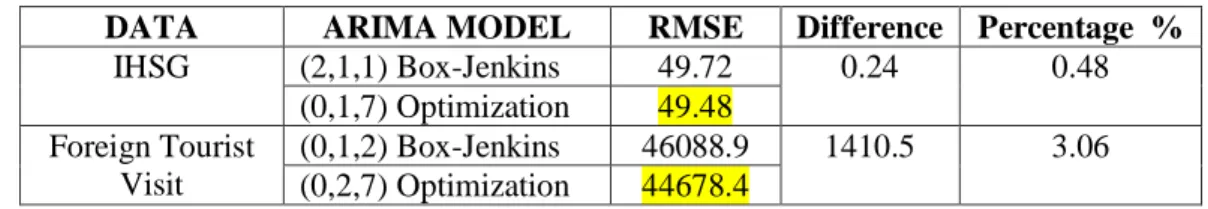
Table 5 Comparison of ARIMA Model Based on RMSE Value
The results of RMSE value between ARIMA Box-Jenkins and ARIMA Optimization model can be seen in Table 5. For IHSG data, the ARIMA Box-Jenkins model (2,1,1) generated RMSE of 49.72. On the other hand, the ARIMA Optimization model yielded RMSE value of 49.48 with model (0,1,7). The ARIMA Optimization has smaller RMSE value, hence the optimization model (0,1,7) is more optimal than ARIMA Box-Jenkins with difference of 0.24 or 0.48 percent. For foreign tourist visit data, the RMSE result of ARIMA Box-Jenkins with model (0,1,2) is 46088.9; whereas in comparison, the optimization model produced RMSE 44678.4 with model (0,2,7). The smallest RMSE value is resulted from the optimization model (0,2,7). Therefore, better than the result of ARIMA Box-Jenkins by 3.06 percent or 1410.5 smaller.
4. CONCLUSION
The research finds that the application of firefly algorithm in ARIMA Optimization model provides better result than the ARIMA Box-Jenkins model. The optimization of ARIMA Model with firefly algorithm on IHSG data produced ARIMA model (0,1,7) with AIC -5535.6 and RMSE 49.48. For data of foreign tourist visit to Indonesia, the optimization process produced ARIMA model (0,2,7) with AIC -675.3 and RMSE 44678.4. Compared to ARIMA Box Jenkins model, the results from this optimization model are improved by 0.057 percent of its AIC value and 0.48 percent of its RMSE value for IHSG data whereas for foreign tourist visit data, the AIC value is improved by 0.625 percent and 3.06 percent for RMSE value. The time needed to search for ARIMA Optimization model with firefly algorithm based on parameters tested is 3 minutes and 48 seconds for IHSG data and 5 minutes and 58 seconds for foreign tourist visit data. The experimental results show that the optimization of ARIMA model using firefly algorithm is more optimal for finding the best model and more efficient in time. The firefly algorithm adjusts to minimize the number of generations and population in the search for the smallest AIC value. Thus, making it easier for analyst expert or user in determining the ARIMA model (p,d,q) for forecasting and provides better assistance for faster decisions and policies making.
5. SUGGESTIONS
Further researches on the optimization of ARIMA model with firefly algorithm could be elaborated based on the conceptual reflections drawn form this study. The firefly algorithm tends to calculate the values of non-integer ARIMA model resulting in the the same (p,d,q) model for all generations and population. Modification is required to calculate the optimization model in the integer form to improve the search of model (p,d,q). Other algorithm such as Artificial Bee Colony could be used to generate integer numbers although its application for optimizing the ARIMA model still needs further studies
DATA ARIMA MODEL RMSE Difference Percentage %
IHSG (2,1,1) Box-Jenkins 49.72 0.24 0.48 (0,1,7) Optimization 49.48 Foreign Tourist Visit (0,1,2) Box-Jenkins 46088.9 1410.5 3.06 (0,2,7) Optimization 44678.4
REFERENCES
[1] Subanar. 2013. Statistika Matematika. Graha Ilmu. Yogyakarta.
[2] Yolanda, S. 2015. Perbandingan kinerja beberapa model peramalan runtut waktu untuk variabel kurs di indonesia dengan mengunakan model Box Jenkins Arima, Arch dan
Garch periode 3 Januari 2000 - 7 Juli 2014. Tesis, Universitas Gadjah Mada
[3] Hikichi, E., Salgado, E. G., and Beijo, L. E. 2017. “Forecasting number of ISO 14001 certifications in the Americas using ARIMA models”, Journal of Cleaner Production.
Vol. 147. Pages 242-253.
[4] Chen, K. 2011. “Combining linier and nonlinier model in forcasting Foreign Tourist Visit demand” Expert Systems with Applications. Vol. 38. Issue 8: 10368-10376.
[5] Fard, A, K. 2014. “A new hybrid Modified Firefly Algorithm and Support Vector Regression model for accurate Short Term Load Forecasting”. Expert Systems with
Applications. Vol. 41 (2014) 6047–6056.
[6] Deo, R, C. 2017. “Multi-layer perceptron hybrid model integrated with the firefly optimizer algorithm for windspeed prediction of target site using a limited set of neighboring reference station data”, Renewable Energy 116 (2018) 309-323
[7] Yang, X, S. 2018. "Nature-Inspired Algorithms and Applied Optimization" ISBN 978-3-319-67668-5
[8] Didi, R. 2014. Analisis Runtun Waktu dan Aplikasinya dengan R. Gadjah Mada University Press. Yogyakarta
.
[9] Indeks Harga Saham Gabungan, (IHSG) Januari 2013 sampai dengan Agustus 2016, yaitu selama 888 hari, https://finance.yahoo.com/quote/%5EJKSE/.
[10] Badan Pusat Statistik, kunjungan wisatawan mancanegara ke Indonesia periode Januari 1988 sampai dengan November 2017, yaitu selama 359 bulan,
https://www.bps.go.id/subject/16/pariwisata.html.
[11] S, L, Tilahun and J, M, T, Ngnotchouye, "Firefly Algorithm for Discrete Optimization Problems: A Survey" KSCE Journal of Civil Engineering. pISSN 1226-7988, eISSN 1976-3808
[12] Lingga, P. 2016. Model hybrid ARIMA-SVR untuk peramalan data runtun watku. Universitas Gadjah Mada.
[13] Sen, P., Roy, M., and Pal, P. 2016. Application of ARIMA for forecasting energy
consumption and GHG emission: A case study of an Indian pig iron manufacturing
organization. Energy. Vol. 116. Part 1. Pages 1031-1038.
[14] Nebojsa, B., Brajevic, I and Tuba M,. 2013. Firefly Algorithm Applied to Integer
Programming Problems. Faculty of Computer Science, Megatrend University Belgrade,