Chang, CH, Xu, J and Song, D-P
Risk analysis for container shipping: from a logistics perspective http://researchonline.ljmu.ac.uk/id/eprint/10867/
Article
LJMU has developed LJMU Research Online for users to access the research output of the University more effectively. Copyright © and Moral Rights for the papers on this site are retained by the individual authors and/or other copyright owners. Users may download and/or print one copy of any article(s) in LJMU Research Online to facilitate their private study or for non-commercial research. You may not engage in further distribution of the material or use it for any profit-making activities or any commercial gain.
The version presented here may differ from the published version or from the version of the record. Please see the repository URL above for details on accessing the published version and note that access may require a subscription.
For more information please contact [email protected]
http://researchonline.ljmu.ac.uk/ Citation (please note it is advisable to refer to the publisher’s version if you intend to cite from this work)
Chang, CH, Xu, J and Song, D-P (2015) Risk analysis for container shipping: from a logistics perspective. The International Journal of Logistics
Management, 26 (1). pp. 147-171. ISSN 0957-4093
LJMU Research Online
1
Risk Analysis for Container Shipping: From a Logistics Perspective
1. IntroductionOver the past decade in the container shipping business, the issue of risk has attracted considerable attention in academia. Previous studies addressed various types of risk in relation to container shipping, e.g., technical risk, market risk, business risk, and operational risk (Ewert, 2008). Technical risk refers generally to loss arising from activities such as ship or equipment design and engineering, manufacturing, technological processes, and test procedures. In the shipping industry, market risk includes revenue and investment risk (Kavussanos et al., 2003); this refers to unforeseen and detrimental changes in demand and supply (Rodrigue et al., 2011). Business risk relates to the nature of the business and it “deals with such matters as future prices, sales or the cost of inputs” (Yip and Lun, 2009, p.153). In container shipping operation, the main business risk relates to the action of increasing capacity so as to take advantage of economies of scale (Yip and Lun, 2009). Operational risk is “the possibility of an event associated with the focal firm that may affect the firm’s internal ability to produce goods and services, quality and timeliness of production, and/or the profitability of the company” (Manuj et al., 2008, p.139). Essentially, this arises from the logistics processes.
Within this complex picture of risk in container shipping, this paper attempts to address one group of these risks - the operational risk. Container shipping involves multiple entities including shippers, forwarders, hauliers, terminal operators, and shipping companies. The complex operations within and between these entities and the long distance of physical process may give rise to various types of operational risks, which could negatively impact on the performance of container shipping companies. In order to tackle this issue, it is important for shipping companies to know what these risks are and how they affect the shipping operations. Unless there is an unlimited resource, which could be employed to mitigate the risks, shipping companies will always have to prioritise their resources to mitigate those risks which are most imminent and significant. This makes it important to analyse the extent to which each risk affects a shipping company’s performance and to identify the relative importance of each risk factor.
2
With regard to the operational risk in container shipping, a number of studies need to be mentioned. Drewry (2009) identified a list of business process risks and asset risks in container transport and logistics. These included documentation, booking and invoicing errors, errors in customs regulatory compliance and in security compliance, strikes and transport congestions, theft and cargo loss or damage, piracy, and terrorist attacks. Based on the micro-data of individual vessel accidents which occurred in America from 1981 to 1989, Talley (1996) found that unlicensed operators (versus licensed operators) and smaller ship size (versus large ship size) contributed to the increase of risk and severity of cargo damage in container shipping. He also suggested that the risks and severity of damage are greater in collision and fire/explosion incidents than in groundings. Tseng et al. (2012) analysed the risks of cargo damage for aquatic products of refrigerated containers based on a questionnaire survey in various maritime communities in Taiwan, including container carriers, ocean freight forwarders, and container terminal operators. They found that “container data setting errors” is the top factor of both perceived risk and severity of risk.
Fu et al. (2010) reported that piracy has been a significant threat which forced several major container liners to alter their service routes. They focused on the Far East-Europe container liner shipping service and proposed a simulation-related economic model using history data to explain the impact of piracy. Inappropriate empty container repositioning could incur significant costs to shipping lines (Song and Dong, 2011) and it is thus considered as a risk in container shipping. Song et al. (2005) stated that empty container transportation incurred approximately USD 15 billion for the world containership fleet in 2002. Drewry (2006) reported that empty containers have accounted for at least 20 per cent of global port handling activity ever since 1998. The service schedule’s unreliability is also a risk factor in container shipping since it could lead to transportation delays and affect shipping companies’ reputations. Notteboom (2006) investigated the sources of schedule unreliability on the East Asia-Europe route and identified several sources which led to the service schedule’s unreliability, including waiting time and delays caused by port strikes, unstable weather and sea conditions, port/terminal/transport congestion, and port/terminal productivity being below expectations. Qi and Song (2012) pointed out that the lack of appropriately designed flexible liner service schedules would lead to service unreliability. Notteboom and Vernimmen (2009) used a cost model to simulate the impact of bunker cost changes on the operational costs of liner services. The results showed that oil price rise may force shipping lines to reduce speed
3
which may increase their operational costs and operational risks. Yang (2010; 2011) investigated the impact of the container security initiative (CSI) on Taiwan’s shipping industry. The CSI is a programme imposed by US after 9/11, which requires that an inbound container or cargo from foreign commercial ports be pre-inspected in order to strengthen the US nation security. They identified several CSI-related risk factors including “cargo cannot make a shipment on time and shut out by customs authority”, “cargo handling time delay”, “longer lead time of data entering”, and “various transmission systems”. It was reported that “cargo cannot be shipped on time and is shut out by the customs authority” is the top CSI-related factor in terms of risk severity.
The above studies have provided a valuable insight into the operational risks faced by container ship companies in their operations. However, each of these studies has only focused on one or several operational risk factors and no studies have inclusively examined all the possible operational risks faced by a container shipping company and evaluated the relative importance of each of them. Indeed, such a study would be useful as when the attainable resources are limited, the shipping company will have to make a decision on how to mitigate its operational risks more strategically and efficiently. Obviously, more investment should be made on mitigating those risks that are of great significance and less investment on those of less significance.
Against this background, the authors conducted a comprehensive study of the risks a container shipping company may face in providing services in shipping supply chains; this paper reports on the research process and research findings of that study. The study aimed at answering two questions; one is what are the risk factors in container shipping operations, and the other is which risk factors are relatively more significant than the others in a shipping company. By answering these two questions, it is hoped that the study will provide a clear insight into the totality of the operational risks faced by a shipping company,i and assist the shipping company managers in making better and more strategic risk mitigation decisions.
The remainder of this paper is organised as follows: Section 2 presents the research methods used in this study. Section 3 includes data collection and analysis, and the research results. In Section 4, a discussion is conducted along with an explanation of this paper’s contribution. Finally Section 5 presents the conclusions.
4 2. Research Methods
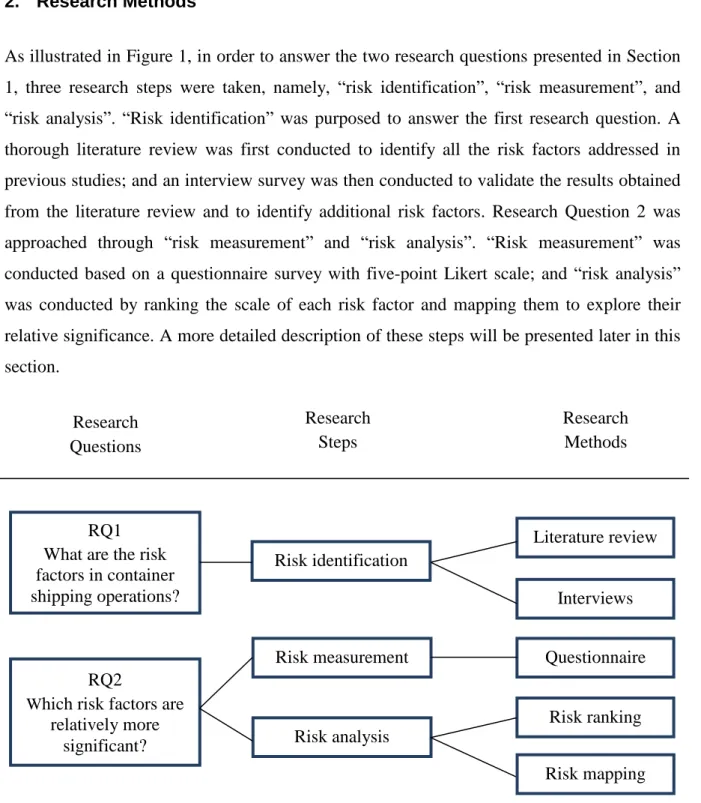
As illustrated in Figure 1, in order to answer the two research questions presented in Section 1, three research steps were taken, namely, “risk identification”, “risk measurement”, and “risk analysis”. “Risk identification” was purposed to answer the first research question. A thorough literature review was first conducted to identify all the risk factors addressed in previous studies; and an interview survey was then conducted to validate the results obtained from the literature review and to identify additional risk factors. Research Question 2 was approached through “risk measurement” and “risk analysis”. “Risk measurement” was conducted based on a questionnaire survey with five-point Likert scale; and “risk analysis” was conducted by ranking the scale of each risk factor and mapping them to explore their relative significance. A more detailed description of these steps will be presented later in this section.
Figure 1 The structure of research methodology Source: the Authors
RQ1 What are the risk factors in container shipping operations?
RQ2
Which risk factors are relatively more significant? Risk identification Risk measurement Risk analysis Literature review Questionnaire Risk ranking Interviews Risk mapping Research Questions Research Steps Research Methods
5
This study used the Taiwan container shipping industry as a case study. Because of its island geography, Taiwan relies heavily on international trade and most of the manufacturing materials are imported by ships. According to official statistics (Ministry of Transportation and Communications, 2011), around 99% of Taiwan’s international trades are transported by sea. Obviously, the shipping industry plays a very important role in Taiwan’s economy. It is thus believed that a case study of Taiwan can provide useful insight into the risk issues in a wider maritime context, and the findings obtained through the case study should be generally applicable to other countries where container shipping also plays an important role in the economies.
In order to identify and analyse the risks faced by a container shipping company in their operations in an inclusive and integrated manner, the study approached the issue from a logistics point of view, that is to view and analyse the risks from the perspective of three major flows in maritime logistics operations - information flow, physical flow, and payment flow. Information flow refers to large collection and transfer of information/knowledge between manufacturers, transportation companies, and retailers and customers (Paixão and Marlow, 2003; Spekman and Davis, 2004; Creazza et al., 2010). Physical flow refers to the transfer of goods including raw materials, finished goods, and return/recycle products from the business sector to the customer sector (Paixão and Marlow, 2003; Spekman and Davis, 2004; Creazza et al., 2010). Payment flow refers to monetary payments from the customer sector to the business sector (Lambert et al., 1998; Spekman and Davis, 2004). It is reasonable to believe that approaching from the perspective of these three flows would cover all the elements in shipping companies’ operations and thus the possible risks associated with these operation elements would be inclusively identified given that a sound research method will be used.
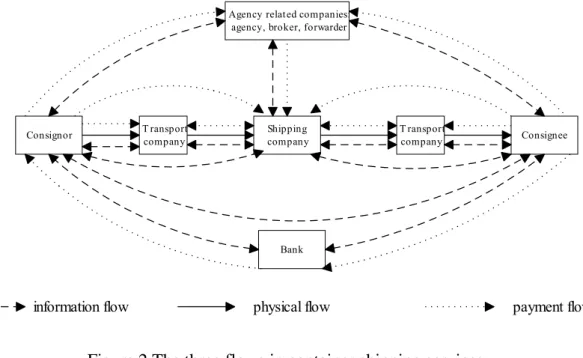
Figure 2 illustrates the logistics flows amongst the relevant entities in container shipping business whereby are included the three flows and multiple entities such as shipping company, other transport companies, agency related companies, consigner, consignee, and bank. The information flow starts from the consignee who connects with the consignor for the trade and with other entities for the cargo transportation. Other entities also connect with each other by means of information flows. The physical flow starts from the consignor through transport companies and shipping company to the consignee. In terms of payment
6
flow, the consignor and/or the consignee pay the transportation fee to agency related companies, transport companies, and the shipping company. The consignee also pays the cargo fee to the consignor through the international banks.
Figure 2 The three flows in container shipping services Source: the Authors
In order to answer the research questions, we need to firstly identify all the possible risks and then measure the risks so that a detailed risk analysis can be conducted. Risk identification is a “What” and “Why” type of question, it should therefore be better answered through a qualitative method. Risk measurement, however, is normally quantitative in nature pertaining to questions concerning “How much” or “How many”, it would therefore be appropriate to be approached through a quantitative method.
Risk Identification
For risk identification, in order to be inclusive, we firstly identified all the risk factors addressed in previous studies through an extensive literature review (Section 3.1). Review of previous studies, data and documents to identify risk is a common method used in risk analysis studies (Waters, 2007). In view of the fact that there are limited studies on operational risks in container shipping, we broadened our review to include studies on operational risks in general supply chains. The risks are categorised according to the three
Shipping
company Consignee
Consignor
Agency related companies: agency, broker, forwarder
Bank
T ransport company
information flow physical flow payment flow
T ransport company
7
flows, and they are referred to as risks associated with information flow, risks associated with physical flow, and risks associated with payment flow.
Following the above step, in order to validate whether the risks addressed in the broad range of literature are applicable to container shipping and whether there are any other risks that have not been addressed in literature but exist in practice and should therefore be included in the study, we conducted face-to-face interviews in late 2011 with a number of container shipping company managers (Section 3.2). A major advantage of using face-to-face interview is that we can obtain richer and more clarified insight into the issue of concern from the interviewees, which may not be attainable from a quantitative survey. As Water (2007) suggested, when the risks are unclear and complex, to clarify the ambiguity, interview is perhaps the most suitable way to collect new information from the people who are most familiar with conditions. Notably, this survey method has been also used in several previous studies addressing similar topics; e.g. Yang (2011) used this method in his study to validate and identify security risk factors in Taiwan’s maritime supply chain; Jüttner et al. (2003) used this method to confirm supply chain risk management strategies identified from existing literature and identify additional strategies.
The interviews were conducted with seven senior managers from two shipping companies. Although only two companies were selected, it is reasonable to believe that the findings obtained from the interviews with the managers therefrom are valid and reliable. This is because that these two companies are among the top 3 shipping companies in Taiwan and top 25 in the world in terms of company size and market share. Notably, the container shipping industry is an oligopoly industry; according to Alphaliner (2013), the top 25 shipping companies occupy almost 60% of the shipping market in the world. Views expressed by the mangers in two of these companies should, to a good extent, be able to represent the views of the industry.
In order to obtain a balanced view from different professional areas, the invited interviewees consisted of two information managers, two vice presidents and three senior operation managers. Open questions were used in the interview, and the interviewees were asked to comment on a list of identified risk elements and factors. They were also asked to add the risk factors which they had noted in practice and believed ought to be included in the list.
8
Risk Measurement
Generally, risk measurement is conducted quantitatively using two factors - risk likelihood and risk consequences (Mitchell, 1995; Waters, 2007; Cox, 2008; Beretta and Bozzolan, 2008). Risk likelihood is the probability that a risk caused by a risk-source will occur (Elky, 2006), and risk consequence is the outcome or the potential outcome of a risk event (NPSA, 2008). By multiplying the risk likelihood with the relevant risk consequence, the risk scale will be obtained (Cox, 2008; Tummala and Schoenherr, 2011).
In order to identify and measure the level of likelihood and consequence of the risks faced by shipping companies, we conducted a large scale questionnaire survey using a five-point Likert scale. This survey used the entire population of the shipping companies registered with the National Association of Shipping Agencies. At the time of conducting the project, there were a total of 116 container shipping companies in the Directory of National Association of Chinese Ship Owners and Shipping Agencies As there are three major departments (Information/Documentation, Operation, and Finance) in each company that are closely related to the identified risks, the potential effective population size was 342 assuming there was one manager in each department in each company. Section 3 presents details of the data collected through this survey.
Normally, the value of likelihood is described by a number between 0 and 1; however, many studies (e.g. NPSA, 2008) used five abstractive categories to describe the probability of an event. These were: very low (or impossible; rare), low (or unlikely), medium (or occasional; possible), high (or frequent; likely), and very high (or almost certain). This paper uses numbers 1, 2, 3, 4, and 5 to represent “rare”, “unlikely”, “possible”, “likely”, and “almost certain” respectively (e.g. Yang, 2010).
Risk consequences are normally measured in financial or monetary terms, e.g., clearly, a lost load of goods clearly a monetary value. However, in some cases it is not that straightforward, e.g., owing to the intangible characteristics of the consequence, it is difficult to measure a delayed delivery in monetary terms. In risk analysis, reputation loss (Bebbington et al., 2008) is considered normally as a non-financial loss. In container shipping operations, some types
9
of safety (Kasperson et al., 1988; IMO, 2009) and security damage (Tzannatos, 2003; IMO, 2009) (e.g. pain and suffering of the crew and their family) are of the characteristics of non-financial loss. This paper considers three types of risk consequences. These are, namely, financial loss, reputation loss, and safety and security incident related loss. It is worth pointing out that these risk consequences are not totally exclusive and independent of each other; there are overlaps. An incident such as cargo loss may cause financial loss; at the same time, it may also cause reputation loss. It is the same with safety and security incident related loss - a piracy attach is very much likely to cause financial loss. However, there are still differences; for example, safety and security incident related loss normally may cause pain and suffering of the crew of the ship involved in the incident and their families; this cannot be measured by financial terms and thus categorised as financial loss. To establish a more clarified and comprehensive overview of the significance of each risk, it is necessary to separate the three types of consequence and use them as three perspectives of the analysis.
The level of risk consequence is described in different ways. Some scholars use “negligible, minor, moderate, serious, and critical” (e.g., Garvey and Lansdowne, 1998; NPSA, 2008), some used “no safety effect, minor, major, hazardous, and catastrophic” (e.g., Cox, 2008), and some use “low, moderate, and high” (e.g. Elky, 2006). In this study, “insignificant, minor, moderate, major, and catastrophic” represented by 1 to 5 respectively are used to describe the level of risk consequence.
Risk Analysis
Based on the data collected through the above steps, we calculated the risk scale of each risk factor and then used a risk map to compare their relative importance. Before entering into a detailed discussion on how to calculate risk scales, we introduce the notations below -
M : the total number of risk factors N : the total number of respondents
lri: the likelihood of risk factor r by the respondent, i, 1≤r≤M and 1≤i≤N. cri : the consequence of risk factor r by the respondent, i, 1≤r≤M and 1≤i≤N.
10
Note that the risk scale is the product of the likelihood and the consequence of a risk factor. Two methods could be used to calculate the risk scale over multiple respondents. The first method is to multiply the average likelihood over all respondents with the average consequence over all respondents for each risk factor. We refer this method as Risk Scale Average Likelihood and Consequence (RSALC) in this paper. The formula is as follows -
𝑅𝑆𝐴𝐿𝐶𝑟 = 𝑙̅𝑟 * 𝑐̅𝑟 Where 𝑙̅ =𝑟 1 𝑁 ∑ 𝑙𝑟𝑖 𝑁 𝑖=1 and 𝑐̅ = 𝑟 1 𝑁∑ 𝑐𝑟𝑖 𝑁 𝑖=1
The second method is to first obtain the risk scale for each individual respondent on each risk factor, and then calculate the average of those risk scales over all respondents. We call this method Average Risk Scale (ARS) in this paper. The formula is as follows -
𝐴𝑅𝑆𝑟 = 1
𝑁∑ (𝑙𝑟𝑖∗ 𝑐𝑟𝑖) 𝑁
𝑖=1
The first method provides three pieces of results for each risk factor, i.e. average likelihood, average consequence, and risk scale. It is easy to apply and the results can be shown directly in the risk map in which all these results are required. However, a drawback of using this method is that the final result of RSALC includes those components obtained by multiplying one respondent’s likelihood with another respondent’s consequence. This may distort the statistic results.
We believe that the second method - ARS - is more reasonable in calculating risk scales since they are obtained firstly by multiplying the risk likelihood with the risk consequence from each respondent respectively, and then averaging over all respondents. We therefore use this method to evaluate the risk scale for each risk factor.
Notably, ARS provides only the result of risk scale over all respondents and it does not provide the corresponding risk likelihood and risk consequence. In order to solve this problem, this paper employs a method based on the concept of the shortest distance. It
11
considers a two-dimension state space in which the x-axis represents the risk likelihood and the y-axis represents the risk consequence. Each respondent can be represented by a point in the state space. The distance between any two points (x1, y1) and (x2, y2) is given by 𝐷 = √(𝑥2− 𝑥1)2+ (𝑦
2− 𝑦1)2. Our purpose is to find the best pair of likelihood and consequence, the product of which is equal to ARS, whilst the corresponding point has the shortest total distance to all respondents.
Let 𝑙̂𝑟 be the candidate risk likelihood, and 𝑐̂𝑟 be the candidate risk consequence. For a given risk factor r, the total distance between (𝑙̂𝑟,𝑐̂𝑟) and (𝑙𝑟𝑖, 𝑐𝑟𝑖) for 1≤i≤N can be formulated as -
𝐷𝑟 = ∑ √(𝑙̂𝑟− 𝑙𝑟𝑖)2+ (𝑐̂
𝑟− 𝑐𝑟𝑖)2 𝑁
𝑖=1
1 ≤ 𝑟 ≤ 𝑀
The objective is to seek the optimal (𝑙̂𝑟,𝑐̂𝑟) for 1≤r≤M by solving the following constrained optimisation problem, 𝑚𝑖𝑛 𝐷 = ∑ 𝐷𝑟 𝑀 𝑟=1 = ∑ ∑ √(𝑙̂𝑟− 𝑙𝑟𝑖)2+ (𝑐̂ 𝑟− 𝑐𝑟𝑖)2 𝑁 𝑖=1 𝑀 𝑟=1 Subject to 𝑙̂𝑟∗ 𝑐̂𝑟= 𝐴𝑅𝑆𝑟, 1 ≤ 𝑟 ≤ 𝑀
The above optimisation problem can be solved easily by using existing software tools, e.g. Excel solver. After obtaining the best (𝑙̂𝑟,𝑐̂𝑟) for 1≤r≤M, we are able to perform further risk analysis using the risk maps in the next section.
3. Data Collection, Analysis and Discussion
3.1 Risk Identification
As described in Section 2, risk identification is conducted through two steps; the first one is identification of risks through review of existing literature, and the second is validation of data through interviews.
3.1.1 Risk Identification through a Review of Previous Literature
12
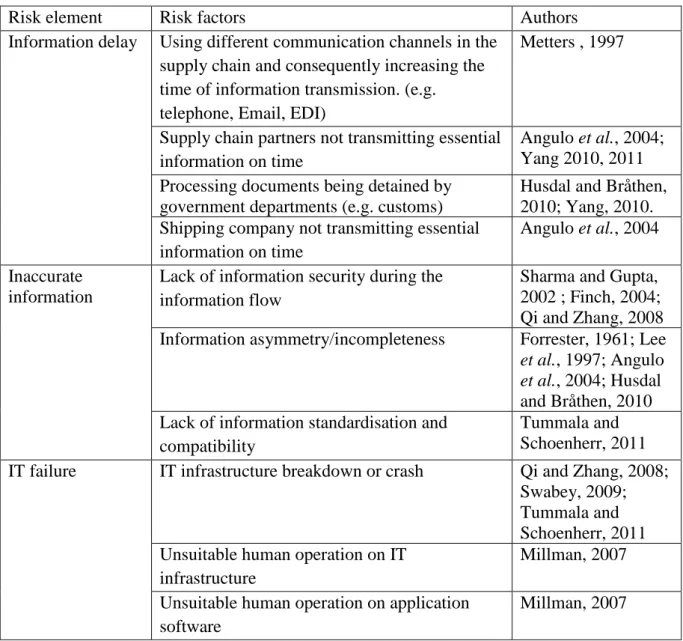
The risk factors associated with information flow, which have been addressed in previous studies, may be grouped into three categorisations: information delay, information inaccuracy, and IT problem.
According to Ramayah and Omar (2010), information delay and inaccurate information means poor information quality. They also pointed out that lack of advanced information technology (IT) may be a cause of poor information quality. Angulo et al. (2004, p.102) stated that information delay was an important risk element in information flow; they defined it as “the wait time that shared information experiences before it is used by an internal supply chain functions”. Metters (1997, p. 99) explained that “lack of inter-company communication combined with large time-lags between receipt and transmission of information are the root cause of information delay”.
With regard to information inaccuracy, DeLone and McLean (1992) pointed out that it might lead to wrong decision making. Sharma and Gupta (2002), Finch (2004), and Qi and Zhang (2008) suggested that lack of information security might affect information accuracy since it could lead to the transferring data being tampered with or leaked. Angulo et al. (2004) stated that using inaccurate information might lead to costly investment and work inefficiencies and it might be caused by customer’s poor inventory integrity. Forrester (1961) and Lee et al. (1997) found that information asymmetry or lack of communication could lead to inaccurate or distorted information flow in a supply chain. Husdal and Bråthen (2010) identified several risks relating to information flow in the context of Norwegian freight transport; these risks are: disregard of rules and regulations, wrong or erroneous lading permits, wrong or erroneous documents (e.g. customs declaration), and wrong or erroneous information from or to other players in the supply chain.
A number of studies addressed the importance of IT. Tummala and Schoenherr (2011) suggested that lack of necessary IT or IT failure ought to be considered as an important risk element associated with information flow since they might disrupt the process of information transmission. They stated that the triggers that might cause system risks include information infrastructure breakdowns, lack of effective system integration or extensive system networking, and lack of compatibility in IT platforms amongst supply chain partners. Swabey
13
(2009) and Qi and Zhang (2008) stated that IT infrastructure breakdown is a risk factor. Millman (2007) pointed out that human error is the biggest risk to an organisation’s network security.
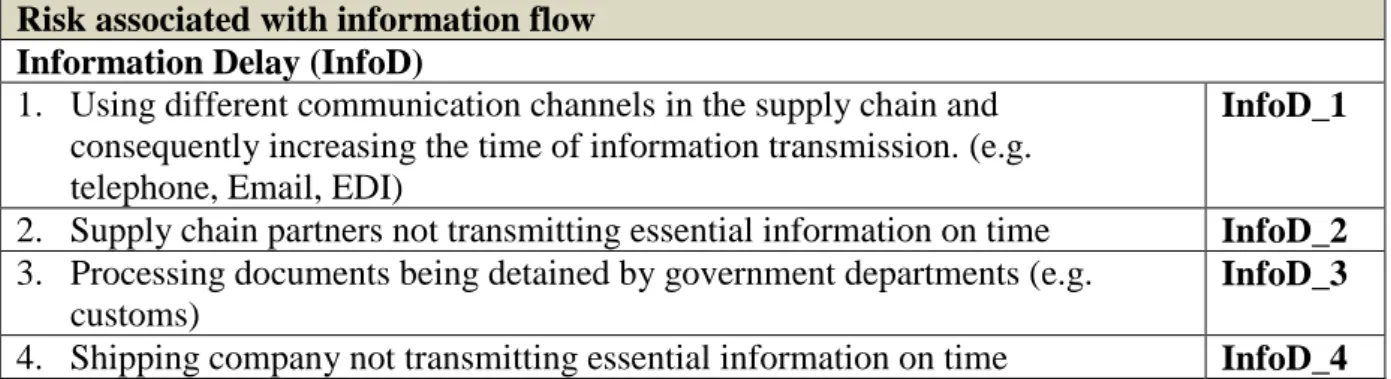
Table 1 summarises all the risk factors identified through the above step and their categorisations.
Table 1. The risk elements and factors associated with information flow
Risk element Risk factors Authors
Information delay Using different communication channels in the supply chain and consequently increasing the time of information transmission. (e.g. telephone, Email, EDI)
Metters , 1997
Supply chain partners not transmitting essential information on time
Angulo et al., 2004; Yang 2010, 2011 Processing documents being detained by
government departments (e.g. customs)
Husdal and Bråthen, 2010; Yang, 2010. Shipping company not transmitting essential
information on time
Angulo et al., 2004 Inaccurate
information
Lack of information security during the information flow
Sharma and Gupta, 2002 ; Finch, 2004; Qi and Zhang, 2008 Information asymmetry/incompleteness Forrester, 1961; Lee et al., 1997; Angulo et al., 2004; Husdal and Bråthen, 2010 Lack of information standardisation and
compatibility
Tummala and Schoenherr, 2011 IT failure IT infrastructure breakdown or crash Qi and Zhang, 2008;
Swabey, 2009; Tummala and Schoenherr, 2011 Unsuitable human operation on IT
infrastructure
Millman, 2007 Unsuitable human operation on application
software
Millman, 2007
14
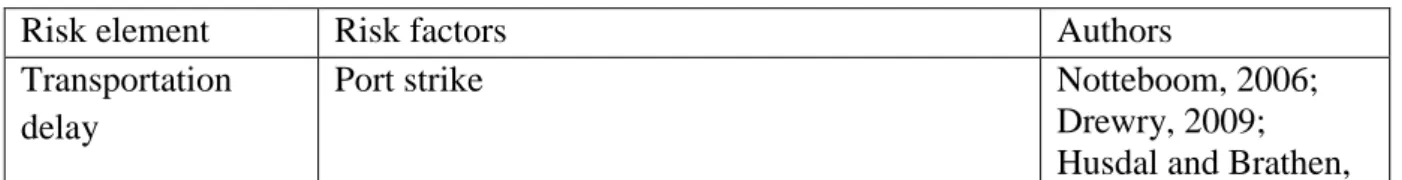
There are a significant number of studies that focus on risks associated with physical flow in container shipping or general supply chains. These identified a number of risk factors which might be categorised into two groups: transportation delay, and cargo/asset loss or damage. Almost all the studies mentioned in this paper’s Introduction fall into this area. In addition, the following papers need to be mentioned.
Based on a large-scale survey, Vernimmen et al. (2007) reported that over 40% of the vessels deployed on worldwide liner services arrive one or more than one day behind schedule. They found several risk factors that might cause transportation delay including bad weather at sea, congestion or labour strikes at the different ports of call, and knock-on effects of delays suffered at previous ports. Notteboom (2006) stated that transportation delay might incur extra logistics costs to the shippers and damage the liners’ reputations. Husdal and Bråthen (2010) identified several risk factors; those are relevant to this context include unstable weather and road conditions, lack of fuel supply, and strike and other work-related issues. Tummala and Schoenherr (2011) classified several risk factors into transportation delay, including port capacity and congestion, port strikes, and delay at ports due to port capacity.
In relation to cargo/company asset loss or damage, Husdal and Bråthen (2010) suggested that supply chains might be affected by accidents, engine/vehicle breakdowns, theft, and errors in loading (e.g., mixing hazardous and non-hazardous goods might cause explosion accidents). Compared to other general supply chains, Dangerous Goods (DG) transportation is a special risk factor in transportation industry supply chains, because a DG explosion may cause huge damage to the cargo, the ship, and the nearby port. Tummala and Schoenherr (2011) stated that terrorism and wars might lead to disruption risk.
Table 2 summarises the risk factors addressed in the studies mentioned above or in the Introduction of this paper.
Table 2. The risk elements and factors associated with physical flow
Risk element Risk factors Authors
Transportation delay
Port strike Notteboom, 2006;
Drewry, 2009; Husdal and Brathen,
15
2010; Tummala and Schoenherr, 2011 Port congestion (unexpected waiting times
before berthing or before starting loading/discharging)
Notteboom, 2006; Drewry, 2009; Tummala and Schoenherr, 2011 Port/terminal productivity being below
expectations (loading/discharging)
Notteboom, 2006; Tummala and Schoenherr, 2011
Unstable weather Notteboom, 2006;
Husdal and Bråthen, 2010
Inappropriate empty container transportation Song et al., 2005; Drewry, 2006; Song and Dong, 2011 Lack of flexibility of fleet size and designed
schedules
Song et al., 2005; Qi and Song, 2012
oil price rise Notteboom and
Vernimmen, 2009; Husdal and Bråthen, 2010
Cargo/asset loss or damage
Damage to containers or cargo due to terminal operators’ improper loading/unloading
operations
Husdal and Bråthen, 2010
Cargo being stolen from unsealed containers Drewry, 2009; Husdal and Bråthen, 2010
Damage caused by transporting dangerous goods
Talley, 1996; Husdal and Bråthen, 2010 Damage to ship or quay due to improper berth
operations
Talley, 1996; Husdal and Bråthen, 2010 Attack from pirates or terrorists Drewry, 2009; Fu et
al., 2010; Tummala and Schoenherr, 2011
Risks Associated with Payment Flow
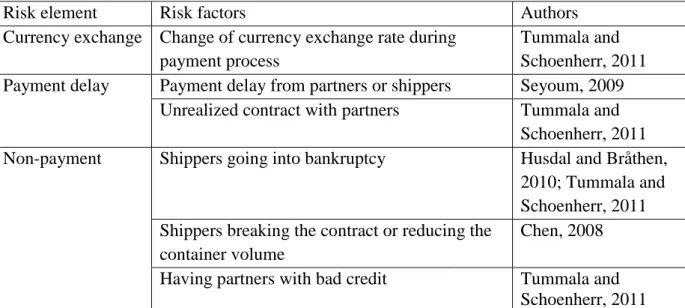
Previous studies identified a number of risk factors associated with payment flow and they might be categorised into three groups: currency exchange, payment delay, and non-payment.
Tummala and Schoenherr (2011) pointed out that an international business might lose profit if the fees were paid in a weak currency. They also suggested that unrealised contract with
16
partners might lead to payment delay, and shippers going into bankruptcy or having partners with bad credit might lead to non-payment. Husdal and Bråthen (2010) stated that bankruptcy or other financial difficulties faced by one player in a supply chain might cause risks to the other players in the supply chain. Seyoum (2009) pointed out that if a consignee delayed or did not make the payment, it would have a direct impact on the consignor’s financial performance. Seyoum (2009, p.240) also stated that payment delay might not have any impact on the buyers; however, it “often creates liquidity problems for many exporting firms”. Chen (2008) stated that a break of trade caused by one company usually causes big losses to the others in the supply chain. Notably, there are several payment methods in international trade, e.g., Open Account, Letter of Credit (L/C), and Cash-in-Advance (U.S. Department of Commerce, 2008). Each payment method imposes different levels of risks to different parties. For example, an open account imposes the highest risk on the sellers. In container shipping business, several international contracts of sale are used, e.g. Free On Board (FOB), and Cost, Insurance and Freight (CIF). Under FOB, the shipping companies may not receive payment if the buyers go bankrupt.
Table 3 summarises the above mentioned risk factors.
Table 3. The risk element and factors associated with payment flow
Risk element Risk factors Authors
Currency exchange Change of currency exchange rate during payment process
Tummala and Schoenherr, 2011 Payment delay Payment delay from partners or shippers Seyoum, 2009
Unrealized contract with partners Tummala and Schoenherr, 2011 Non-payment Shippers going into bankruptcy Husdal and Bråthen,
2010; Tummala and Schoenherr, 2011 Shippers breaking the contract or reducing the
container volume
Chen, 2008 Having partners with bad credit Tummala and
Schoenherr, 2011 3.1.2 Validation of Identified Risk Factors
17
As mentioned earlier, the risks identified based on the literature review were validated by qualitative interviews with a number of container shipping managers. During the interviews, the interviewees were also invited to suggest additional risks that had not been identified. Detailed results of the interviews are presented below.
All the risk factors identified in the literature review were confirmed by the interviewees. In addition, a number of other risk factors were suggested.
Using different communication channels was suggested as a risk factor associated with information flow. Using different communication channels produced un-standardised data, which might lead to inaccurate data input or engaging extra human resources and extra time in organising the data. An information manager mentioned –
EDI is the most popular IT used in shipping companies ... However, there are still some supply chain partners cannot afford the investment of EDI, and they transmit the required information through other information channels such as email or telephone. The information transmitted through these different information channels is neither organised nor standardised. The disintegrated transmission of information may cause information delay and inaccuracy.
Another risk factor suggested by the interviewees was “shippers requesting extra service information”. Container shipping companies usually pay more attention to large shippers. However, the large shippers’ influential negotiation power sometimes creates risks associated with information flow to container shipping companies. For example, a large shipper may use its negotiation power in making unreasonable requests to the shipping company. As a manager explained -
… Large shippers often request extra service, such as organising holistic logistic information which includes inland transportation shifts and customs clearance date.… Large shippers may request even forecasts of inland transportation timetable for several months in the future.
Shippers hide cargos information was also considered as a risk factor. In order to reduce the transportation fee or insurance payment, some shippers use wrong cargo information including declaring cheaper cargo category and declaring lighter cargo weight. A shipping manager mentioned –
18
We have paid some penalties and once our ship was detained because the documents, for customs clearance, were inconsistent with the shipper and the process was delayed. The reason was that our customer [the shipper] did not inform us that the contents of the cargos had been changed, or even that the shipper had hid the cargo information. During the interviews, it emerged also that asset and cargo damage was a serious risk faced by shipping companies. As a manager explained –
The majority of the cargos in freezer container transportation are fruit, high technology products, and chemical materials. These types of cargos need to be kept at a certain and stable temperature.… Sometimes the electricity failure, in ports or on ships, damages the high value cargos, and leads to fruit becoming decayed or high technology products overheated. … The risk of DG transportation could damage not only cargos but also ships; this is more serious than cargo damage or transportation delay. Sometimes, because of the DG explosion, we lose the whole ship; cargos; and reparations.
In addition, “Shippers abandoning cargos when cargos have already reached the port of destination” was also defined as a risk factor by the interviewees. A senior manager stated –
... Shippers may abandon cargos if the cargo’s value reduces during the transportation, we therefore cannot receive the transportation fee if the contract is under FOB.
Based on the literature review and the interview results, this paper identified a total of thirty-five risk factors under the various sub-categories of risk associated with information flow, risk associated with physical flow, and risk associated with payment flow. These are summarised in Table 4. The additional risk factors suggested by the interviewees are InfoI_4, InfoI_5, PhTD_6, PhCD_5, PayCE_2, and PayNP_2. They are highlighted in Italic Font. In order to facilitate the narrative, we use short names to code the risk elements (sub-categories).
Table 4 Classification of risks in container shipping operations Risk associated with information flow
Information Delay (InfoD)
1. Using different communication channels in the supply chain and consequently increasing the time of information transmission. (e.g. telephone, Email, EDI)
InfoD_1
2. Supply chain partners not transmitting essential information on time InfoD_2 3. Processing documents being detained by government departments (e.g.
customs)
InfoD_3 4. Shipping company not transmitting essential information on time InfoD_4
19
Information Inaccuracy (InfoI)
1. Lack of information security during the information flow InfoI_1
2. Information asymmetry/incompleteness InfoI_2
3. Lack of information standardisation and compatibility InfoI_3
4. Shippers requesting extra service information InfoI_4
5. Shippers hiding cargo information (non-declare) InfoI_5
IT Problem (InfoIT)
1. IT infrastructure breakdown or crash InfoIT_1
2. Unsuitable human operation on IT infrastructure InfoIT_2
3. Unsuitable human operation on application software InfoIT_3 Risk associated with physical flow
Transportation Delay (PhTD)
1. Port strikes PhTD_1
2. Port congestions (unexpected waiting times before berthing or before starting loading/discharging)
PhTD_2 3. Port/terminal productivity being below expectations (loading/discharging) PhTD_3
4. Unstable weather PhTD_4
5. Inappropriate empty container transportation PhTD_5
6. Container shortage (e.g. Shippers use containers as storage, container revamp, unexpected demand)
PhTD_6
7. Lack of flexibility of fleet size and designed schedules PhTD_7
8. Cargos being detained by customs PhTD_8
9. Oil price rise PhTD_9
Asset/cargo loss or damage(PhCD)
1. Damage to containers or cargo due to terminal operators’ improper loading/unloading operations
PhCD_1
2. Cargo being stolen from unsealed containers PhCD_2
3. Damage caused by transporting dangerous goods PhCD_3
4. Damage to ship or quay due to improper berth operations PhCD_4 5. Damage to frozen cargo/ reefer containers due to electricity failure PhCD_5
6. Attack from pirates or terrorists PhCD_6
Risk associated with payment flow Currency Exchange (PayCE)
1. Change of currency exchange rate during payment process PayCE_1
2. Financial crisis in the loan countries PayCE_2
Payment Delay (PayPD)
1. Payment delay from partners or shippers PayPD_1
2. Unrealized contract with partners PayPD_2
Non-Payment (PayNP)
1. Shippers going into bankruptcy PayNP_1
2. Shippers abandoning cargos when cargos have already reached the port of destination
PayNP_2
3. Shippers breaking the contract or reducing the container volume PayNP_3
4. Having partners with bad credit PayNP_4
20
Some 88 replies were returned including 62 valid replies and 26 invalid replies. The valid response rate is 18.13%. The following sections present the results of risk scale and risk mapping respectively.
3.2.1 Results of Risk Scale
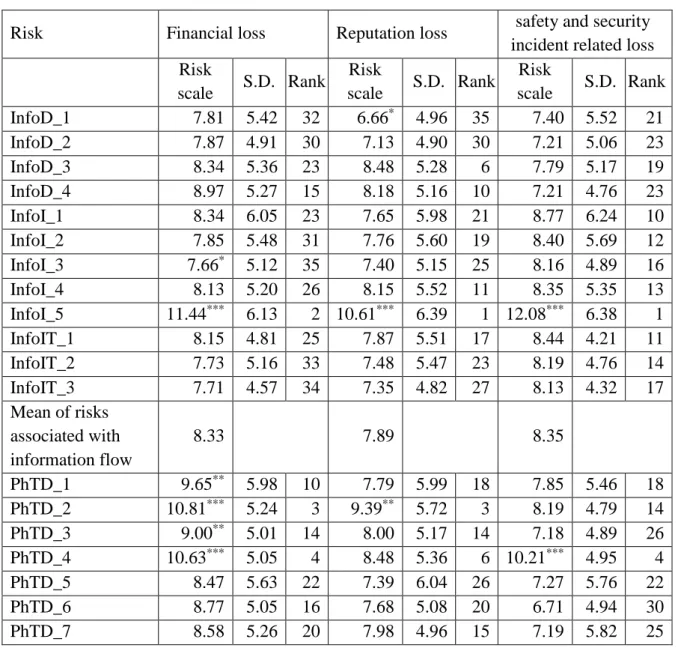
The risk scales of the three types of risk consequences were calculated; Table 5 details their mean values, standard deviations, and the rankings amongst all risk factors.
Table 5 Risk scale of all risk factors
Risk Financial loss Reputation loss safety and security incident related loss Risk scale S.D. Rank Risk scale S.D. Rank Risk scale S.D. Rank InfoD_1 7.81 5.42 32 6.66* 4.96 35 7.40 5.52 21 InfoD_2 7.87 4.91 30 7.13 4.90 30 7.21 5.06 23 InfoD_3 8.34 5.36 23 8.48 5.28 6 7.79 5.17 19 InfoD_4 8.97 5.27 15 8.18 5.16 10 7.21 4.76 23 InfoI_1 8.34 6.05 23 7.65 5.98 21 8.77 6.24 10 InfoI_2 7.85 5.48 31 7.76 5.60 19 8.40 5.69 12 InfoI_3 7.66* 5.12 35 7.40 5.15 25 8.16 4.89 16 InfoI_4 8.13 5.20 26 8.15 5.52 11 8.35 5.35 13 InfoI_5 11.44*** 6.13 2 10.61*** 6.39 1 12.08*** 6.38 1 InfoIT_1 8.15 4.81 25 7.87 5.51 17 8.44 4.21 11 InfoIT_2 7.73 5.16 33 7.48 5.47 23 8.19 4.76 14 InfoIT_3 7.71 4.57 34 7.35 4.82 27 8.13 4.32 17 Mean of risks associated with information flow 8.33 7.89 8.35 PhTD_1 9.65** 5.98 10 7.79 5.99 18 7.85 5.46 18 PhTD_2 10.81*** 5.24 3 9.39** 5.72 3 8.19 4.79 14 PhTD_3 9.00** 5.01 14 8.00 5.17 14 7.18 4.89 26 PhTD_4 10.63*** 5.05 4 8.48 5.36 6 10.21*** 4.95 4 PhTD_5 8.47 5.63 22 7.39 6.04 26 7.27 5.76 22 PhTD_6 8.77 5.05 16 7.68 5.08 20 6.71 4.94 30 PhTD_7 8.58 5.26 20 7.98 4.96 15 7.19 5.82 25
21 PhTD_8 7.89 4.75 29 7.18 5.27 29 6.65 4.79 33 PhTD_9 14.00*** 6.31 1 8.73 5.77 5 9.03** 6.16 9 PhCD_1 10.21*** 5.93 6 9.29** 6.31 4 9.77** 5.31 7 PhCD_2 9.65** 5.85 10 8.48 4.92 6 9.55** 5.31 8 PhCD_3 10.26*** 4.86 5 9.52** 5.69 2 11.42*** 5.87 2 PhCD_4 9.37** 5.18 12 8.11 5.45 12 9.97** 5.35 6 PhCD_5 9.85** 5.34 8 8.29 5.08 9 10.06*** 5.48 5 PhCD_6 9.84** 5.84 9 8.03 6.22 13 11.03*** 6.01 3 Mean of risks associated with physical flow 9.80 8.29 8.81 PayCE_1 10.18*** 6.44 7 7.95 6.38 16 7.69 6.42 20 PayCE_2 8.10 5.98 27 7.10 6.57 31 6.89 6.58 28 PayPD_1 9.21** 5.65 13 7.44 5.40 24 6.82 4.76 29 PayPD_2 8.68 5.81 17 7.55 5.90 22 6.69 5.12 31 PayNP_1 8.66 6.01 18 6.95 5.99 33 7.13 6.22 27 PayNP_2 8.63 5.53 19 6.92 5.45 34 6.66 5.23 32 PayNP_3 8.48 5.73 21 7.31 5.97 28 6.58* 5.33 34 PayNP_4 7.94 5.12 28 7.03 5.34 32 6.58* 5.22 34 Mean of risks associated with payment flow 8.73 7.28 6.88 Total average 9.05 7.92 8.21
*means the risk scale is the smallest one in each consequence **means the risk scale is between 9 and 9.99
***means the risk scale is greater than 10
In respect of financial loss, the top three high-level risk factors are “oil price rise” (PhTD_9: 14.00), “shippers hiding cargo information (non-declare)” (InfoI_5: 11.44), and “port congestion” (PhTD_2: 10.81). Moreover, although their respective risk scales are lower than the top three, there are several risk factors which are also quite high (greater than 10). These are “unstable weather” (PhTD_4: 10.63), “damage caused by transporting dangerous goods” (PhCD_3: 10.26), “damage to containers or cargos due to terminal operators’ improper loading/unloading operations” (PhCD_1: 10.21), and “change of currency exchange rate during payment process” (PayCE_1: 10.18). The factor, “lack of information standardisation and compatibility” (InfoI_3: 7.66), has the least impact on shipping companies’ financial losses. In terms of financial losses, risk associated with physical flow is the most significant
22
one (the mean is 9.80) amongst the three categories of risks and risk associated with information flow is the least significant one (the mean value is 8.33).
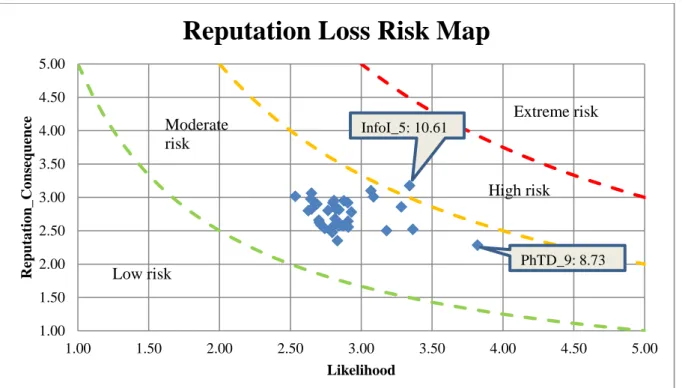
In terms of reputation loss, the top three risk factors are “shippers hiding cargo information (non-declare)” (InfoI_5: 10.61), “damage caused by transporting dangerous goods” (PhCD_3: 9.52), and “port congestion” (PhTD_2: 9.39). The least significant one is “using different communication channels in the supply chain and consequently increasing the time of information transmission (e.g. telephone, Email, EDI)” (InfoD_1: 6.66). Again, the most significant one is risk associated with physical flow; however, the impact is not as high as that of financial loss (the mean here is 8.29). Risk associated with payment flow with the mean being 7.28 has the least impact on shipping companies’ reputation loss.
In terms of safety and security incident related loss, the top three risk factors are “shippers hiding cargo information” (InfoI_5: 12.08), “damage caused by transporting dangerous goods” (PhCD_3: 11.42), and “attack from pirates or terrorists” (PhCD_6: 11.03). There are two other risk factors of which the risk scale is greater than 10. They are “unstable weather” (PhTD_4: 10.21) and “damage to frozen cargos/ reefer containers due to electricity failure” (PhCD_5: 10.06). The risk factor, “financial crisis in the loan countries” (PayCE_2: 5.79), has the least impact on safety and security incident related loss. Among the three categories of risks, risk associated with physical flow remains in first place (the mean was 8.81) and risk associated with payment flow is the least one (the mean was 6.88).
Notably, amongst all the risk factors, “shippers hiding cargo information (non-declare)” (InfoI_5) ranks as the first in respect of two types of consequence - reputation and safety and security incident related loss; and the second in respect of financial loss. This suggests that this factor is in effect the most serious risk factor in container shipping operations. It may be worth mentioning that in relation to InfoI_5, a shipping manager during the interview survey stated -
We have paid some penalties and once our ship was detained because the documents, for customs clearance, were inconsistent with the shipper and the process was delayed. The reason was that our customer [the shipper] did not inform us that the contents of the cargos had been changed.
23
“Oil price rise” (PhTD_9) is another important risk factor especially in respect of financial loss. According to Ronen (2011), fuel price rise could substantially increase the operational cost of a large ship as more than 75% of the operating cost is used for bunker fuel. “Damage caused by transporting dangerous goods” (PhCD_3) and “unstable weather” (PhTD_4) are also notable factors since they have a significant impact on employees’ safety.
PayCE_1 is the only risk associated with the payment flow factor of which the scale is greater than 10 in respect of financial loss consequence. An unstable currency exchange rate may be the main reason for this risk. During the interview survey, a shipping manager explained:
The transportation fees we get are usually calculated by USD. However, some shippers will still pay the bills by local currency, such as euro or JPY. We need to afford the risk from the unstable currency exchange rate,… sometimes, it will make us lose the profit.
Averaging over all risk factors in terms of their impact on financial loss, reputation loss and safety and security incident related loss, the result as shown in Table 5 reveals that financial loss is the most affected (the average is 9.05) and reputation loss is the least affected (the average is 7.92) with safety and security incident related loss (the average is 8.21) being in the middle.
3.2.2 Results of Risk Mapping
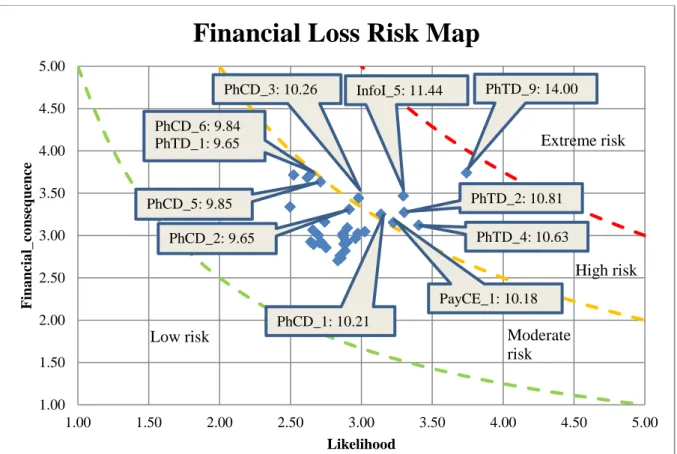
Risk mapping is a common method to analyse the relative importance of different risk factors (Waters, 2007). In a risk map, the horizontal axis represents the risk likelihood and the vertical axis represents the risk consequence. Each risk factor can be located in the risk map. As explained in Section 3 of this paper, we use RAS to derive a risk factor’s likelihood and consequence over all respondents. Based on the risk scales, we divided the risk map into four regions: low risk region (corresponding to risk scale <5), moderate risk region (5< risk scale <10); high risk region (10< risk scale <15), and extremely high risk region (15< risk scale).
24
Figure 3 Financial loss risk map
As shown in the financial loss risk map (Figure 3), the majority of the risk factors (28 out of 35) fall within the moderate risk region and none of the risk factors fall within the low risk region or the extremely high risk region. A total of seven risk factors fall within the high risk region including PhTD_9, InfoI_5, PhTD_2, PhTD_4, PhCD_3, PhCD_1, and PayCE_1. Notably, PhCD_5 and PhCD_6, although they are in the moderate risk region, are very close to the boundary of the high risk region. Most of these factors belong to the category of risk associated with physical flow; this coincides with the earlier presented finding that, in respect of financial loss, risk associated with physical flow is more significant than the other two categories of risk. It is also worth mentioning that the risk factor PhTD_9 (oil price rise) has the highest risk scale and is quite close to the extreme risk region.
1.00 1.50 2.00 2.50 3.00 3.50 4.00 4.50 5.00 1.00 1.50 2.00 2.50 3.00 3.50 4.00 4.50 5.00 F ina ncia l_ co ns equence Likelihood
Financial Loss Risk Map
Extreme risk
PhTD_9: 14.00 InfoI_5: 11.44
PhTD_2: 10.81 PhTD_4: 10.63
Low risk Moderate
risk High risk PhCD_3: 10.26 PhCD_1: 10.21 PayCE_1: 10.18 PhCD_5: 9.85 PhCD_6: 9.84 PhTD_1: 9.65 PhCD_2: 9.65
25
Figure 4 Reputation loss risk map
As shown in the reputation loss risk map (Figure 4), except the risk factor InfoI_5 that falls within the high risk region, all other risk factors are in the moderate risk region.
Figure 5 Safety and security incident related loss risk map 1.00 1.50 2.00 2.50 3.00 3.50 4.00 4.50 5.00 1.00 1.50 2.00 2.50 3.00 3.50 4.00 4.50 5.00 Reput a tio n_ Co ns equence Likelihood
Reputation Loss Risk Map
InfoI_5: 10.61 PhTD_9: 8.73 Low risk Moderate risk High risk Extreme risk 1.00 1.50 2.00 2.50 3.00 3.50 4.00 4.50 5.00 1.00 1.50 2.00 2.50 3.00 3.50 4.00 4.50 5.00 Sa fet y a nd Securit y _ Co ns equence likelihood
Safety and Security Incident Related Loss
Risk Map
InfoI_5: 12.08 PhCD_3: 11.42 PhCD_6: 11.03 PhTD_4: 10.21 PhCD_5: 10.06 PhCD_4: 9.97 PhTD_9: 9.03 PhCD_1: 9.77 Low risk Moderate risk High risk Extreme risk26
In the safety and security incident related loss risk map (Figure 5), five risk factors fall within the high risk region. These include InfoI_5, PhCD_3, PhCD_6, PhCD_5, and PhTD_4. Two risk factors within the moderate risk region (PhCD_4 and PhCD_1) are close to the high risk region. With the exception of InfoI_5, all the other top seven risk factors in respect of safety and security incident related loss belong to risks associated with physical flow. This suggests that, in container shipping operations, the risks associated with physical flow have the most serious impact on safety and security incident related loss. In terms of InfoI_5, shipping managers can perhaps try to reduce the likelihood via strategies such as checking the processing document more carefully. In terms of the risk factors with high consequence and low likelihood, PhCD_6 and PhCD_4, insurance is of course an option for reducing the risk. It has also been suggested (IFW, 2011) that shipping companies may charge more fees for protecting the cargos travelling through high risk routes.
4. Further Discussion
This paper has used empirical data to analyse the risks faced by container shipping companies from a logistics perspective in relation to three different types of risk consequence: financial loss, reputation loss and safety and security incident related loss. From a logistics perspective, it was aimed at providing an inclusive view on the risks in container shipping operations. The research questions have been answered: a total of 35 risk factors have been identified and classified into three categories, namely, risks associated with information flow, risks associated with physical flow, and risks associated with payment flow. Moreover, the relative importance of each factor was calculated. It is worth mentioning several highlights. One is that the risk associated with physical flow is the most important risk category among the three categories. It is recommendable that the managers, if the available resources are rather limited, could perhaps give priority to risks associated with physical flow in designing risk control policies. This finding is indeed consistent with some of the previous studies in this field as mentioned in the Introduction.
The other highlight is that, amongst the thirty five risk factors, “shipper hiding cargo information” is the most serious risk factor. This reflects the shippers’ opportunistic
27
behaviour, which, has actually been recognised widely in the maritime industry. In one of the interviews, the interviewee explained that –
We charge expensive freight and insurance for transporting expensive cargo and/or dangerous goods. Some shippers will hide the cargos information in order to save the money. This action may produce some serious consequences, such as explosion if the cargo is dangerous goods or cargo damage if the cargo is fragile.
In recognition of this issue, the IMO proposed a regulation regarding verification of containers’ actual weight before loading onto a ship, and suggested that if a shipper failed to comply with the verified weight certificate of the containers’ gross weight, the loading of such containers ought to be refused.
Furthermore, our research “refines” the findings, of some previous studies by placing the risk factors addressed therein in a full “risk picture” which was developed systematically. For example, our research confirmed that empty container transportation was a risk element. However, the findings showed that it is not that important compared to the other risk factors: it ranks 22nd for causing financial loss, 26th for reputation loss, and 22nd for safety and security incident related loss. This may be explained by the fact that although empty container repositioning could incur a significant amount of costs, the shipping industry has long been aware of the trade imbalance and has already been prepared to accept such risk. Notteboom (2006) found that “port/terminal congestion” was the main source of schedule unreliability, followed by “port/terminal productivity below expectations”, and “unexpected waiting times due to weather or on route mechanical problems”. Schedule reliability is an important aspect in container shipping reputation performance, transportation delay would undoubtedly harm shipping companies’ reputation. In putting these factors onto the full “risk picture” developed in our research, it is obvious that “port congestion” and “unstable weather” are important. However, when compared to other risk factors, “port/terminal productivity being below expectations” is not that important since it ranked 14th in respect of reputation loss.
Several studies found that information asymmetry was an important issue in some supply chains such as retailer or manufacture (e.g. Forrester, 1961; Lee et al., 1997). However, it is found in our study that in the maritime context, information asymmetry among the players in the market is not that important: it ranked 31st for causing financial loss, 19th for reputation
28
loss, and 12th for safety and security incident related loss. As an interviewee put it in one of our interviews with the shipping companies –
We do not really care about information asymmetry. According to 80/20 rule, compared to the cargo flow starting from small shippers through brokers or forwarders to our company, the large shippers, who can offer large scale cargo directly to us without brokers or forwards, are the ones with which we are really concerned.
Our research results support also some previous findings, e.g., Fu et al. (2010). ). Our paper confirms that the pirate or terrorist attacks is an important risk element in causing financial loss and safety and security incident related loss; as shown in the two risk maps, it also has very serious risk consequence among the 35 risk factors, especially in safety and security incident related loss risk map. Our research findings also support Notteboom and Vernimmen’s (2009) findings. It is confirmed that oil price rise is an important risk factor, especially for financial loss where it has the largest impact. In the financial loss risk map, the oil price rise is shown to have the highest likelihood and consequence. However, the consequences are not that important in the reputation loss risk map and in the safety and security incident related loss risk map. Our findings also confirm that port congestion is an important risk factor (Notteboom, 2006). It is found to be the third most important risk factor regarding both financial loss and reputation loss, and it appears in the high risk zone in the financial loss risk map. In addition, our research shows that the damage to frozen cargo/ reefer containers has an important risk consequence in both the financial loss risk map and the safety and security incident related loss risk map (Tseng et al., 2012).
5. Conclusions
This study presents a hierarchical classification of risks in container shipping operations from a logistics perspective. Risks are classified into three categories: risk associated with information flow, risk associated with physical flow, and risk associated with payment flow. Each category consists of several elements (sub-categories): the information one consists of information delay, information inaccuracy, and IT problems; the physical one consists of transportation delay and cargo/asset damage; the payment one consists of currency exchange, payment delay, and non-payment. Each risk element consists of a number of risk factors and this paper considered a total of thirty five risk factors. The risk scales are measured by
29
multiplying risk likelihood and severity of risk in terms of three different consequences, i.e., financial loss, reputation loss, and safety and security incident related loss.
Among the three categories of risks, it is found that risks associated with physical flow are generally more significant than those associated with information and payment flows. However, “shippers hiding cargo information (non-declare)”, that is a risk factor associated with informational flow, is the most serious risk factor amongst all the others in respect of all three types of consequences. It is interesting to note that this risk factor has never been addressed in any previous studies, it was suggested by the shipping company mangers during the interviews.
In respect of financial loss, “oil price rise”, “shippers hiding cargo information (non-declare)”, and “port congestions” are the top three risk factors. It is thus suggested that if a shipping company aims to minimise its financial loss caused by risk incidents, consideration about these factors should be prioritised. If, however, the shipping company prefers to focus on its reputation loss, it needs to pay more attention to “shippers hiding cargo information (non-declare)”, “damage caused by transporting dangerous goods”, and “port congestions” as they are the top three risk factors in respective of reputation loss. “Shippers hiding cargo information (non-declare)”, “damage caused by transporting dangerous goods”, and “attack from pirates or terrorists” are the top three in respect of safety and security incident related loss.
Three risk maps are created to identify the importance of each risk factor in respect of the three types of risk consequences. The risk maps offer an intuitive view of the level (low, moderate, high, and extreme) of each risk factor and their likelihood and consequence.
The contributions of this paper are as follows:
(1) This study makes empirical contribution to the literature as no studies so far have approached the container shipping operational risks from a logistic perspective including all three flows (physical, information, payment) based on the empirical data from industrial experts.
(2) It provides an inclusive and comprehensive analysis of the risks in container shipping operations which we believe is of importance to the shipping industry. It has not only
30
identified all the risks but also explored and analysed the relative significance of each factor in respect of three different risk consequences, namely, financial loss, reputation loss, and safety and security incident related loss. This could provide useful insight for container shipping company managers and can assist them in better understanding the risks in their operations and in differentiating their efforts on mitigating risks.
(3) A new method is proposed to calculate the risk scale over multiple respondents. This method overcomes the drawback of the simple risk scale averaging method, which may distort the statistic result because it includes the components obtained by multiplying one respondent’s likelihood with another respondent’s consequence.
We suggest that further research may focus on exploring appropriate risk mitigation strategies and evaluating their relative performance in managing container shipping operations.
Reference
Alphaliner (2013), Top 100 Operated Fleets. Available at: http://www.alphaliner.com/top100/ (accessed 14 August 2013)
Angulo A., Nachtmann, H., and Waller, M.A. (2004), “Supply chain information sharing in a vendor managed inventory partnership”, Journal of Business Logistics, Vol. 25 No. 1, pp. 101-120.
Bebbington, J., Larrinaga-Gonza´lez, C. and Moneva, J. (2008), “Corporate social responsibility reporting and reputation risk management”, Accounting, Auditing and Accountability Journal, Vol. 21 No. 3, pp. 337-361.
Beretta, S. and Bozzolan, S. (2008), “Quality versus quantity: The case of forward-looking disclosure”, Journal of Accounting, Auditing and Finance, Vol. 23 No. 3, pp. 333-376. Chen, Y. (2008), “Research on trust among supply chain partners”, in Zhang, H., Zhao, R.M.
and Xie, Z. (Eds.), Industry cluster and meta-studies: proceedings of international conference on industry cluster development and management, June 27-30, 2008, Orient Academic Forum, China, pp.742-745.
Cox, L.A. (2008), “What’s wrong with risk matrices?”, Risk Analysis, Vol. 28 No. 2, pp. 497-512.
Creazza, A., Dallari, F., and Melacini, M. (2010), “Evaluating logistics network configurations for a global supply chain”, Supply Chain Management: An International Journal, Vol. 15 No. 2, pp. 154-164.
DeLone, W. H. and McLean, E. R. (1992), “Information systems success: the quest for the dependent variable”, Information Systems Research, Vol. 3 No. 1, pp. 60-95.
Drewry (2006), Annual Container Market Review & Forecast 2006/07, Drewry Shipping Consultants Ltd, London.
Drewry (2009), Risk Management in International Transport and Logistics, Drewry Shipping Consultants Ltd, London.
Elky, S. (2006), An Introduction to Information System Risk Management, SANS Institute, white paper.
Ewert, K. (2008), “Risk management”, Handbook of Container Shipping Management, Vol. 2 No. 33, pp. 71-85.