Effort Estimation for Agile Software Development: Comparative
Case Studies Using COSMIC Functional Size Measurement and
Story Points
Murat Salmanoglu
Middle East Technical University, Ankara,
Turkey
Tuna Hacaloglu Atilim University, Ankara
Turkey
Onur Demirors
Izmir Institute of Technology, Izmir,
Turkey
University of New South Wales, Sydney,
Australia
ABSTRACT
Agile methodologies have gained significant popularity among software development organizations during the last decade. Although agile methodologies are regarded as minimizing formal processes, they still utilize an estimation methodology for proper management. Story point is the most common input for agile effort estimation. Story point is an arbitrary measure; it reflects experiences of project participants. On the other hand, functional size is an alternative measure used in practice as an input for effort estimation. In this research, we collect and present the outcomes of three case studies which compared the effectiveness of COSMIC-based and story point based effort estimation in agile context. On selected projects of these organizations, software functional size was measured with COSMIC functional size measurement methodology. Effort prediction models were formed by using COSMIC size and actual effort spent; and the models were tested in terms of their effectiveness. The results show controversial outcomes. For all the cases, COSMIC based estimation was more precise. Therefore, COSMIC is an appropriate measure to estimate the effort in organizations that adopt agile software development. It is also observed that COSMIC allowed for computing productivity which has less disperse distribution than the productivity computed with SP. The data is also provided to help other researchers conduct their own studies.
CCS CONCEPTS
• Software and its engineering → Agile software development • Software and its engineering → Software
Permission to make digital or hard copies of all or part of this work for personal or
classroom use is granted without fee provided that copies are not made or distributed for profit or commercial advantage and that copies bear this notice and the full citation on the first page. Copyrights for components of this work owned by others than ACM must be honored. Abstracting with credit is permitted. To copy otherwise, or republish, to post on servers or to redistribute to lists, requires prior specific permission and/or a fee. Request permissions from [email protected].
IWSM/Mensura '17, October 25–27, 2017, Gothenburg, Sweden © 2017 Association for Computing Machinery.
ACM ISBN 978-1-4503-4853-9/17/10…$15.00 https://doi.org/10.1145/3143434.3143450
development process management • General and reference
→ Metrics
KEYWORDS
Effort estimation, COSMIC, functional size measurement, story points
ACM Reference format:
M.Salmanoglu, T. Hacaloglu, O. Demirors. 2017. Effort Estimation for Agile Software Development: Comparative Case Studies Using COSMIC Functional Size Measurement and Story Points. In Proc. of 27th Intern. Workshop on Software Measurement and 12th Intern. Conf. on Software Process and Product Measurement, Gothenburg, Sweden, October 25–27, 2017 (IWSM/Mensura ’17), 9 pages.
https://doi.org/10.1145/3143434.3143450
1
INTRODUCTION
Software effort estimation is one of the most critical activities for managing software projects. A small variation in the precision of the estimation may result in a significant loss for the organizations. On the contrary, effective estimation has a substantial positive impact on project management and moreover, it reduces the risks related with schedule and cost overruns. Abran emphasizes that estimation is recognized by mature software organizations as a process that provides a significant business advantage [1].
There are numerous software estimation methodologies used in practice. These methodologies can be divided into two main categories: formal models and expert judgments [2]. Formal estimation methods employ various statistical techniques to estimate software effort. They require a quantifiable input to be used as an independent variable in the method. Expert judgments, which may involve systematic and un-systematic approaches, usually require one or more experts to estimate the required effort for the development process. Expert judgments are likely to be affected by the specific capabilities of estimators and can have differing results across projects. This subjectivity causes challenges for assessing the performance of estimations.
Although methods depending on expert judgments may have their strong points in some situations, formal methods have favorable properties for contemporary software organizations.
Formal methods use a quantifiable input to estimate required effort in which software size is one of the most common inputs [3]. As pointed by Commeyne et al. [4] even though agile community prefers expert judgement oriented estimates, COSMIC as a size measurement method offers better estimations and evidence about team performance. Once measured, software size is also used for various purposes such as normalizing attributes for statistical process control [5]and valuing the software as an asset [6]. Traditionally, software line of code is frequently used as size measure for software; however, functional size measures are also common as they are standardized methods and have a significant advantage of usability in early phases [7]. COSMIC [8] is one of the most recent standardized functional size measurement method frequently used in industry.
Agile software development is an iterative and incremental development approach that accepts the change in any time during the software development and adapts itself accordingly by encouraging fast responses [9]. Organizations choose to use agile methodologies to benefit from their quicker response rates.
Although there are plenty of proposed size measurement and effort estimation techniques, no commonly accepted standardized practice for agile software development exists. Effort estimation is seen as one of the major challenges in agile development methodologies [10]. In agile approaches, the most common effort estimation approach is the use of expert opinion [11]. Story points (SP) is a frequently used input to estimate required development effort in organizations utilizing agile approaches. To assign SP, specialists meet and appoint subjective values for the software to be developed.
This paper presents our study on the effectiveness of using COSMIC functional size based prediction models for effort estimation using case studies in agile contexts. The case studies were conducted in organizations utilizing agile methodologies and using story points to estimate project effort. In these cases, story point based estimation meetings had been performed beforehand. We have measured COSMIC functional sizes for these projects retrospectively and established prediction models based on functional sizes. By comparing the results with the actual efforts utilized during the projects and during the effort estimation tasks, we compared the effectiveness of the models.
This study contributes to the literature by providing a comparison of effort estimation effectiveness of functional size based models and story point based approaches. We have observed that the function point based models were precise for all cases. We also have found out that function points based approach required less effort for estimation in one case where measurement effort is recorded. In addition, we herewith provide the data from the case studies so that researchers can conduct further research.
In the second section, we review the related literature on common effort estimation methods used in agile approaches. In the third section, case studies are explained in detail by providing their data and results. In the conclusion chapter the results of the case studies are discussed with the limitations of the study along with potential future works.
2
LITERATURE
With the proliferation of the usage of agile methodologies among software development practitioners, effort estimation in agile context captured lots of attention. As a result of this attention, various studies investigated effort estimation methodologies in agile software development projects[11].
Effort estimation is the prediction of how much effort a development activity requires to finish. In the literature on effort estimation in agile development context, most commonly used effort estimation approaches, presented by Usman, Mendes, Weidt, and Britto depend on subjective estimation. The subjective estimation techniques for effort estimation are given as expert judgment, planning poker, and use case points estimation method [11]. A recent survey conducted in 2016 by Usman & Britto examined effort estimation in globally dispersed and co-located agile software development organizations and found out that subjective assessment by experts were adopted in both situations. Moreover, for both situations, the most frequent status observed was the underestimation [12].
In agile methodologies one of the most common estimation methods is the use of story points. User stories are “requirements artifacts” in agile methodologies and story point concept is utilized to estimate the effort needed to implement a user story
[13]. User stories are in essence the “light weight requirements”
[14].
In story point concept, user stories are rated with story points [15] representing “a relative unit of hardness or difficulty of developing the user story” [16]. Planning poker is one of the
most frequently used techniques to assign story points to user stories. It is suitable with agile philosophy because it is not a heavy process and promotes the conversation among the estimators [17]. In a planning poker session, project participants come together and evaluate each user story [18] and decide the total story points for each user story by using cards.
Even though it is a widely used metric, story point also received criticisms from researchers. Zahraoui and Idrissi suggested three factors that they call adjustment factors to enhance story point estimation. Priority, story size, and complexity factors aim to decrease the subjectivity and inaccuracy of story points usage for effort estimations in Scrum [19]. The authors provided a theoretical study but did not validate their approach using data from organizations.
Hamouda emphasizes that story point values are changing among teams and this can be a challenging situation for the organizations that either desire to control team performance or require complying with CMMi Level 3 [20] practices, as CMMi values measuring stability [21].
Santana, Leoneo, Vasconcelos, and Gusmão investigated the relation between function points and story points on agile software development projects. In a project conducted for Brazilian Government Agency, they used IFPUG function points [22] to measure the size, SP for the estimates [23]. As a result, they found a positive correlation between functional size and number of story points for 2191 stories and 18 iterations. Huijgens & Solingen presented a replicated study of Santana et
Effort Estimation for Agile Software Development IWSM/Mensura'17, October 25–27, 2017, Gothenburg, Sweden al.’s work [23] in a project for a Dutch banking organization and
analyzed the relationship between story points and function points [24]. They measured the functional size of 14 releases with NESMA [25] guidelines and estimated story points. In contrast to the study by Santana et al [23], they find a negative correlation and consequently suggest that it may be early to make conclusions about the relationship between function point and story point.
In 2016, Commeyne, Abran, and Djouab conducted a case study where they compared the estimation models obtained by using Story Points (SP) and COSMIC Function Points (CFP) in Scrum environment in terms of performance [4]. In this study, the researchers conclude that estimation models using COSMIC Function Points have much smaller variance when used in the organization. Besides, Commeyne, Abran and Djouab also point that, by utilizing COSMIC Function Points in a Scrum environment it is possible to compare the productivity objectively from one task to another.
Software developing organizations utilize story points to estimate their project efforts; however, estimation based on story points directly depend on the experiences of the project
participants and don’t provide objective estimates. Building
functional size based estimation models could prove to be more reliable for the organizations in addition to providing
comparable objective size measurements. We used
measurements and estimations from three different organizations from three different case studies to analyze effectiveness of using estimation models with COSMIC functional size measurement.
3
CASE
STUDIES
In this part, three case studies conducted in software organizations using agile methodologies are presented, explained and their results are analyzed. Main purpose of the analysis is to observe the possible benefit of using CFP based estimations in different case studies in one source. The case studies have been conducted by different experts and in different contexts namely in different organizations having their own practices. Consequently, variations on available artefacts that should be used for estimation and measurement creates the opportunity to realistically assess the success of using functional measurement in agile contexts. Therefore, we find noteworthy to report the results of these case studies in a combined manner to draw a more holistic view of applying functional size measurement in organizations adopting agile methodologies. We explain each case study in the sub-sequent sections. Additionally, providing a larger data set and comparing the results.
Each study is briefly explained under its own subtitle with the results provided in them. In the subtitle “Analysis of data used in the case studies” the data from the studies are analyzed together to observe their results under the same assumptions and conditions.
3.1
Case
Study 1
In the first case study [26] ten sprints from a web portal project were analyzed. The organization where the study is conducted is the Turkish office of a large security software developer utilizing SCRUM as an Agile Methodology. 6 software developers and 2 software testers were working in the sprints used in this study.
To assign story points (SP) to the user stories they used planning poker technique. At the beginning of each three week sprints, they conducted a planning meeting with the attendance of all team members. In these meetings, they assigned story points for each user story and then chose the story points considering their priorities and points. They decided total number of story points committed for each sprint by using their previous experience in the project.
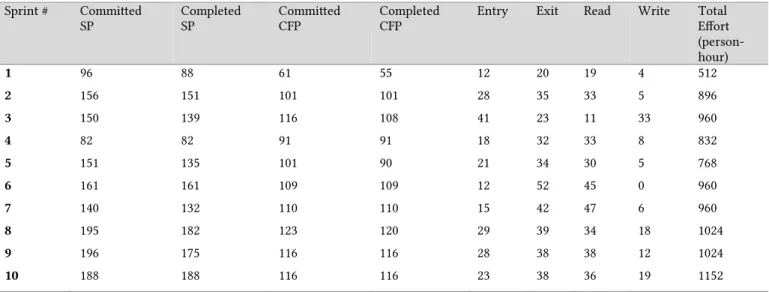
The organization used JIRA to document and monitor user stories. User stories used for this study were selected from JIRA and measured by the information stored in it. The data collected includes committed and completed story point data and total person-hours spent for each of the ten sprints. COSMIC size of committed and completed user stories were also measured. Committed data include the size of all user stories for a specific sprint, completed data, however, only include successfully completed user stories. Data collected during the case study is given in Table 1. The columns in the table represent; the number of the sprint, total story points committed at the beginning of the sprint, total story points completed during the sprint, total functional size of the committed software at the beginning of the sprint, total functional size of the completed software during the sprint, entry data movements, exit data movements, read data movements, write data movements, and total effort spent during the sprint.
COSMIC based productivity rates for sprints were calculated by dividing COSMIC functional size (FS) of completed user stories for a specific sprint to total effort spent for that sprint. Similarly, productivity rates for story points were calculated by dividing story points for a specific sprint to total effort spent for completed user stories for that sprint. When standard deviations of SP and COSMIC Function Point (CFP) productivity rates were compared, it is observed that the value for CFP is more than three times larger than the value for SP productivity rates. This result shows COSMIC FS is a more reliable estimation input compared with SP for the selected case.
Effort to perform CFP calculation is also identified. As SP has been collected in planning meetings which provide many
additional benefits in addition to SP identification, it wasn’t
possible to measure a comparable effort data for SP estimation. Calculation of COSMIC function sizes of the ten sprints took 41 hours for this case study for one measurer and the average effort to measure one sprint is equal to 4,1 person-hours per sprint.
Sprint # Committed
SP CompletedSP CommittedCFP CompletedCFP Entry Exit Read Write Total Effort (person -hour) 1 96 88 61 55 12 20 19 4 512 2 156 151 101 101 28 35 33 5 896 3 150 139 116 108 41 23 11 33 960 4 82 82 91 91 18 32 33 8 832 5 151 135 101 90 21 34 30 5 768 6 161 161 109 109 12 52 45 0 960 7 140 132 110 110 15 42 47 6 960 8 195 182 123 120 29 39 34 18 1024 9 196 175 116 116 28 38 38 12 1024 10 188 188 116 116 23 38 36 19 1152
It should be noted that compared to the other case studies mentioned in this paper, this case study has the advantage of mature project documentation, which reduces the effort required for size measurement.
3.2
Case Study 2
Second case study [27] is conducted in a large software organization using agile development approaches. The organization employs more than 500 software engineers and develops software mainly for telecommunication industry. The case study aimed to compare effectiveness of estimations based on COSMIC function size and expert judgments from real cases in a software development organization. Change requests given to a specific development team and development efforts related with these requests were used for comparison. The efforts for these changes were estimated by using story points which were determined by experts. As the story points values directly converted to effort estimations, this case study used effort estimations instead of SP values. In the case study, estimated and actual efforts for change request (CR) documents are compared with functional size based estimation models. These models were built with the measured COSMIC FS from the same CR documents. Data collected during the case study is given in
Table 2. The columns in the table represent; the number of the project, total functional size of the completed software, entry data movements, exit data movements, read data movements, write data movements, total effort spent for the project, and total effort predicted for the project.
Regression analysis was used to understand the relation between COSMIC functional size and actual effort spent. The effort spent to measure COSMIC functional size from CR documents was also kept to understand the effort requirements for sizing.
The requirements documentation available to measure COSMIC size were not mature so scope documents, expert knowledge, database structure, and source code are used to measure the size. Two regression models were built; one by using COSMIC size as independent variable and one by using predicted effort as an independent variable. For both of the models, actual effort values were a dependent variable. Although both of the models provided acceptable results, models using COSMIC size had better results with lower significance-F value and better MMRE and PRED(30) values.
Table 2:Data used in Case 2 Project # Completed
CFP Entry Exit Read Write EffortTotal (person -hour) Predicted Effort (person -hour) 1 79 8 26 35 10 512 480 2 8 1 1 5 0 64 80 3 69 8 14 28 19 432 64 4 29 1 1 11 16 128 200 5 120 13 27 62 18 920 800 6 43 5 15 16 7 240 224 7 230 4 18 178 30 1280 1160 8 62 4 5 21 32 400 360 9 15 1 1 4 9 80 64 10 45 2 10 17 16 160 136
The total effort spent was 10 person-day to calculate the functional size of 10 CRs totaling 700 CFP. Most of this effort is
Effort Estimation for Agile Software Development IWSM/Mensura'17, October 25–27, 2017, Gothenburg, Sweden spent to collect the necessary information as user stories were
not well documented.
3.3
Case Study 3
Third case study [28] [29] is conducted in a large Turkish organization which were utilizing SCRUM methodology and developing software mainly for finance and banking industry. Effort estimation models developed using COSMIC function points were compared with effort estimation models that are developed using story points. Historical data were collected from
the organization’s metric collection tool, which is specifically
designed for agile metrics. In total, 9 software projects were evaluated. Data collected during this case study is given in Table 3. Even though story point values are directly related with the effort estimations, estimated effort values are not provided. The
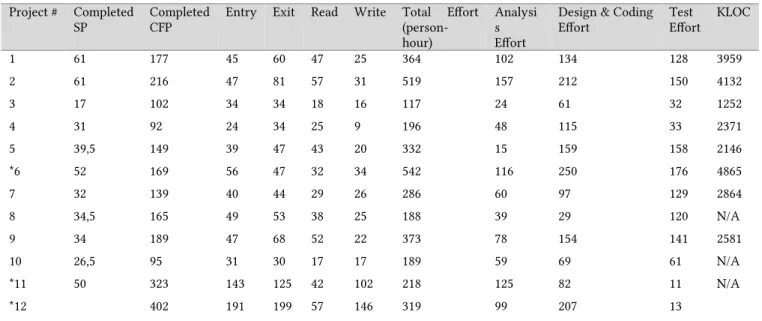
columns in the table represent; the number of the project, total number of story points of the completed software, total functional size of the completed software, entry data movements, exit data movements, read data movements, write data movements, total effort spent for the project, analysis effort spent for the project, design and coding effort spent for the project, test effort spent for the project, and total thousand lines of codes developed during the projects.
A problem faced was the lack of documentation, as the organization is using SCRUM without any well-defined requirements documentation. As a result, backlog user stories of the selected software were used together with any other supporting documents for measurement.
Table 3:Data used in Case 3
Project # Completed
SP CompletedCFP Entry Exit Read Write Total Effort(person
-hour)
Analysi s Effort
Design & Coding
Effort TestEffort KLOC
1 61 177 45 60 47 25 364 102 134 128 3959 2 61 216 47 81 57 31 519 157 212 150 4132 3 17 102 34 34 18 16 117 24 61 32 1252 4 31 92 24 34 25 9 196 48 115 33 2371 5 39,5 149 39 47 43 20 332 15 159 158 2146 *6 52 169 56 47 32 34 542 116 250 176 4865 7 32 139 40 44 29 26 286 60 97 129 2864 8 34,5 165 49 53 38 25 188 39 29 120 N/A 9 34 189 47 68 52 22 373 78 154 141 2581 10 26,5 95 31 30 17 17 189 59 69 61 N/A *11 50 323 143 125 42 102 218 125 82 11 N/A *12 402 191 199 57 146 319 99 207 13
For the analysis of the data, parametric models were used to analyze the relation between size and effort. Several regression models (simple, multiple, polynomial, power, exponential, and logarithmic) were established using functional size, actual effort, and story point values. Artificial neural network was also used with function point and effort data. To determine estimation accuracies of these models MMRE and PRED(30) values for each model were calculated.
Different models for effort estimation were established, both with COSMIC functional size and story points. It should be noted that building a statistical estimation model based on story points should be approached with caution, as story points are estimation rather than an objective measure.
As a conclusion, nearly all models using COSMIC resulted with acceptable outcomes. However; best results for MMRE and PRED(30) calculations are achieved in multiple regression models using data movement types as independent variables.
Story point estimations took less effort than COSMIC size measurements. The reason behind this result is the additional effort required to analyze the software to be measured, as the requirements were undocumented.
3.4
Analysis of data used in the case studies
The data used in all three case studies are given respectively inTable 1, Table 2 and Table 3. These case studies are conducted independently, however, all three are used to provide the main measures for this analysis. Main measures can be listed as: functional size of the completed software product, distribution of data movements, effort spent for the completed software product, and story point or effort estimation data for the completed product.
In addition to three main common data, which is total size, data movements, and total effort, cases have some additional data. Case 1 provides committed story points and committed CFP
and Case 3 provides effort distribution among project phases and total line of code for each project. Case 1 and 3 used story points to compare with COSMIC and case 2 used effort predictions as person-hours.
In this study, before replicating the models with the given data, standard deviations are calculated to compare the deviations between average productivity values of CFP and SP. Productivity represents unit CFP or SP developed with 1 person-hour effort spent. To calculate the standard deviations, STDEV.P() function of Microsoft Excel is used. For case 1 CFP productivity is 0,005 (mean:0,11) and SP productivity is 0,023 (mean:0,16). For case 2, CFP productivity is 0,044 (mean:0,18), but
there isn’t any SP data. For case 3, standard deviation of CFP
productivity is 0.17 (mean:0,56) and SP productivity is 0,03 (mean:0,14). These values show that CFP productivity follows a less dispersed distribution than SP productivity for the projects in both cases.
The data from the cases are analyzed by plotting SP and CFP values against actual effort. The plots for Case 1 are given in the charts in Fig. 1 and Fig. 2. The plots showing the relation between functional size and actual effort provide an observable linear relation which can also be seen from the increased R2
value of the linear equation given in the chart.
Figure 1:Case 1-SP vs actual effort
Figure 2:Case 1-CFP vs actual effort
Plot charts for Case 2 are given in Fig. 3 and Fig. 4. As case 2 provides predicted effort derived from SP values, this chart shows the relation between predicted and actual effort. Similar to case 1, the plots with CFP shows a better relationship with an increased R2 value.
Figure 3:Case 2-Predicted effort vs actual effort
Figure 4:Case 2-CFP vs actual effort
Charts of Case 3 are given in Fig. 5 and Fig. 6. Similar to other cases CFP vs actual effort provide a better line equation; however, both SP and CFP give a much smaller R2 value
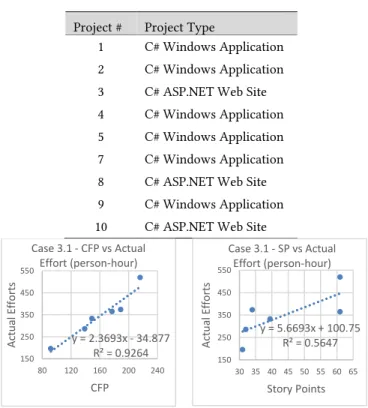
compared with previous cases. The plots reveal a rather disperse distribution for the projects. After observing the distribution of the plots, we decided to look for the project types and divide them into groups if possible. As listed in Table 4 there are two types of projects: Windows applications and asp.net web sites. We conducted a similar analysis by divided these two groups of projects. First group consisting from windows applications is named as Case 3.1, and second group is named as Case 3.2. Their plot diagrams are given in Fig. 7 and Fig. 8.
Figure 5:Case 3-SP vs actual effort
y = 3.9322x + 345.31 R² = 0.6648 400 600 800 1000 1200 50 100 150 200 A ctu al eff o rt Story Points Case 1
SP vs Actual Effort (person-hour)
y = 8.7956x + 15.168 R² = 0.9327 400 600 800 1000 1200 50 70 90 110 130 A ctu al eff o rt CFP Case 1
CFP vs Actual Effort (person-hour)
y = 1.0414x + 50.031 R² = 0.9093 0 300 600 900 1200 1500 0 200 400 600 800 1000 1200 A ctu al eff o rt Predicted effort Case 2
Predicted Effort vs Actual Effort (person-hour)
y = 5.968x + 3.8385 R² = 0.9528 0 300 600 900 1200 1500 0 50 100 150 200 250 A ctu al eff o rt CFP Case 2
CFP vs Actual Effort (person-hour)
y = 7.173x + 16.697 R² = 0.7135 0 200 400 600 10 20 30 40 50 60 70 A ctu al eff o rt Story Points Case 3
Effort Estimation for Agile Software Development IWSM/Mensura'17, October 25–27, 2017, Gothenburg, Sweden
Figure 6:Case 3-CFP vs actual effort
Table 4:Project types for Case 3
Project # Project Type
1 C# Windows Application 2 C# Windows Application 3 C# ASP.NET Web Site 4 C# Windows Application 5 C# Windows Application 7 C# Windows Application 8 C# ASP.NET Web Site 9 C# Windows Application 10 C# ASP.NET Web Site
Figure 7:Case 3.1-CFP & SP vs actual effort
Data in the Case 3.1 provides a better fit with CFP values while Case 3.2 provides a better fit with SP values. It should be noted that Case 3.2 contains three projects. A crucial point to emphasize is the linear formula for Case 3.1 with CFP values includes a subtraction for the constant value. This may show that this formula can only be used with projects over a certain functional size.
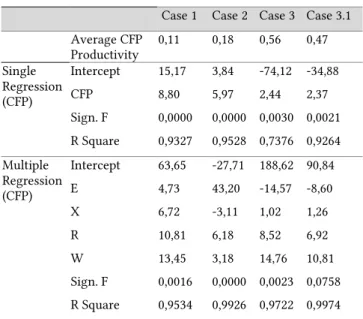
Using the values given in the discussed case studies, we repeated the analyses. Created models are applied on the projects of the respective cases from which they are built to observe the effectiveness of estimations. There are three types of models: average CFP productivity, single regression, and multiple regression. In single regression models total CFP is the
independent variable, whereas in multiple regression models each data movement type is used as independent variables. There are three different models from each type from each individual case except Case 3.2, as it has only three data points this case is omitted from the analysis. The values for the resulting models are given in Table 5. In the table for the single regression models intercept values and coefficient for COSMIC functional size is given with significance F and R square values. For the multiple regression models coefficients for each data movements; entry, exit, read, and write.
Figure 8:Case 3.2-CFP & SP vs actual effort
Important point from the Table 5 worth noting is the increase in the CFP productivity rates of the cases. Case 1 consists of several sprints whereas Case 2 and 3 used projects, and the sizes of the projects used in Case 3 is significantly larger than Case 2. Even though the projects and sprints used in each individual case is expected to be on the same granularity levels, the change in CFP productivity may be resulted from the granularity differences between the cases.
Multiple regression models for Case 2, 3 and 3.1 resulted with a negative coefficient, for eXit data movement in Case 2 and for Entry data movements in Case 3 and 3.1. These may be a result of software characteristic in a way that some type of movements are easy to implement and therefore in higher amounts they may have a reducing effect on the effort.
After the models are structured they are applied to the data collected from the case studies and MMRE and PRED(30) values are calculated. The results of these calculations are given in
Table 6. In the table MMRE results lower than 30% and PRED(30) results higher than 80% are shaded. In addition to the shaded PRED(30) values, some models resulted with 78% PRED(30) values, which also need to be considered during evaluation. These values are specified with bold fonts.
All models are tested with the same project data that they are created from. Model created with the data of case 1, tested with projects from case 1.
In Table 6, Average Productivity shows MMRE and PRED(30) values for simple productivity ratio. Single Regression shows same data for single regression models and Multiple Regression shows multiple regression models. Row headers show MMRE and PRED(30) calculations for each case.
y = 2.4404x - 74.12 R² = 0.7376 0 200 400 600 80 100 120 140 160 180 200 220 240 A ctu al eff o rt CFP Case 3
CFP vs Actual Effort (person-hour)
y = 2.3693x - 34.877 R² = 0.9264 150 250 350 450 550 80 120 160 200 240 A ct ua l Ef fo rt s CFP Case 3.1 - CFP vs Actual Effort (person-hour) y = 4.1661x + 6.347 R² = 0.7816 100 140 180 220 15 35 55 A ct ua l Ef fo rt s Story Points Case 3.2 - SP vs Actual Effort (person-hour) y = 0.4372x + 111.91 R² = 0.1667 100 120 140 160 180 200 90 140 190 A ct ua l Ef fo rt s CFP Case 3.2 - CFP vs Actual Effort (person-hour) y = 5.6693x + 100.75 R² = 0.5647 150 250 350 450 550 30 35 40 45 50 55 60 65 A ct ua l Ef fo rt s Story Points Case 3.1 - SP vs Actual Effort (person-hour)
Table 5:Estimation models
Case 1 Case 2 Case 3 Case 3.1 Average CFP Productivity 0,11 0,18 0,56 0,47 Single Regression (CFP) Intercept 15,17 3,84 -74,12 -34,88 CFP 8,80 5,97 2,44 2,37 Sign. F 0,0000 0,0000 0,0030 0,0021 R Square 0,9327 0,9528 0,7376 0,9264 Multiple Regression (CFP) Intercept 63,65 -27,71 188,62 90,84 E 4,73 43,20 -14,57 -8,60 X 6,72 -3,11 1,02 1,26 R 10,81 6,18 8,52 6,92 W 13,45 3,18 14,76 10,81 Sign. F 0,0016 0,0000 0,0023 0,0758 R Square 0,9534 0,9926 0,9722 0,9974
These results support the findings of the individual case studies: CFP is a successful input for statistical estimation models in these samples.
Table 6:MMRE and PRED(30) results of estimation models
Average
Productivity RegressionSingle RegressionMultiple
MMRE Case 1 3% 3% 3% MMRE Case 2 20% 20% 11% MMRE Case 3 22% 22% 6% MMRE Case 3.1 5% 6% 1% PRED(30) Case 1 100% 100% 100% PRED(30) Case 2 80% 80% 90% PRED(30) Case 3 78% 78% 100% PRED(30) Case 3.1 100% 100% 100%
4
CONCLUSION
This research documents the results of three case studies conducted to compare the effectiveness of COSMIC based effort estimation and story point based effort estimation in agile context.
We observed that regression models that use COSMIC functional size as an independent variable provide successful estimates. Also, productivity calculated using CFP provides a less disperse distribution than productivity calculated using SP.
In the first case study, the measurer calculated average effort spent for CFP measurement. This average effort is quite low;
however, it wasn’t possible to compare it with exact effort values
required for SP estimation.
The case studies documented in this research show that COSMIC functional size can be used for effective effort estimation in organizations using agile methodologies. In addition to being more precise, COSMIC based estimation also requires low effort if the user stories include enough details.
An additional contribution of this research is to provide project data set from the case studies. Researchers can use this data to conduct additional analyses and compare the efficiencies of different estimation models.
There are also some limitations of this study. First of all, the cases described in this study are designed independently from each other, therefore, there are differences on the data collection and evaluation methods. First case is based on sprints and the other two are based on projects, moreover, the projects and sprints given in the case studies may not be on the same level of decomposition. Secondly, models are tested on the same projects
that they are built with as there wasn’t any additional project
from similar domains to test the models.
As a future work, we plan to conduct similar analyses to increase the sample size and identifying project attributes that might affect estimation models.
REFERENCES
[1] A. Abran, Software Project Estimation. Wiley-IEEE Computer Society Press, 2015.
[2] M. Jørgensen, B. Boehm, and S. Rifkin, “Software Development Effort Estimation: Formal Models or Expert Judgment?,” IEEE Softw., vol. 26, no. 2, pp. 14–19, 2009.
[3] A. Abran, J.-M. Desharnais, M. Zarour, and O. Demirörs, “Productivity - Based Software Estimation Models and Process Improvement : an Empirical Study,” Int. J. Adv. Softw., vol. 8, no. 1&2, pp. 103–114, 2015. [4] C. Commeyne, A. Abran, and R. Djouab, “Effort Estimation with Story
Points and COSMIC Function Points - An Industry Case Study,” Softw. Meas. News, vol. 21, no. 1, pp. 25–36, 2016.
[5] A. Tarhan and O. Demirors, “Apply Quantitative Management Now” IEEE Softw., vol. 29, no. 3, pp. 77–85, May 2012.
[6] B. Ozkan, O. Turetken, and O. Demirors, “Software Functional Size: For Cost Estimation and More,” in Software Process Improvement, Berlin, Heidelberg: Springer Berlin Heidelberg, 2008, pp. 59–69.
[7] C. Gencel and O. Demirors, “Conceptual Differences Among Functional Size Measurement Methods,” in First International Symposium on Empirical Software Engineering and Measurement, 2007, pp. 305–313. [8] C. Symons and A. Lesterhuis, “The COSMIC Functional Size
Measurement Method Version 4.0.1 Measurement Manual,” 2015. [9] K. Beck et al., “The Agile Manifesto,” 2001. [Online]. Available:
http://agilemanifesto.org/. [Accessed: 22-May-2017].
[10] S. Ziauddin, T. Kamal, and Z. Shahrukh, “An Effort Estimation Model for Agile Software Development,” Adv. Comput. Sci. its Appl., vol. 2, no. 1, pp. 314–324, 2012.
[11] M. Usman, E. Mendes, F. Weidt, and R. Britto, “Effort estimation in agile software development: A Systematic Literature Review,” in Proceedings of the 10th International Conference on Predictive Models in Software Engineering - PROMISE ’14, 2014, pp. 82–91.
[12] M. Usman and R. Britto, “Effort Estimation in Co-located and Globally Distributed Agile Software Development: A Comparative Study,” in 2016 Joint Conference of the International Workshop on Software Measurement and the International Conference on Software Process and Product Measurement (IWSM-MENSURA), 2016, pp. 219–224. [13] S. M. Satapathy, A. Panda, and S. K. Rath, “Story Point Approach based
Agile Software Effort Estimation using Various SVR Kernel Methods,” in The 26th International Conference on Software Engineering and Knowledge Engineering, 2014, pp. 304–307.
[14] M. Ali, Z. Shaikh, and E. Ali, “Estimation of Project Size Using User Stories,” in The International Conference on Recent Advances in Computer Systems, 2015.
[15] E. Coelho and A. Basu, “Effort Estimation in Agile Software Development using Story Points,” Int. J. Appl. Inf. Syst., vol. 3, no. 7, pp. 7–10, 2012.
Effort Estimation for Agile Software Development IWSM/Mensura'17, October 25–27, 2017, Gothenburg, Sweden Functional Size Measurement,” in 2016 Joint Conference of the
International Workshop on Software Measurement and the International Conference on Software Process and Product Measurement (IWSM-MENSURA), 2016, pp. 45–52.
[17] J. Leinonen, “Evaluating Software Development Effort Estimation Process in Agile Software Development Context,” University of Oulu, 2016.
[18] M. Tamrakar, R; Jørgensen, “Does the use of Fibonacci numbers in planning poker affect effort estimates?,” in 16th International Conference on Evaluation {&} Assessment in Software Engineering (EASE 2012), 2012, pp. 228–232.
[19] M. A. J. Zahraoui, H., & Idrissi, “Adjusting story points calculation in scrum effort & time estimation,” in Intelligent Systems: Theories and Applications (SITA), 2015 10th International Conference on, 2015, pp. 1–8.
[20] CMMI Product Team, CMMI® for Development, Version 1.3 CMMI-DEV, V1.3, no. November. 2010.
[21] A. E. D. Hamouda, “Using Agile Story Points as an Estimation Technique in CMMI Organizations,” in 2014 Agile Conference, 2014, pp. 16–23.
[22] ISO/IEC, “20926: Software and systems engineering -- Software measurement -- IFPUG functional size measurement method.” 2009. [23] C. Santana, F. Leoneo, A. Vasconcelos, and C. Gusmão, “Using Function
Points in Agile Projects,” Springer, Berlin, Heidelberg, 2011, pp. 176– 191.
[24] R. V Huijgens, H., & Solingen, “A replicated study on correlating agile team velocity measured in function and story points,” in In Proceedings of the 5th International Workshop on Emerging Trends in Software Metrics, 2014, pp. 30–36.
[25] ISO/IEC, “24570: Software engineering -- NESMA functional size measurement method version 2.1 -- Definitions and counting guidelines for the application of Function Point Analysis,” 2005. [26] A. Özdemir, “Effort Estimation with Cosmic Functional Size
Measurement Method In Agile Projects,” METU/II-TR-2017-88, Ankara, 2017.
[27] B. Çırtlık, “Comparison of Cosmic and Expert Judgement Effectiveness for Effort Prediction on Agile Projects,” METU/II-TR-2016-27, Ankara, 2016.
[28] N. Çizmeli, “Comparison of Functional Size and Story Points for Effort Prediction Effectiveness on Scrum Projects,” METU/II-TR-2013-4, Ankara, 2013.
[29] E. Ungan, N. Çizmeli, and O. Demirörs, “Comparison of Functional Size Based Estimation and Story Points, Based on Effort Estimation Effectiveness in SCRUM Projects,” in 40th Euromicro Conference on Software Engineering and Advanced Applications Comparison, 2014, pp. 77–80.