Open Access
Software
FACT
– a framework for the functional interpretation of
high-throughput experiments
Felix Kokocinski*
1,2, Nicolas Delhomme
1, Gunnar Wrobel
1,
Lars Hummerich
1, Grischa Toedt
1and Peter Lichter
1Address: 1Molecular Genetics, Deutsches Krebsforschungszentrum, 69115 Heidelberg, Germany and 2Wellcome Trust Sanger Institute, Wellcome
Trust Genome Campus, Hinxton, Cambridge CB10 1HH, UK
Email: Felix Kokocinski* - [email protected]; Nicolas Delhomme - [email protected]; Gunnar Wrobel - [email protected]; Lars Hummerich - [email protected]; Grischa Toedt - [email protected]; Peter Lichter - [email protected]
* Corresponding author
Abstract
Background: Interpreting the results of high-throughput experiments, such as those obtained from DNA-microarrays, is an often time-consuming task due to the high number of data-points that need to be analyzed in parallel. It is usually a matter of extensive testing and unknown beforehand, which of the possible approaches for the functional analysis will be the most informative
Results: To address this problem, we have developed the Flexible Annotation and Correlation Tool
(FACT). FACT allows for detection of important patterns in large data sets by simplifying the integration of heterogeneous data sources and the subsequent application of different algorithms for statistical evaluation or visualization of the annotated data. The system is constantly extended to include additional annotation data and comparison methods.
Conclusion: FACT serves as a highly flexible framework for the explorative analysis of large genomic and proteomic result sets. The program can be used online; open source code and supplementary information are available at http://www.factweb.de.
Background
A variety of algorithms and programs have been intro-duced to accomplish the processing of raw data as well as the statistical analysis of data from high-throughput experiments. But besides the mathematical complexity that needs to be handled, there is a biological complexity inherent to the data sets, too. Current means to analyze large-scale data sets usually target very specific questions and often fail to provide solutions that can be adapted to different types of data. Nevertheless, common and gener-alized questions for the interpretation of such data can be established as follows: i) What information is known
about the analyzed features (clones, genes, e.g.)? ii) Are there correlations between the experimental outcomes and the additional information (shared pathways, etc.)? iii) Is the outcome comparable with results of other exper-iments (genomic or gene expression data sets, publica-tions, etc.)?
The program Flexible Annotation and Correlation Tool
(FACT) was developed to address these questions by inte-grating data sources, tools and algorithms in a single open framework. First, FACT allows merging information from various data sources into one comprehensive annotation
Published: 28 June 2005
BMC Bioinformatics 2005, 6:161 doi:10.1186/1471-2105-6-161
Received: 14 March 2005 Accepted: 28 June 2005 This article is available from: http://www.biomedcentral.com/1471-2105/6/161
© 2005 Kokocinski et al; licensee BioMed Central Ltd.
This is an Open Access article distributed under the terms of the Creative Commons Attribution License (http://creativecommons.org/licenses/by/2.0), which permits unrestricted use, distribution, and reproduction in any medium, provided the original work is properly cited.
for an experimental data set. It then provides functional analysis tools to inspect and correlate this heterogeneous information. The functionality of FACT can be extended through the inclusion of new data sources, algorithms and programs by defining additional modules from a proto-type. This flexibility is achieved by a strong level of abstraction from the actual data, by the design of the underlying database and by the modular architecture of the software itself. The task to identify relevant biological interconnections reflected by the experimental results (e.g. participation of the analyzed genes in shared path-ways) is what we are targeting with the software intro-duced here.
Implementation
Integration of data sourcesThe integration of bio-molecular data from diverse sources such as public databases or clinical parameters (annotation) is a key challenge in the process of the analy-sis of high-throughput experiments. While the interpreta-tion of the outcome of a standard experiment used to depend on the knowledge of one human expert from the field, today's screening tools produce data quantities not manageable by human inspection. After receiving a list of differentially regulated genes from a microarray gene expression experiment comprising several hundreds or thousands of entries, it is not efficient to start the interpre-tation of these results by manually searching through publications. As a first step, broad biological themes should be identified and followed into a more detailed inspection.
Using network technologies, the availability of data sources is no more the limiting factor, but if accomplished manually, the obstacles for their integration are numer-ous. Often data are made available in different formats (HTML pages, flat files, direct database access) and very heterogeneous layouts. In addition the nomenclature (e.g. gene names) as well as the relationship of different sys-tems to each other are often inconsistent and require many manual selection and modification steps. At the same time, as much knowledge as possible should be inte-grated about the data features analyzed, since interesting unknown pathways and interconnections might be hid-den behind biological complexity.
As the first aspect, FACT accomplishes the task of integrat-ing heterogeneous information sources by abstraction from the specific data types to one basic concept. (figure 1, lower part). The smallest entities are data features, which are single items of information, either a name/value pair or additional textual description thereof. This could be a list of ids of clones with their relative expression as meas-ured on a cDNA microarray. They are grouped into data sets, combining data features relating to the same
experi-ment or a group of annotation terms for a certain set. In our example the clone/ratio pairs measured in one hybridization would be stored as one data set. The data sets originate from specific data sources, defining distinct types of experiments or annotation sources. One data source would be "cDNA microarray measurements with textual clone ids and numerical results". This architecture follows the idea, that the primary data must be repre-sented at a sufficient level of abstraction to make the data independent of the source technology [1]. The concept applies to experimental as well as to annotation data. Meta-data about the different data sources is stored in dedicated tables of the underlying database, describing the source with date and type of data.
Differences in nomenclature and the problem of relating one type of experiment to an other, as the second obstacle for data integration, has been addressed for gene and pro-tein centered research by the development of the GeneOn-tology system (GO) [2]. This hierarchical framework of a directed acyclic graph of annotations for gene attributes has become a de facto standard, which can be employed in the functional analysis of experiments. Similar projects have been initiated for example to organize the classifica-tion of molecular interacclassifica-tions in pathways and molecular complexes (Genome Knowledgebase / Reactome [3]). Using these resources FACT is able to compare experimen-tal results from technically distant applications.
However, most experiments differ in focus and design and usually no standard solution for their interpretation can be applied. The third aspect for an integrating approach therefore is high flexibility concerning the application of diverse analysis methods that have already been devel-oped for the interpretation of results or might be used in future.
Architecture
FACT consists of a MySQL database, a core library (as an
Application Programming Interface, API) and various mod-ules written in the language Perl. We also created an inter-face for the web-based usage of all functions of FACT [4]. The database reflects the transformation of heterogeneous data into a generalized format, storing information in
DateSet and DataFeature tables (figure 2). The core soft-ware framework supplies the basic functionality for data access in an object-oriented fashion and for adding and operating modules. These modules are adaptors and can be classified into three categories (figure 3):
I. Data loading
Different types of experimental data can be loaded using dedicated parser functions. This can be a simple functions to read tab-delimited data defined e.g. as a gene list with associated expression values. It can also be a more
complex solution to handle case descriptions from com-parative genomic hybridizations (CGH), a method that is employed to monitor copy numbers changes of all regions of a genome simultaneously on chromosome spreads. The individual modules read the specific file for-mat, perform transformations to the generalized format (i.e. convert them into data features) and use core library functions to store the data.
II. Annotation
Varying data sources can be utilized for the annotation of experimental data sets by different data-access functions (e.g. GO terms for gene names). Modules achieve this for instance through access to an online database or to a local copy of such database. Data of interest are then gathered and stored.
III. Analysis
Different functions can be used to inspect the annotated information and highlight underlying patterns (e.g. over-represented GO-terms). The modules typically produce
textual and graphical output to draw the researcher's attention to the most promising features of his data. Currently available functions of FACT are described below. Further flexibility is achieved by the concept of experimental and annotational data being reduced to the basic model of one data set with several data features, as described above.
All these modules use the FACT API. It offers a defined interface for the effortless extension to new sources and functions. Prototype modules for each category imple-menting this API are supplied. For the integration of annotation sources, available data can either be trans-ferred to the local system (data warehousing) or linked to the original source (database federation); the FACT sys-tem allows both options to be used by the module func-tions. Currently remote databases are accessed by the
EnsEMBL, BBID and Reactome modules; the CpG and
CGAP functions use locally stored information (see below). The update of the local data is accomplished
Layered architecture of the FACT framework Figure 1
Layered architecture of the FACT framework. The database reflects the abstraction of any experimental or annotation data to DataSets with DataFeatures, originating from a specific DataSource for which DataTypes and Parameters have been defined. The core library (API) supplies all functionality for accessing the database and for the operation of diverse modules, which are adaptors for specific DataSources or functions. The web interface or other applications are using FACT API functions.
semi-automatically be invoking of the respective update
function in the separate modules.
Finally, as there is an active development of software for the annotation and analysis of gene expression data in the language R (Bioconductor project [5]), and the handling of large data matrices is accomplished faster in R, we used the Perl/R interface RSPerl [6] in different modules to encapsulate analysis functions written in R. Other mod-ules employ the functionality from the BioPerl [7] and
Ensembl Perl API [8]. Available functionality
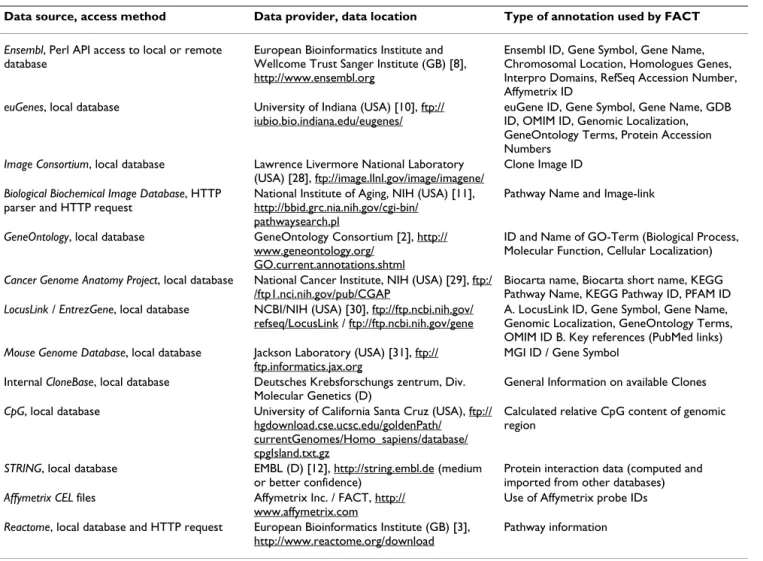
A variety of modules for the handling of different data sources (table 1) as well as for the application of basic data analysis and display functions (table 2) were devel-oped. Most of the current functionality is focused on
han-dling human and murine gene annotation information. Additional functionality can be added in a "plug-and-play" fashion, since new modules can be loaded dynami-cally into FACT.
To read in experimental results, a simple list (with terms or term-value pairs) or table can be used, or more specialized parser functions can be employed to read and decipher the notations of different types of results. One parser (2_Colums) reads tab-, or semicolon-separated lists and stores the data as terms of the data type that is passed as a parameter (e.g. gene symbol or clone id) and the respective value. Another function (LongList) expects terms only (list of genes that are to be annotated) or Affymetrix probe ids (AffyCelFile). The parser for CGH results translates ISCN notations of cytogenetic alterations [9] into the distinct chromosomal bands that are affected
FACT database schema Figure 2
FACT database schema. The database schema reflects the generalized handling of heterogeneous data. At the definition layer the data sources are defined as experimental, annotational or analysis sources. Also the types of data that they use are specified here. These types are linked to the individual sources which are defined in the data source layer. Parameters that the functions handling the sources can take are stored as well. The actual data – experimental as well as annotational – are saved as data set and data features in the data set layer.
while reading the data file. The bands are stored with the alteration -1 (loss of genomic material), +1 (gain), or +2 (high level amplification).
Data sources that can then be used for annotating these experimental results contain among others EnsEMBL data-bases [8], with functions providing numerous gene anno-tations on the human and murine genome (gene name, accession numbers, genomic localization, GO terms and other ids). The annotation data is fetched by using the EnsEMBL API or direct sql queries. Chromosomal loca-tions expressed as cytogenetic bands can be translated in megabasepair positions. This can permit the direct com-parison of results from genomic and expression experi-ments. Most common identifiers (IMAGE IDs, DDBJ/ EMBL/GenBank accession numbers, international clone names, MGD (Mouse-Genome Database) IDs or Probe-IDs as used on expression microarrays in the Affymetrix system) are recognized and used by the different annota-tion modules. Addiannota-tionally, homologous genes, sequence features, InterPro protein domains, CpG content and
PubMed references can be acquired. The euGenes database [10] modules delivers an additional set of broad annota-tions (Gene Symbol and Name, GDB ID, OMIM ID,
Genomic Localization, GO terms, etc.). The BBID module searches for representations of affected pathways in the
Biological Biochemical Image Database [11]. We store links to the images which sometimes allow the clarification of interactions better than textual description alone. Addi-tionally data is used from STRING [12] and Reactome [3] to point out protein interactions and involvement in molecular complexes.
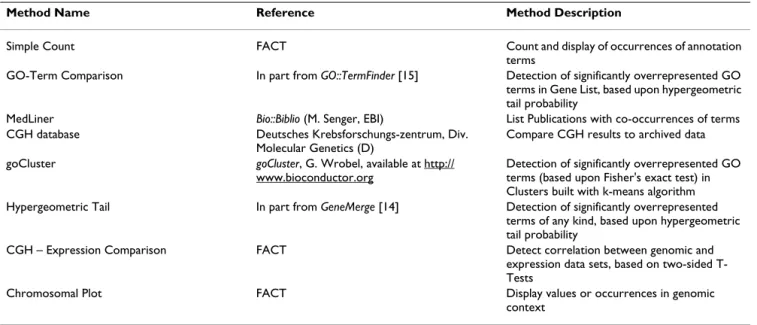
Annotation steps can be concatenated, allowing deriving from specific (e.g. Affymetrix Probe-IDs) to more general terms (e.g. gene symbols). This broad annotation that is facilitated by FACT is crucial for the researcher to acquire a complete picture of his data. The user can export the combined lists of annotated data in HTML, XML or text format. If desired the system can send them by email. Modules to correlate these annotated datasets with each other have been developed for FACT, incorporating exist-ing algorithms or presentexist-ing new approaches (table 2). For example, a counting procedure (SimpleCount) reports the number of occurrences of each annotation term. The module is independent of the type of data, one or more data sets can be added up and a threshold for reporting
Outline of the flow of information Figure 3
Outline of the flow of information. Modular DataSource-Adapters accomplish data access and data transformation from heterogeneous sources, making FACT a flexible framework.
can be defined. The results are displayed graphically in a chart and in a table format, directing the researcher's attention to distinct characteristics (figure 4). A more spe-cific approach to interpret list of genes lies in the explicit usage of GO terms. As originally introduced by Khatri et al. in the program OntoExpress [13] there are different methods and implementation to search for those parts of the GO tree that appear more often in the gene list ana-lyzed than by chance alone. For FACT we used an imple-mentation from the GeneMerge program [14] and the GO::TermFinder perl module [15]. Occurrences of terms in a gene list are normalized against a background, which might contain the annotations of all terms spotted on a chip or the entire genome, by using the hypergeometric tail probability (with Bonferroni correction if desired, example: figure 5). In our implementation, the function can be applied on GO data as well as on any other kind of annotation to detect overrepresented terms. Alternatively the Fisher's exact test can be used for this purpose. We
included part of this method taken from the EASE pro-gram [16] in a FACT function. We also developed a com-bined algorithm, which calculates a K-Means similarity matrix based on the experimental values and reports on significant terms with the Fisher's exact test within the identified groups afterwards (goCluster, G. Wrobel, availa-ble at http://www.bioconductor.org). Another analysis module dedicated to the comparison of genomic and expression data runs pairs of two-sided T-Tests on the groups of over- and under-expressed genes against the groups of enhanced/amplified and deleted genomic regions. This allows detecting a correlation between an altered genomic locus and the corresponding expression pattern. FACT can also represent experimental values or frequency counts in the genomic context which can be helpful for the identification and representation of locali-zation effects in the genome. This is achieved by reading in the genomic locations of data sets and generating bar chart images on top of prepared chromosome ideograms Table 1: Data Types and Sources accessible by current annotation modules.
Data source, access method Data provider, data location Type of annotation used by FACT
Ensembl, Perl API access to local or remote database
European Bioinformatics Institute and Wellcome Trust Sanger Institute (GB) [8], http://www.ensembl.org
Ensembl ID, Gene Symbol, Gene Name, Chromosomal Location, Homologues Genes, Interpro Domains, RefSeq Accession Number, Affymetrix ID
euGenes, local database University of Indiana (USA) [10], ftp:// iubio.bio.indiana.edu/eugenes/
euGene ID, Gene Symbol, Gene Name, GDB ID, OMIM ID, Genomic Localization, GeneOntology Terms, Protein Accession Numbers
Image Consortium, local database Lawrence Livermore National Laboratory (USA) [28], ftp://image.llnl.gov/image/imagene/
Clone Image ID
Biological Biochemical Image Database, HTTP parser and HTTP request
National Institute of Aging, NIH (USA) [11], http://bbid.grc.nia.nih.gov/cgi-bin/
pathwaysearch.pl
Pathway Name and Image-link
GeneOntology, local database GeneOntology Consortium [2], http:// www.geneontology.org/
GO.current.annotations.shtml
ID and Name of GO-Term (Biological Process, Molecular Function, Cellular Localization)
Cancer Genome Anatomy Project, local database National Cancer Institute, NIH (USA) [29], ftp:/ /ftp1.nci.nih.gov/pub/CGAP
Biocarta name, Biocarta short name, KEGG Pathway Name, KEGG Pathway ID, PFAM ID
LocusLink / EntrezGene, local database NCBI/NIH (USA) [30], ftp://ftp.ncbi.nih.gov/ refseq/LocusLink / ftp://ftp.ncbi.nih.gov/gene
A. LocusLink ID, Gene Symbol, Gene Name, Genomic Localization, GeneOntology Terms, OMIM ID B. Key references (PubMed links)
Mouse Genome Database, local database Jackson Laboratory (USA) [31], ftp:// ftp.informatics.jax.org
MGI ID / Gene Symbol Internal CloneBase, local database Deutsches Krebsforschungs zentrum, Div.
Molecular Genetics (D)
General Information on available Clones
CpG, local database University of California Santa Cruz (USA), ftp:// hgdownload.cse.ucsc.edu/goldenPath/
currentGenomes/Homo_sapiens/database/ cpgIsland.txt.gz
Calculated relative CpG content of genomic region
STRING, local database EMBL (D) [12], http://string.embl.de (medium or better confidence)
Protein interaction data (computed and imported from other databases)
Affymetrix CEL files Affymetrix Inc. / FACT, http:// www.affymetrix.com
Use of Affymetrix probe IDs
Reactome, local database and HTTP request European Bioinformatics Institute (GB) [3], http://www.reactome.org/download
(figure 6). The MedLiner module presents a simple litera-ture mining tool which uses the Bio::Biblio perl functions to find citations that are shared by two or more gene (Fig-ure 5). Example output files are also available at [4]. Application of the program
The Flexible Annotation and Correlation Tool has proven especially helpful with the interpretation of results from genomic and expression microarray experiments, but most functions can be applied to a broad variety of exper-imental data.
We demonstrate the benefits of FACT for the functional interpretation of the results from a comprehensive analy-sis of gene expression patterns in the development of non-melanoma skin-cancer conducted within our group [L. Hummerich et al.: Identification of novel tumor-associated genes in the process of squamous cell cancer development; sub-mitted]. Using two different sets of microarrays with 15.000 and 20.000 cDNA fragments respectively, the chemically induced multi-step development of squamous cell carcinoma was monitored. We used the dorsal skin of mice as a well-studied system for the development of epi-thelial cancer [18] with the carcinogen 7,12-dimethyl-benz-[a]-anthracene and the tumor promoter 12-O-tetradecanoylphorbol-13-acetate as inducing agents. Expression values were measured at different time-points of tumor formation. Genes with differentiated expression patterns are expected to play a role in the development of human epidermal tumor development as well.
Preprocessed results where loaded into the FACT system as text files containing the murine clone identifier and expression values. Using mainly information from the
Ensembl database, FACT annotation functions acquired corresponding gene names, genomic localizations, func-tional information from Gene Ontology, homologues human gene names and the genomic localization of those genes (supplement S1, complete set of annotated data). We applied different FACT analysis functions to explore the expression data (for example the TermFinder function to search for enriched functional groups of genes, figure 5). The function SimpleCount was used to search for enriched functional categories of annotations. Using the information of homologues genes, we were able to iden-tify the human chromosomal band 1q21, as a region of accumulated differentially expresses genes in murine skin cancer formation (figure 4). The visual representation of the loci using the ChromPlot function highlights these findings (figure 6). With the MedLiner module we were to confirm that several regulated genes were collectively mentioned in previous publications (figure 7). A number of genes (S100A3, S100A6, S100A8, S100A9) which are part of the S100 family of calcium-binding proteins are involved in the regulation of AP-1 and NFκB-dependent transcription. Using FACT we were able to focus our anal-ysis and to gain understanding of the relevance of the results from the microarray study. With the application, it was possible to find human homologues of the murine tumor-associated genes and to confirm the involvement of the S100 protein family in human epidermal malignancies.
Table 2: Current data analysis and display modules
Method Name Reference Method Description
Simple Count FACT Count and display of occurrences of annotation terms
GO-Term Comparison In part from GO::TermFinder [15] Detection of significantly overrepresented GO terms in Gene List, based upon hypergeometric tail probability
MedLiner Bio::Biblio (M. Senger, EBI) List Publications with co-occurrences of terms CGH database Deutsches Krebsforschungs-zentrum, Div.
Molecular Genetics (D)
Compare CGH results to archived data goCluster goCluster, G. Wrobel, available at http://
www.bioconductor.org
Detection of significantly overrepresented GO terms (based upon Fisher's exact test) in Clusters built with k-means algorithm Hypergeometric Tail In part from GeneMerge [14] Detection of significantly overrepresented
terms of any kind, based upon hypergeometric tail probability
CGH – Expression Comparison FACT Detect correlation between genomic and expression data sets, based on two-sided T-Tests
Chromosomal Plot FACT Display values or occurrences in genomic context
Comparison to and inclusion of other tools
There are several large-scale database projects that incor-porate an immense spectrum of information about genes and gene product (Ensembl, euGene, LocusLink/EntrezGene, etc.). The Ensembl project for example also allows the user to display his own selected data sources in the context of the full genome annotation through the Distributed Annotation System [19], and it offers the possibility of min-ing the data of several genomes usmin-ing the EnsMart soft-ware [20]. FACT uses Ensembl, LocusLink/EntrezGene and
euGene data and complements them with other annota-tion resources; it allows the user to apply different analysis functions on the combined data.
Recently, a variety of computational tools have been introduced to aid in the interpretation of results, some of which are of interest concerning FACT. The majority of the programs use GO annotations to gain an interpretation of gene expression data. OntoExpress [13] was introduced in 2002 and offers the options to use hypergeometric, chi-square, binomial and Fischer's exact test to score annota-tion term derived from gene lists. It also allows the appli-ance of different methods (False Discovery Rate (FDR), Bonferroni, Holm, Sidak) for the multiple experiment correction [17]. The program can also include KEGG path-way information and chromosomal localization and is now part of the Onto-Tools collection to offer further
Application of the FACT system for the functional analysis of microarray data of the development of non-melanoma skin can-cer (SimpleCount function)
Figure 4
Application of the FACT system for the functional analysis of microarray data of the development of non-melanoma skin cancer (SimpleCount function). Occurrences of annotation terms are counted and displayed to draw the researchers attention to potentially characteristic features of the data set. In this case the genomic bands at 1q21 seem to play an important role in the experiment.
functionality [21]. EASE [16]/ DAVID [22] offer a broad variety of annotation options in their latest version including all major database identifiers, protein domain and pathway information. The Fisher's exact test is used for the detection of enriched terms. GoMiner [23] and numerous other tools listed at the GO website [24] can be used for the annotation of gene lists with GO terms. Gen-eMerge [14] uses the hypergeometric tail probability with Bonferroni correction to test GO terms, genomic localiza-tions and KEGG pathway information and is used in parts within the FACT system. FACT uses the available Perl code of GO::TermFinder [15] for the GO annotation and the detection of significantly overrepresented terms using the FDR. It also includes a function combining K-means clus-tering and Fisher's exact test. GEPAS [25] and GECKO [26] are two recently introduced large software packages that include functional analysis and visualization steps. In contrast to FACT they are focused on the initial statistical evaluation and on the analysis of gene expression micro-array data. GFINDer [27] is a system that offers annota-tions on GO, pathway information, protein domains and genetic disorders. It analyses with count functions and
appropriate tests (Hypergeometric, Binomial, Fisher's, Z or Poisson Test).
This list of available tools is far from complete and not all aspects are covered. The FACT system was developed with the focus to include and extend the functionality of tools like these. To our knowledge, the individual programs do not offer the same degree of flexibility and openness to different data sources and analysis methods. New func-tions can be added to FACT by simply uploading the respective module. The system is designed as an open framework for the explorative analysis using a variety of methods on annotational data. It is not restricted to or focused on Gene Ontology-based interpretation or the analysis of gene expression data alone and should facili-tate the development and application of new analysis approaches. The system is constantly being extended to include additional aspects. With the submission as an open-source project we want to encourage other research-ers to participate in this development.
Application of the FACT system in non-melanoma skin cancer research (GoTerm function) Figure 5
Application of the FACT system in non-melanoma skin cancer research (GoTerm function). Overrepresented terms from a Gene Ontology annotation are displayed in a chart. The usage of the GO system is the most common approach for the functional interpretation of gene lists.
Conclusion
To gain a more complete picture of results obtained from high-throughput experiments such as DNA-microarrays, automated procedures are required for annotation and analysis. At the same time it is usually a matter of testing and not known beforehand, which of the possible approaches for the functional analysis will be the most informative or appropriate. The Flexible Annotation and Correlation Tool offers the flexibility to integrate and com-pare annotation data and different algorithms in one environment by using a unified data basis. Data sets of different nature and format can be incorporated, diverse analytical algorithms can be applied and the user can add his own data integration and analysis functions. As a flex-ible framework for the explorative meta-analysis of
genomic, proteomic or other experiments, FACT can help with the task of analyzing the biological complexity, allowing researchers to bridge gaps between different kinds of experiments and acquiring a more complete interpretation of large-scale experiments.
Availability and requirements
- Project name: Flexible Annotation and Correlation Tool (FACT).
- Project home page: http://www.factweb.de - Operating system: tested on Linux SUSE 9.1 - Programming language: Perl (5.8.1)
Application of the FACT system in non-melanoma skin cancer research (ChromPlot function) Figure 6
Application of the FACT system in non-melanoma skin cancer research (ChromPlot function). Visual representa-tion of the genomic distriburepresenta-tion of analyzed features highlights the involvement of the genomic band 1q21 (first 5 chromo-somes shown). In this case the localization of human homologues genes corresponding to murine clones over- and under expressed in squamous cell carcinoma are displayed.
- Other requirements: MySQL database (4.0.15); for spe-cific modules: R (1.8.0 with RSPerl) and Bioconductor (1.4.0); for full installation: Apache web-server (apache2-prefork-2.0.48); additional Perl modules: BioPerl (1.2.1), Ensembl (currently 28). Please refer to website for full listing.
- License: Open Source GNU GPL (see licence document) - Any restrictions to use by non-academics: written licence needed
Abbreviations
API – application programming interface, CGH – compar-ative genomic hybridization, FACT – Flexible annotation and correlation tool, GO – Gene Ontology, ISCN – inter-national system for human cytogenetic nomenclature
Authors' contributions
FK designed and implemented the FACT system and the web-interface, ND re-designed and extended it, GW
helped with the initial design and supplied R-modules, LH carried out the microarray experiments and supplied additional ideas, GT conducted the integration into other analysis systems, PL supervised the FACT project. All authors read and approved the final manuscript.
Acknowledgements
We are grateful for the contributions of Regina Mueller, Jochen Hess and Peter Angel within the non-melanoma skin cancer project and the helpful comments from Anja Kolb-Kokocinski and Imre Vastrik. The FACT project was supported by grants from the German Ministry for Education and Research (NGFN 01 GR 0101, NGFN 01GR 0417 and NGFN 01GR 0418).
References
1. Mangalam H, Stewart J, Zhou J, Schlauch K, Waugh M, Chen G, Farmer AD, Colello G, Weller JW: GeneX: An Open Source gene expression database and integrated tool set. IBM Sys-tems J 2001, 40(2):.
2. GeneOntology Consortium: Creating the gene ontology resource: design and implementation. Genome Res 2001,
11:1425-33.
3. Joshi-Tope G, Gillespie M, Vastrik I, D'Eustachio P, Schmidt E, de Bono B, Jassal B, Gopinath GR, Wu GR, Matthews L, Lewis S, Birney E, Stein L: Reactome: a knowledgebase of biological pathways.
Nucleic Acids Res 2005, 33:D428-32.
Application of the FACT system in non-melanoma skin cancer research (MedLiner function) Figure 7
Application of the FACT system in non-melanoma skin cancer research (MedLiner function). FACT's simple auto-mated literature screen function displays publications mentioning groups of genes identified in the study (top 5 hits shown).
Publish with BioMed Central and every scientist can read your work free of charge "BioMed Central will be the most significant development for disseminating the results of biomedical researc h in our lifetime."
Sir Paul Nurse, Cancer Research UK Your research papers will be:
available free of charge to the entire biomedical community peer reviewed and published immediately upon acceptance cited in PubMed and archived on PubMed Central yours — you keep the copyright
Submit your manuscript here:
http://www.biomedcentral.com/info/publishing_adv.asp
BioMedcentral
4. FACT website [http://www.factweb.de]
5. Gentleman RC, Carey VJ, Bates DM, Bolstad B, Dettling M, Dudoit S, Ellis B, Gautier L, Ge Y, Gentry J, Hornik K, Hothorn T, Huber W, Iacus S, Irizarry R, Leisch F, Li C, Maechler M, Rossini AJ, Sawitzki G, Smith C, Smyth G, Tierney L, Yang JY, Zhang J: Bioconductor: open software development for computational biology and bioinformatics. Genome Biol 2004, 5(10):R80.
6. RSPerl [http://www.omegahat.org]
7. Stajich JE, Block D, Boulez K, Brenner SE, Chervitz SA, Dagdigian C, Fuellen G, Gilbert JGR, Korf I, H Lapp, Lehvaslaiho H, Matsalla C, Mungall CJ, Osborne BI, Pocock MR, Schattner P, Senger M, Stein LD, Stupka E, Wilkinson MD, Birney E: The Bioperl toolkit: Perl mod-ules for the life sciences. Genome Res 2002, 12(10):1611-1618. 8. Hubbard T, Barker D, Birney E, Cameron G, Chen Y, Clark L, Cox T,
Cuff J, Curwen V, Down T, Durbin R, Eyras E, Gilbert J, Hammond M, Huminiecki L, Kasprzyk A, Lehvaslaiho H, Lijnzaad P, Melsopp C, Mongin E, Pettett R, Pocock M, Potter S, Rust A, Schmidt E, Searle S, Slater G, Smith J, Spooner W, Stabenau A, Stalker J, Stupka E, Ureta-Vidal A, Vastrik I, Clamp M: The Ensembl genome database project. Nucleic Acids Res 2002, 30(1):38-41.
9. Standing Committee on Human Cytogenetic Nomenclature: An International System for Human Cytogenetic Nomencla-ture (1985). Birth Defects Orig Artic Ser 1985, 21(1):1-117. 10. Gilbert DG: euGenes: a eukaryote genome information
system. Nucleic Acids Res 2002, 30:145-148.
11. Becker KG, White SL, Muller J, Engel J: BBID: the biological bio-chemical image database. Bioinformatics 2000, 16(8):745-6. 12. von Mering C, Huynen M, Jaeggi D, Schmidt S, Bork P, Snel B:
STRING: a database of predicted functional associations between proteins. Nucleic Acids Res 2003, 31(1):258-61. 13. Khatri P, Draghici S, Ostermeier GC, Krawetz SA: Profiling gene
expression using Onto-express. Genomics 2002, 79(2):266-70. 14. Castillo-Davis CI, Hartl DL: GeneMerge – post-genomic
analy-sis, data mining, and hypothesis testing. Bioinformatics 2003,
19(7):891-2.
15. Boyle EI, Weng S, Gollub J, Jin H, Botstein D, Cherry JM, Sherlock G:
GO::TermFinder – open source software for accessing Gene Ontology information and finding significantly enriched Gene Ontology terms associated with a list of genes. Bioinfor-matics 2004, 20(18):3710-5.
16. Hosack DA, Dennis G Jr, Sherman BT, Lane HC, Lempicki RA: Iden-tifying biological themes withing lists of genes with EASE.
Genome Biol 2003, 4(10):R70.
17. Draghici S, Khatri P, Martins RP, Ostermeier GC, Krawetz SA: Glo-bal functional profiling of gene expression. Genomics 2003,
81(2):98-104.
18. DiGionvanni J: Multistage carcinogenesis in mouse skin. Phar-macol Ther 1992, 54:63-126.
19. Dowell RD, Jokerst RM, Day A, Eddy SR, Stein L: The distributed annotation system. BMC Bioinformatics 2001, 2(1):7.
20. Kasprzyk A, Keefe D, Smedley D, London D, Spooner W, Melsopp C, Hammond M, Rocca-Serra P, Cox T, Birney E: EnsMart: a generic system for fast and flexible access to biological data. Genome Res 2004, 14:160-9.
21. Khatri P, Bhavsar P, Bawa G, Draghici S: Onto-Tools: an ensemble of web-accessible, ontology-based tools for the functional design and interpretation of high-throughput gene expres-sion experiments. Nucleic Acids Res 2004, 32:W449-56.
22. Dennis G Jr, Sherman BT, Hosack DA, Yang J, Gao W, Lane HC, Lem-picki RA: DAVID: Database for Annotation, Visualization, and Integrated Discovery. Genome Biol 2003, 4(5):P3.
23. Zeeberg BR, Feng W, Wang G, Wang MD, Fojo AT, Sunshine M, Nar-asimhan S, Kane DW, Reinhold WC, Lababidi S, Bussey KJ, Riss J, Bar-rett JC, Weinstein JN: GoMiner: A Resource for Biological Interpretation of Genomic and Proteomic Data. Genome Biol 2003, 4(4):R28.
24. Gene Ontology website [http://www.geneontology.org] 25. Herrero J, Vaquerizas JM, Al-Shahrour F, Conde L, Mateos A,
Diaz-Uriarte JS, Dopazo J: New challenges in gene expression data analysis and the extended GEPAS. Nucleic Acids Res 2004,
32(Web Server):W485-W491.
26. Theilhaber J, Ulyanov A, Malanthara A, Cole J, Xu D, Nahf R, Heuer M, Brockel C, Bushnell S: GECKO: a complete large-scale gene expression analysis platform. BMC Bioinformatics 2004, 5(1):195.
27. Masseroli M, Martucci D, Pinciroli F: GFINDer: Genome Function INtegrated Discoverer through dynamic annotation, statisti-cal analysis, and mining. Nucleic Acids Res 2004, 32:W293-300. 28. Lennon G, Auffray C, Polymeropoulos M, Soares MB: The
I.M.A.G.E. Consortium: an integrated molecular analysis of genomes and their expression. Genomics 1996, 33(1):151-2. 29. Strausberg RL, Buetow KH, Emmert-Buck M, Klausner R: The
Can-cer Genome Anatomy Project: building an annotated gene index. Trends in Genetics 2000, 16:103-106.
30. Pruitt KD, Katz KS, Sicotte H, Maglott DR: Introducing RefSeq and LocusLink: curated human genome resources at the NCBI. Trends Genet 2000, 16(1):44-7.
31. Blake JA, Richardson JE, Bult CJ, Kadin JA, Eppig JT, the members of the Mouse Genome Database Group: MGD: The Mouse Genome Database. Nucleic Acids Res 2003, 31:193-195.