FINANCIAL LIBERALISATION AND ECONOMIC GROWTH IN SOUTH AFRICA
By
HLANGANANI SIQONDILE SIBANDA (200705906)
A dissertation submitted in fulfilment of the requirements for the degree
MASTER OF COMMERCE In
ECONOMICS
UNIVERSITY OF FORT HARE
FACULTY OF MANAGEMENT AND COMMERCE DEPARTMENT OF ECONOMICS
SOUTH AFRICA December, 2012
ii | P a g e
ABSTRACT
This study examined the impact of financial liberalisation on economic growth in South Africa. The study used quarterly time series data for the period 1980 to 2010. A vector error correction model was used to determine the short run and long run effects of financial liberalisation on economic growth in South Africa. The other explanatory variables considered in this study were government expenditure, investment ratio, public expenditure on education and trade openness. Results from this study revealed that financial liberalisation, government expenditure and public expenditure on education have a positive impact on economic growth while trade openness negatively affects economic growth in South Africa. Policy recommendations were made using these results.
iii | P a g e
DECLARATIONS
On copyright
I, the undersigned, SIBANDA, HLANGANANI S. student Number 200705906, hereby declare that the dissertation is my own original work, and that it has not been submitted, and will not be presented at any other University for a similar or any other degree award.
Date: ………
Signature: ………
On plagiarism
I, SIBANDA, HLANGANANI S., student number 200705906 hereby declare that I am fully
aware of the University of Fort Hare’s policy on plagiarism and I have taken every precaution to comply with the regulations.
Signature: ...
On research ethics clearance
I, SIBANDA, HLANGANANI S., student number 200705906 hereby declare that I am fully
aware of the University of Fort Hare’s policy on research ethics and I have taken every precaution to comply with the regulations. I have obtained an ethical clearance certificate from the University of Fort Hare’s Research Ethics Committee and my reference number is the following: ...N/A...
iv | P a g e
ACKNOWLEDGEMENTS
My profound gratitude goes to my supervisor Professor Asrat Tsegaye for his invaluable advice, guidance and impeccable supervision. When I faltered he was there to offer a lifeline, has been very patient and prompt with his editing, commentary and contributions. Thank you Prof for your commitment, encouragement and all other sacrifices that you have had to make towards the completion of this dissertation.
I would also like to thank my father for planting the seed of academic excellence. It is his wisdom and support that has inspired me constantly and encouraged me to realise this dream. There are other people who have contributed significantly towards the production of this dissertation. My heartfelt gratitude is extended to all of you. Special mention goes to Syden Mishi for always being available for guidance. He has remained a true friend and colleague! My family has also been a pillar of support and encouragement when the going got steep. Thank you for lending an ear when I needed to vent my frustrations and for believing in me. I am forever indebted to you for being a source of inspiration, motivation and encouragement when I was in doubt.
This treatise is dedicated to my lovely mother Darnely Mahwaya-Sibanda and my remarkable father Coghlan Sibanda.
v | P a g e
TABLE OF CONTENTS
ABSTRACT ... ii DECLARATIONS ... iii ACKNOWLEDGEMENTS ... iv TABLE OF CONTENTS ... vLIST OF FIGURES ... vii
LIST OF TABLES ... vii
ACCRONYMS AND ABBREVIATIONS ... viii
CHAPTER ONE ... 1
INTRODUCTION ... 1
1.1. Background of the study ... 1
1.2. Problem statement ... 2
1.3. Objectives... 3
1.4. Hypothesis ... 3
1.5. Justification of the study ... 3
1.6. Organisation of the study ... 4
CHAPTER 2 ... 6
AN OVERVIEW OF THE SOUTH AFRICAN FINANCIAL SYSTEM AND FINANCIAL LIBERALISATION POLICIES ... 6
2.1. Introduction ... 6
2.2. The structure and functions of the South African financial system... 7
2.3. Evolution of financial liberalisation in South Africa ... 15
2.4. The pre-reform period in South Africa... 15
2.5. Financial liberalisation reform in South Africa ... 19
2.6. Pace of the liberalisation process ... 26
2.7. Economic growth ... 27
2.8. Monetary policy in a liberalised financial system ... 29
2.9. Conclusion ... 29
CHAPTER 3 ... 31
LITERATURE REVIEW ... 31
vi | P a g e
3.2. Theoretical literature ... 31
3.2. Empirical literature ... 41
3.4. Assessment of literature and conclusion ... 51
CHAPTER 4 ... 53 RESEARCH METHODOLOGY ... 53 4.1. Introduction ... 53 4.2. Model Specification ... 53 4.3. Definition of Variables ... 54 4.4. Data sources ... 56 4.5. Estimation Techniques ... 56 4.6. Conclusion ... 70 CHAPTER 5 ... 72
PRESENTATION AND ANALYSIS OF EMPIRICAL FINDINGS ... 72
5.1. Introduction ... 72
5.2. Empirical Findings ... 72
5.3. Vector Error Correction Modelling ... 82
5.4. Diagnostic checks ... 86
5.5. Impulse response and variance decomposition ... 90
5.6. Granger causality tests ... 93
5.7. Summary and conclusion ... 95
CHAPTER 6 ... 96
SUMMARY, CONCLUSIONS, POLICY IMPLICATIONS AND RECOMMENDATIONS ... 96
6.1. Summary of the study and conclusion ... 97
6.2. Policy implications and recommendations ... 98
6.3. Limitations of the study and areas of further research ... 100
LIST OF REFERENCES ... 101
vii | P a g e
LIST OF FIGURES
Figure 2.1: Structure of the financial system in South Africa...8
Figure 2.2: South African financial markets...11
Figure 2.3: Interest rate in South Africa (1980-2010)...20
Figure 2.4: Bank credit to the private sector in South Africa (1980-2010)...21
Figure 2.5: Number of players within the banking sector (1994-2010)...23
Figure 2.6: GDP per capita growth in South Africa (1980-2010)...28
Figure 2.7: Financial sector contribution to GDP at market prices (1993-2010)...29
Figure 3.1: Effects of financial repression and financial liberalisation...37
Figure 5.1: Unit root test - Graphical analysis at levels...74
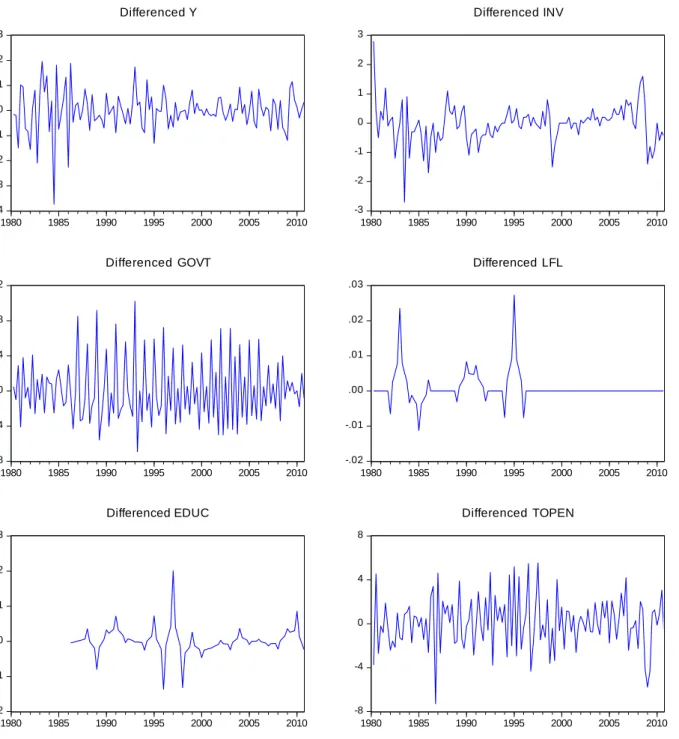
Figure 5.2: Unit root test – Graphical analysis at first difference...75
Figure 5.3: Co-integration graphs...83
Figure 5.4: AR Roots graph...88
Figure 5.5: Impulse Response...92
LIST OF TABLES
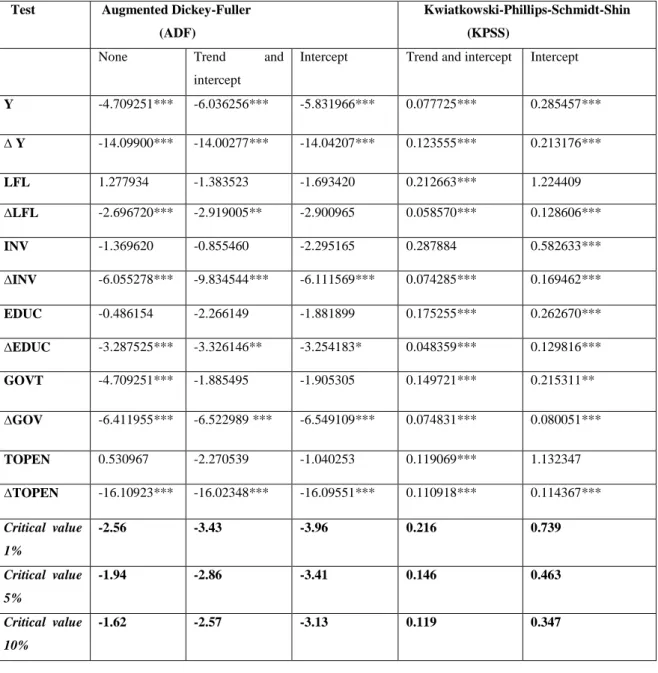
Table 2.1: Summary of the financial liberalisation process in South Africa...26Table 5.1: Unit root/Stationarity test...76
Table 5.2: VAR lag order selection criteria...79
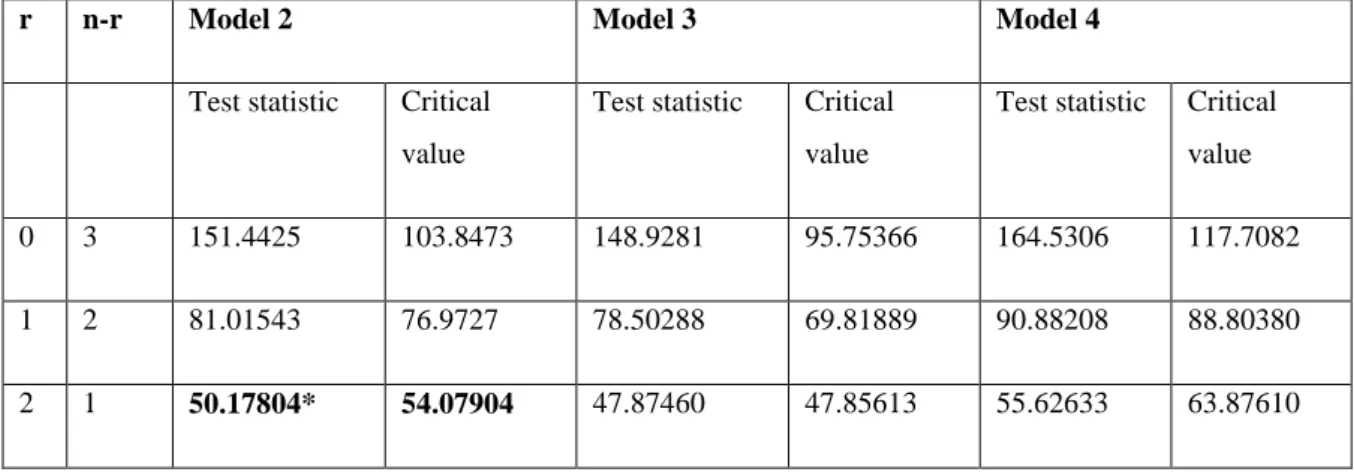
Table 5.3: Pantula principle test results...80
Table 5.4: Co-integration rank test...81
Table 5.5: VECM Co-integrating equation test results...84
Table 5.6: Vector Error Correction Model...86
Table 5.7: Autocorrelation LM test...89
Table 5.8: Heteroskedasticity test results...90
Table 5.9: Residual Normality test results...90
Table 5.10: Variance decomposition...93
viii | P a g e
ACCRONYMS AND ABBREVIATIONS
JSE – Johannesburg Stock Exchange SABE – South African Bond Exchange
OECD -Organisation for Economic Co-operation and Development SARB – South African Reserve Bank
CPD – Corporation for Public Deposits LAB – Land and Agricultural Bank
ABSA - Amalgamated Bank of South Africa PIC – Public Investment Commissioners
SBDC – Small Business Development Corporation IDC – Industrial Development Corporation
BESA – Bond Exchange of South Africa EFT – Electronic Funds Transfer
POS – Point of Sale
ATM – Automated Teller Machine IMF – International Monetary Fund GDP – Gross Domestic Product BSD – Bank Supervision Department
BCBS – Basel Committee on Banking Supervision WTO – World Trade Organisation
SSA – sub-Saharan Africa EU – European Union
FDI – Foreign Direct Investment
COSATU -Congress of South African Trade Union GEAR – Growth, Equity and Redistribution
LDC - Less Developed Countries
AREAR – Annual Report on Exchange Arrangements and Exchange Restrictions GMM - Generalised Method of Moment
VECM – Vector Error Correction Model VAR - Vector Auto-Regression
ADF – Augmented Dickey Fuller
KPSS–Kwiatkowski, Phillips, Schmidt and Shin OLS – Ordinary Least Squares
1 | P a g e
CHAPTER ONE
INTRODUCTION
1.1. Background of the study
The process of financial liberalisation was made popular by McKinnon and Shaw in their 1973 publications (McKinnon (1973) and Shaw (1973)). It has since become a widespread phenomenon globally, with most African countries implementing it in the early 1990s (Calitz, 2002). Financial liberalisation refers to the opening up of a country’s financial system. This process is in essence the removal of government's control over the interest rates, banks' credit policies, ownership structure and international capital mobility. According to Causevic (2003), full implementation of financial liberalisation occurs when the following measures are in place: removing government's control over credit policy of banks; removing government's control over interest rates; free entry to the banking sector; autonomy of banks; private ownership of commercial banks and other financial institutions; removing government's control over international capital flows.
The process of financial liberalisation started in the early seventies following the theoretical approach initiated by McKinnon (1973) and Shaw (1973) which favoured financial liberalisation against financial repression. Empirical literature presents two conflicting views on the financial liberalisation – growth nexus. From one point of view, financial liberalisation leads to more efficient credit allocation which increases investment and ultimately economic growth. According to Tswamuno, Pardee and Wunnava, (2007); Bekaert, Harvey and Lundblad, (2005) and King and Levine, (1993), liberalisation of the capital market encourages better corporate governance and investor protection which promotes financial development and therefore economic growth. On the other hand, some researchers find a negative relationship between openness and growth. Financial liberalisation encourages excessive risk-taking behaviour which increases macroeconomic volatility (and thus increases the chances of a financial crisis) which has a negative effect on economic growth (Rousseau and Wachtel, 2007).
2 | P a g e According to Calitz (2002), South Africa’s route to financial liberalisation started in 1980. However, South Africa formally enhanced its domestic financial liberalisation efforts after the democratic election in 1994.In South Africa, this policy was implemented to stimulate economic growth (Tswamuno et al., 2007).Policies such as financial liberalisation were expected to improve the efficiency of resource allocation which then ameliorates the rate of economic growth. The financial liberalisation efforts have taken the form of (though not limited to) the abolition of the financial rand system, enhanced market entry, development of new markets, introduction/development of new financial instruments, continuous deregulation of the Johannesburg Stock Exchange (JSE) and the South African Bond Exchange (SABE), replacement of Bank rate with a more market related repo rate (see Calitz, 2002). Economic reform in South Africa has taken a gradualist stance rather than a rapid transformation undertaken by other countries like Russia, Poland and Bolivia (Gillis et al; 1996 in Calitz; 2002).
1.2. Problem statement
There has been a significant amount of research that has been conducted on the effects of financial liberalisation on economic growth albeit with conflicting results. Some issues to explain the conflicting results have arisen through these researches, for example, the prerequisites and conditions for implementing financial liberalisation and the sequencing of economic reforms. However, although a number of empirical studies have been conducted on the financial liberalisation-growth nexus, most of these studies have concentrated on Asian and Latin American studies. Thus, there is a deficiency of empirical literature on financial liberalisation and growth in Africa and particularly in South Africa.
The financial liberalisation theory states that financial liberalisation leads to a faster and positive economic growth via an increase in interest rate which leads to an increase in savings and ultimately a rise in investment. Financial repression in the form of interest rate ceilings results in low interest rates which are transferred to low savings and consequently low investment. Notwithstanding the potential benefits that financial liberalisation brings, there are some challenges that it poses as well such as increasing financial fragility which makes the economy susceptible to financial crises (Rousseau and Wachtel, 2007). While some
3 | P a g e countries like Pakistan have recorded success stories, others like European Union (EU) acceding countries have not experienced economic growth, others like the Latin American countries have only reaped the benefits for a short while, and some, for example Malaysia, have experienced crises and recessions following financial liberalisation.
Given that financial liberalisation theory states that competitive and efficient markets lead to a positive and greater economic growth, it is important to evaluate the effect that it has had in South Africa. Has financial liberalisation been beneficial to South Africa? Has it been a case where the benefits are reaped in the short run but followed with long run suffering? What policy lessons arise from the South African experience?
1.3. Objectives
This study seeks to empirically establish the impact of financial liberalisation policies on economic growth in South Africa. In this quest, the study will also pursue the following specific objectives:
Critically review the financial liberalisation and the associated economic growth processes
Empirically test for the short run and long run impact of financial liberalisation on economic growth
Test for the causal relationship between financial liberalisation and economic growth Based on the empirical results determine the policy implications of the study findings.
1.4. Hypothesis
The hypotheses to be tested are that:
1. Financial liberalisation has a positive impact on growth in both the short run and long run.
2. Financial liberalisation leads to economic growth.
1.5. Justification of the study
Financial liberalisation in South Africa was implemented in order to foster economic growth. This study seeks to evaluate to what extent this goal has been achieved. When the reform process was put in to effect, there was an influx of capital (Pretorius, 2002). Ahmed, Arezki and Funke (2007) suggest that further trade and capital control liberalisation would increase
4 | P a g e the share of foreign direct investment (FDI) in South Africa. However, COSATU has recently called for a consideration to increase capital controls. As aforementioned, literature has not managed to settle the dispute on the effects of financial liberalisation on economic growth. It is against this background coupled with COSATU’s recent sentiments that this study seeks to resolve the dispute for South Africa and hence provide policy insights on the direction of future reform.
According to Fratzscher and Bussiere (2004), an important reason why there has been no robust model for the relationship between openness and growth is the presence of a time-varying relationship between openness and growth over time. This implies that there may be a trade off that occurs across time in that countries tend to gain in the short run due to an investment boom and influx of capital, but may not grow faster or even experience growth reversals in the long run. This study seeks to empirically test for such a relationship between financial liberalisation and economic growth in South Africa. South African studies have only addressed the issue of the impact of financial liberalisation on economic growth (see Tswamuno, et al 2007). A study that investigates the short run and long run effects of openness on growth will improve on previous empirical research and thus augment policy formulation.
South Africa is the economic powerhouse of Africa and is thus an engine of growth in sub-Saharan Africa. South African growth has a substantial positive impact on growth in the rest of Africa as shown by Arora and Vamvakidis (2005) hence investigating South African growth is not important only for the country but has implications for other countries as well.
1.6. Organisation of the study
This study will be structured as follows:
Chapter 1 gives an introduction to the study. This chapter also discusses the research objectives and the rationale for the research.
5 | P a g e Chapter 2 will provide an overview of the South African economy with particular reference to the financial liberalisation process and economic growth.
Chapter 3 will review theoretical and empirical literature. This chapter will provide an evaluation of the different methods used to assess the impact of financial liberalisation and the results of various studies.
Chapter 4 will outline the methodology to be used in the study. It will discuss the formulation and specification of the model as well as the data analysis.
In chapter 5, the regression results, economic interpretation and model robustness checks will be discussed.
6 | P a g e
CHAPTER 2
AN OVERVIEW OF THE SOUTH AFRICAN FINANCIAL SYSTEM AND
FINANCIAL LIBERALISATION POLICIES
2.1. Introduction
South Africa is the economic hub of southern Africa. It has abundant natural resources, well developed financial, transport, legal and communication sectors. Its stock exchange is rated among the top 20 in the world in terms of capitalisation. The economy of South Africa has implications not only for itself, but for other countries in the continent as well. The economy has undergone profound structural reform over the years, including financial liberalisation (Calitz, 2002).
Economic literature has provided ample evidence that the improvement in financialsystems contributes to an increase in efficient resource allocation and hence growth (Djoumessi, 2009). In an effort to develop an efficient and competitive financial system to facilitate economic growth, many countries have undertaken the liberalisation of financial services and structural reform of the financial services sector (Bayraktar and Wang, 2005). The degree of financial liberalisation differs from country to country but has generally increased in the 1990s (particularly in Africa).
This chapter will provide an overview of the South African financial system (structure and functions) and the financial liberalisation process. According to Ergungor (2003), the structure of a financial system affects economic growth. Other authors (seefor example, Rajan and Zingales, (1998); Beck et al., (2000); Levine et al., (2000); Beck et al., (2001); LaPorta et al., (2002); and Levine, (2002)) find that the overall level of development of the financial system is the major proponent of long-run economic growth. This chapter will thus review the structure, functions and developments of the financial system in South Africa. It is also important to evaluate the financial liberalisation and growth processes in South Africa. Thus, another section is dedicated to the discussion of pre-reform and the reform (financial liberalisation) process. The third section will outline the economic growth experience of South Africa. A brief discussion of monetary policy post financial liberalisation is provided followed by a conclusion of the chapter with a few comments.
7 | P a g e
2.2. The structure and functions of the South African financial system
In Fourie, Falkena and Kok (1999), a financial system is defined as a set of arrangements embracing the lending and borrowing of funds by non-financial economic units and the intermediation of this function by financial institutions to facilitate the transfer of funds, to provide additional money when required and to create markets in debt instruments so that the price and allocation of funds are determined efficiently. Essentially, a financial system increases efficiency in the allocation of funds. Without financial intermediaries, there is a problem of information asymmetry which exists when one party of the transaction may possess superior information than the other party and this leads to an inefficient allocation of funds. Thus, the financial system stimulates economic growth by influencing the allocation of financial resources and the performance of economic players.
The financial system of South Africa has undergone marked changes since the 1970s (Fourieet.al; 1999). The speed of change was accelerated by the re-admission of South Africa into the global markets after 1994. These changes have been brought about by the monetary authorities and the private financial sector as a result of the liberalisation of financial markets. South Africa’s financial system consists of financial institutions, financial markets and payments systems. Figure 2.1 shows the structure of the South African financial system.
8 | P a g e Figure 2.1: Structure of the financial system in South Africa
Source: Fourie, Falkena and Kok (1999)
FINANCIAL SYSTEM FINANCIAL INSITUTIONS DEPOSIT INTERMEDIARIES 1. South African Reserve Bank (SARB) 2. Corporation for Public Deposits (CPD) 3. Land and Agricultural Bank (LAB) 4. Private sector banks 5. Postbank 6. Mutual banks NON-DEPOSIT INTERMEDIARIES Contractual Intermediaries
1. Retirement funds (provident and pension funds)
2. Insurance companies (short and long term insurers)
3.Public Investment Commissioners (PIC)
Portfolio Investments
1. Unit trusts 2. Private equity funds
3. Hedge funds
4. Participation Mortgage Bond Schemes
Development Agencies
1. Finance Houses 2. Small Business Development
Corporation (SBDC) 3. Industrial Development Corporation (IDC) 4. Securitisatisation vehicles 5. Micro lenders 6. Investment trusts/companies FINANCIAL MARKETS Payments system
9 | P a g e 2.2.1. Financial institutions
Financial institutions are the key players in the financial markets as they perform the function of intermediation and thus determine the flow of funds. Financial intermediation is a productive activity in which an institutional unit incurs liabilities on its own account for the purpose of acquiring financial assets by engaging in financial transactions on the market (OECD, 2003). The role of financial intermediaries is to channel funds from lenders to borrowers by intermediating between them. These financial institutions can be classified into two broad categories: deposit and non deposit intermediaries.
a) Deposit intermediaries
The deposit intermediaries consist mainly of banks, that is, South African Reserve Bank (SARB), commercial banks, mutual banks, Postbank, Land and Agricultural Bank (LAB) and the Corporation for Public Deposits (CPD). This subdivision can thus be referred to as the banking sector and it is the domineering component in the South African financial system. This is evidenced by the banking system accounting for about 67% of the total assets of the financial system in the second quarter of 2010and bank loans accounting for a large part of the finance sources (77 percent) in the country (Kumbirai and Webb, 2010). The roots of the banking system in South Africa are firmly entrenched in the 18th century. The first bank to be established in South Africa was the Lombaard bank in Cape Town, which opened its doors to the public on 23 April 1793. It was a state bank entrusted with the issuance of government notes. The first private bank was also established in the Cape – the Cape Of Good Hope Bank which opened in 1837. The South African Reserve Bank opened its doors in 1921.
According to the SARB, there are currently 30 registered banks in South Africa. This number consists of 10 locally controlled banks, 6 foreign controlled banks (subsidiaries), 12 local branches of foreign banks and two mutual banks. In addition, 44 international banks have authorised representative offices in South Africa. Representative offices, however, may not take deposits (SARB, 2012).
The soundness of the banking sector is important in an economy as it contributes towards confidence in a particular financial system. Banks are important institutions in an economy as they are responsible for the liquidity of the economy and they also facilitate the payments system, enabling parties to engage in financial transactions. However, banks can make the system vulnerable because the maturity of assets and liabilities is not synchronised.
10 | P a g e The South African banking system is predominated by four major commercial banks: ABSA, FirstRand, Nedbank and Standard Bank. Standard Bank is the largest bank in terms of assets, with a market share of 26 percent, followed by ABSA with 22 percent. FirstRand and Nedbank had a market share of about 19 percent and 18 percent respectively. In 1994, these groups represented 83.8 per cent of the total assets of the banking sector and in 2004 they represented 87.4 per cent of the total banking sector assets. The remaining 12.6 per cent of assets in the banking sector are currently held by the other 31 banks, excluding the two mutual banks. This means that the stability of the financial system is primarily dependent on the performance and financial strength of these banks even though South Africa is classified as a market based economy.
b) Non-deposit intermediaries
These are government or private organisations (such as a building society, insurance company, investment trust, or mutual fund or unit trust) that serve as an intermediary between savers and borrowers, but do not accept time deposits. Such institutions fund their lending activities either by selling securities (bonds, notes, stock/shares) or insurance policies to the public. Their liabilities (depending on the liquidity of the liability) may fall under one or more money supply definitions, or may be classified as near money.
According to Fourie, et al (1999), this category of financial institutions can further be split into contractual intermediaries, portfolio institutions and (various) development agencies. Contractual intermediaries are the insurance companies, pension and provident funds and Public Investment Commissioners (PIC). The portfolio institutions are the unit trusts and participation mortgage bond schemes. The development agencies include finance houses, Small Business Development Corporation (SBDC) and Industrial Development Corporation (IDC).
2.2.2. Financial Markets
The other major component of the South African financial system is the financial market. According to the functional approach, financial markets facilitate the flow of funds from surplus units to deficit units in order to finance investments by corporations, governments and individuals. South Africa boasts of a well developed financial market. The financial market can be classified according to the financial instruments.
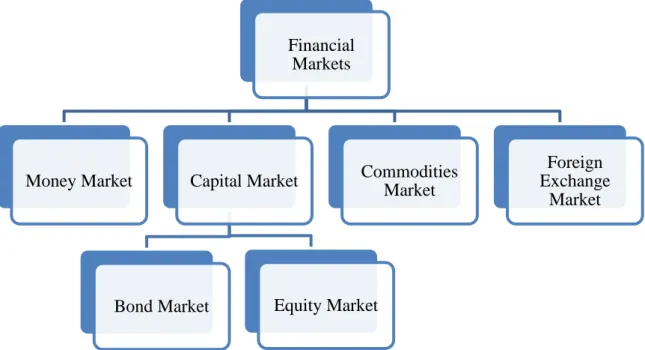
11 | P a g e The financial market in South Africa comprises four major markets namely the money market, foreign exchange market, capital market and commodities market. There is also the derivatives market which is a hybrid market. The diagram below shows the financial markets of South Africa.
Figure 2.2: South African financial markets
Source: van Zyl, Botha and Skerritt, P (2003)
a) Money market
The money market is the market for short-term interest- bearing assets with maturities of less than one year, such as treasury bills, commercial paper, and certificates of deposits. It is an environment in which entities from the household, government and business sectors (who are in need of short-term funds) meet those entities (from the same sectors) who have surplus funds, and engage in various forms of lending and borrowing (Botha, 2007). Thus, the major task of the money market is to facilitate the liquidity management in the economy. The main issuers in the money market are the government, banks and private companies, while the main investors are banks, insurance companies and pension and provident funds.
b) Capital market
The capital market is made up of the equity and bond markets. The capital market is the market for trading in assets for maturities of greater than one year, such as treasury bonds,
Financial Markets
Money Market Capital Market
Bond Market Equity Market
Commodities Market
Foreign Exchange
12 | P a g e private debt securities (bonds and debentures) and equities (shares). The main purpose of the capital market is to facilitate the raising of long-term funds. The main issuers in the capital market are the government, banks and private companies, while the main investors are pension and provident funds and insurance companies.
b (i)Equity market
The equity market is the market for the issue and trading of equities. Such issuing and trading of equities happens in the Johannesburg Stock Exchange (JSE). The JSE is Africa’s largest Stock Exchange. It is amongst the top 20 largest equities exchanges in terms of market capitalisation in the world (JSE, 2012). In terms of derivatives, the JSE is currently ranked the 20th largest exchange by the Futures Industry Association (FIA) in terms of the number of contracts traded. The product base of the JSE has also expanded to include not only shares, but also a range of equity, commodity and interest rate derivatives. Turnover on the JSE has shown strong growth over recent years, increasing from an annual turnover of R22 billion in 1992 to R1 279 billion in 2005.
b (ii) Bond market
The bond market is the mechanism/conventions that exist for the issue of, investing in and the trading of instruments that represent the long term undertakings (usually of a fixed capital nature) of the issuers (Faure, 2006). The bond market is an extension of the money market and is a market for long term debt instruments. The South African bond market is also formalised in the form of the Bond Exchange of South Africa (BESA), which was established in 1996. According to the JSE, as at December 2008, BESA had granted listing some 1,102 debt securities, issued by 100 sovereign and corporate borrowers, with a total market cap of R935 billion. Government bonds comprise around 60 per cent of the bonds listed on BESA, with the rest consisting of bonds issued by parastatals and corporates. Corporate bond issuances are currently increasing at a much faster rate than government bond issuances. The annual turnover on BESA has increased from R2.1 trillion in 1995 to a record R12.9 trillion in 2008.
c) Commodities market
The commodities market is a market where raw or primary products are exchanged. These raw commodities (big volume items like maize) are traded on regulated commodities
13 | P a g e exchanges. The commodities are exchanged for money, thus bringing this market closer to a financial market (van Zyl, Botha and Skerritt, P (2003)
d) Foreign exchange market
The foreign exchange market plays the essential role of providing the instruments or mechanics to facilitate all payments across international borders by transferring funds between parties in different countries engaging in commercial and other financial transactions with each other (du Toit, 2005). The foreign exchange market is not really a financial market, but a conduit for foreign investors into foreign financial markets. This is because lending and borrowing domestically do not take place in this market.
e) Derivative market
Derivative markets are investment markets that are geared toward the buying and selling of derivatives. Derivatives are securities or financial instruments, which get their value, or at least part of their value, from the value of another security, which is called the underlier. According to Adelegan (2009), South Africa’s derivatives market was established to further develop the financial system, enhance liquidity, manage risk and meet the challenges of globalisation. The market comprises two broad categories of derivatives, namely options and futures.
2.2.3. Payments systems
These are the systems (both paper backed and electronic) through which funds flow from one account and financial institution to another, for instance, when a customer of one bank writes a cheque to a customer of another bank. The South African National Payments system has undergone fundamental changes during the period under study. Payment systems in South Africa compare favourably with those in developed countries as far as customer services are concerned. It is mainly registered banking institutions that provide payment services to the public. There are various payments instruments in use in South Africa to purchase goods and services, to make financial investments and to transfer funds from one person to another. These instruments include cash, cheques, debit-, credit-and prepaid cards and electronic funds transfer (EFT) services. Over the years there has been a transition from the major use of cash for payments to cheques and lately electronic instruments (cards and EFT) have taken the lead. These payments systems are discussed below.
14 | P a g e 2.2.3.1 Cash payments
Cash payments are made using South African currency which consists of 5 banknote and 7 coin denominations. The legal tender is locally produced by subsidiaries of the Reserve Bank. The South Africa Bank Note Company prints all banknotes on behalf of the Bank, namely the R200, R100, R50, R20 and R10 notes. The South Africa Mint Company is responsible for minting all the coins on behalf of the Reserve Bank, namely, the R5, R2, R1, 50c, 20c, 10c and 5c coins. The value of notes and coins in circulation amounted to approximately R101billion at the end of 2011. This was an increase of about 88% from 2010.
2.2.3.2Non-cash payments i) Cheque payments
In the 1990s, cheques were the largest used instrument for making payments. This is no longer the case as cheques have been surpassed by EFT payments. The volume of cheque transactions has declined tremendously over the years. There has been a decrease in volume from 284 million to 48 million in ten years which translates to an annual decline of approximately 24% (National Treasury, 2012).
ii) Cards
The evolution of technology saw an increase in the use of debit and credit cards although 20% of the banked population still remains non-cardholders. In March 2012 Visa recorded an increase in purchases at Point of Sale (POS) with debit cards by 7% to 68%, while ATM transactions involving cash showed a slight decline (Ndhlovu, 2012). Some banks issue credit cards which are affiliated with Visa or MasterCard. An estimated 8 million credit cards and 35.2 debit cards are in circulation in South Africa. The volume of credit card transactions amounted to 140 million in 2007.
iii) Electronic instruments
An increasingly large number of people use EFT especially for payments of a regular nature. The volume of EFT transactions amounted to 616 million in 2007.
iv) Other cashless payment instruments
The Post Office provides mail orders and telegram services in respect of the transfer of money. These are especially useful for the unbanked segment of the community. Many
15 | P a g e private sector retailers provide private-label credit cards which can only be used in-house with a certain revolving credit limit.
2.3. Evolution of financial liberalisation in South Africa
This section discusses the developments of the financial system in terms of financial regulations and financial reforms. The period from 1960 to 1980 in South Africa was characterised by repressive policies which saw the government have an active role in the economy. In the 1960s, the South African economy experienced an increase in liquidity. This increase in liquidity resulted in overspending which also led to an increase in inflation and excessive credit creation (Chauhan, 2012). The monetary authorities then decided that the usual monetary policy was not absorbing the liquidity which was creating more economic problems. More direct measures were thus implemented which included interest rate controls, cash and liquidity reserve requirements, credit allocation, credit ceilings, exchange controls. These control measures had negative consequences for the economy. It was against the backdrop of low economic growth brought about by these controls that countries embarked on a structural reform largely constituting of the dismantling of these measures (financial liberalisation). It was also expected that the removal of government controls in interest rates and barriers to entry into the financial system would lead to greater competition and, therefore, lower profit margins and interest spreads (Mlachila and Chirwa, 2002).In the 1970s and 1980s the prevailing political environment caused a gradual imposition of sanctions on South Africa and the country was effectively denied access to international financial markets. Thus, South Africa was characterised by interest and exchange rate controls, cash and liquid requirements, credit ceilings and directed credit allocation. However, South Africa embarked on a reform process, particularly after 1994, to free the finance sector.
2.4. The pre-reform period in South Africa
Gupta (2005) contends that financial repression consists of three elements. Firstly, the central bank imposes high reserve and liquidity ratios on the banking sector, forcing them to hold government bonds and money. This allows the government to finance budget deficits at a low cost. Secondly, given that the government revenue cannot be extracted easily from private securities, the development of private bond and equity markets is discouraged. Finally, the banking system is characterised by interest rate ceilings to prevent competition with public sector fund raising from the private sector and to encourage low-cost investment. Thus, the regulations generally include interest rate ceilings, compulsory credit allocation and high
16 | P a g e reserve requirements. However, the years prior to 1980 were characterised by the removal of credit ceilings and thereafter the 1980s was characterised by interest rate deregulation in many countries. Therefore, currently the major form of financial repression is via obligatory reserve requirements.
In South Africa, the period from 1965 to 1980 was characterised by heavy reliance upon administrative controls such as ceilings on the extension of bank credit and deposit rate controls to restrain the growth in liquidity and aggregate spending (Gidlow, 1995). These direct administrative controls were introduced for a variety of reasons, but by the beginning of the 1980s had been discarded. The following discussion relates to the forms of financial repression in South Africa and the operation of these controls.
2.4.1. Regulation of cross-border capital movements (capital account controls) The period 1961 to 1993 was characterised by intense exchange controls in South Africa which were intended to provide some protection to the domestic economy from the adverse effects of capital flights (JSE, 2005). These capital account restrictions limited cross-border flows of capital and reduced foreign competition and overseas investment opportunities (access to foreign instruments). Mkhize and Msweli-Mbanga (2006) put forward that the exchange controls however, created many distortions in the South African economy. These exchange controls had a negative impact on the interest rates, exchange rates, financial asset and property prices. These distortions led to a mal-distribution of scarce resources thus preventing the JSE from performing its function of channelling savings into investments. Exchange controls prevented the important price mechanism of the market economy from functioning properly and cost efficiency considerations were of secondary importance (JSE, 2005). However, the birth of a democratic era brought relief to the foreign exchange market. According to Prasad and Rajan (2008), liberalisation of the capital account implies removing impediments to inflows of capital, or allowing domestic investors to invest more freely in foreign assets. South Africa took a giant leap towards relaxing exchange rate control in March 1995 by abolishing the financial Rand and reverting to a unitary exchange rate system and the gradual relaxation of other exchange control measures which facilitated easier cross-border movements in capital. The dual exchange rate system that existed before 1995 hampered the development of instruments and a market for managing and hedging currency risks. The unified system allows the Rand to find its level in a relatively competitive foreign exchange market. According to Pretorius (2002), this move was followed by a marked increase in capital flows in the succeeding months. After South Africa re-entered the global
17 | P a g e economy, there was a large build up of the official foreign reserves, increasing from about US$12 billion in 1995 to about US$49 billion in 2011. Independence also saw the removal of trade sanctions and this led to the opening of export markets which had been largely inwardly oriented.
2.4.2. Credit ceilings and Directions of credit allocation
The destabilising political events prior to the 1994 democratic election forced the monetary authorities to maintain a direct capital control. Direct credit controls in the form of credit ceilings were enforced through moral suasion. These credit ceilings were effected in the 1960s and 1970s. The central bank put in place quantitative credit controls, that is, a ceiling or upper limit on the amount of credit which banks could extend (Odhiambo, 2011). The government had directives on the directions of credit.Monetary policy induced allocation effects by favouring particular sectors, such as agriculture, exports and the government.In order to comply with the high liquid asset requirements, the banks extended more credit to the private sector. In November 1965, the authorities requested all themonetary banking institutions to restrict the total oftheir discounts and advances to the private sector excluding the LandBank to the level of such credit as at 31 March 1965. This ceiling was reduced to 92.5% of the March 1965 level in December 1966, (Gidlow, 1995).
In June 1968 this ceiling method of control was extended to certain specified investments of the banks and in August 1970 the credit ceilings were extended also to the non-monetary banks when severe competition for deposits between the various financial institutions threatened to erupt into an interest rate war. The level of the ceilings was raised from time to time, while a number of allowances were made outside the ceilings in respect of credit extended to the agricultural sector, to smaller business undertakings and for strategic purposes. In February 1976, the authorities further tightened their credit policies by re-imposing direct quantitative restrictions on bank credit to the private sector. Certain banks were experiencing problems with their credit ceilings and so the Reserve Bank decided to raise the credit ceilings applicable to banking institutions' discounts and advances and to their investments by an additional 4% in August 1979.
These measures were aimed at controlling the growth in the monetary aggregate with a view of combating inflation. The quantitative credit controls also served to facilitate commercial bank financing of the large deficits of the public sector. However, these credit ceilings were abolished in 1980.
18 | P a g e 2.4.3. Liquid asset requirement
An additional restriction on banks was the requirement to hold liquid assets - assets which can be quickly converted to cash or used in a similar way to cash.These were administered through the Banks Act of 1965. This was a period in which there was high inflation due to overspending in the economy. Thus, the banks had plenty liquid assets. The authorities increased the minimum liquid asset ratios for commercial banks to reach the permissible maxima of 40% of short term liabilities and 30% of medium term liabilities by the end of July 1965. During the first half of 1969, the liquid asset requirements were raised to 48 % in respect of the short term liabilities of all banks, while the requirement in respect of the medium term liabilities of the non-commercial banks was raised to 30 % to place it on a par with the commercial banks. These extensive rises in minimum liquid asset requirements were used to restrain bank credit to the private sector.
The liquid asset requirement enforced banks to invest in liquid assets that the SARB could alter from time to time. These assets comprised SARB notes, coin, gold coin, cash balances with the SARB and a large number of financial assets such as Treasury Bills, government stocks, bankers' acceptances and trade bills.
2.4.4. High bank reserve requirements
Cash reserve requirements were introduced in March 1968. These were pegged at 8% of short-term liabilities, interest-free with the Reserve Bank, plus an additional 7 per cent of increase in short-term liabilities, also interest-free with the Reserve Bank. The additional requirement of 7% was however, abolished in March 1971.In 1980, the effective reserve requirement was 5.3%. The cash reserve requirements were adjusted from time to time until the basic minimum reserve balance requirement (percentage) is determined as 2.5% of total liabilities and the supplementary interest-bearing cash reserve requirement of 1% of short-term liabilities was withdrawn in March 1998.
2.4.5. Deposit Rate Control
Another direct method of monetary control exercised by the Reserve Bank was that of deposit rate control. The Bank first imposed upper limits on the rate of interest payable on bank and building society deposits from March 1965 until July 1966. In December 1969, banks were and building societies were requested to maintain a maximum rate of 7% per annum on deposits. Adjustments were made from time to time to the maximum rates on the several categories of deposits and to the classes of intermediaries and liabilities subject to rate
19 | P a g e contro1 (Gidlow, 1995). Participation mortgages, building society shares and funds taken on loan or against debentures for the purpose of lending to the general public were included as from March 1972. Interbank deposits, including deposits between building societies and banks, were exempted from rate control in June 1974. Deposit rate controls were instated to ensure that home mortgage rates were not increased as interest rates increased and also to discourage competition between banks and building societies. These controls were subsequently dropped in March 1980.
2.4.6. Control over Lending Rates
Apart from deposit rates, controls were also exercised over the interest rates charged for various types of loans and credits, either on a statutory or informal basis. The clearing banks' prime overdraft rate had for many years prior to 1967 been set, by agreement with the Reserve Bank, at between 1.5% and 2% above Bank rate, and from 1967 to 1975 at between 2% and 2.5% above. The government subsidised certain interest rates in 1970 but interest rate controls were re-introduced in March 1972 (Gidlow, 1995).
The purpose of this form of control was to protect consumers, tradesmen and farmers from exploitation by moneylenders.Both direct deposit and lending rate controls measures kept the interest rates low to avoid large increases in politically sensitive interest rates and to minimise the cost of certain forms of socially desirable credit, such as building society mortgage loans and Land Bank cash credit advances (Chauhan, 2012).
2.5. Financial liberalisation reform in South Africa
In South Africa, various measures towards domestic financial market liberalisation were initiated in the 1980s (Calitz, 2002 and Misati and Nyamongo, 2011). It was after independence however, when the country embarked on a large-scale financial liberalisation in an effort to integrate the economy in the international arena. International economic sanctions, trade boycotts, disinvestment campaigns and pressures for the withdrawal of foreign loans from South Africa were repealed. The measures that have been undertaken in South Africa are discussed below:
2.5.1. Reduction of fiscal deficit
In line with the objective to stabilise the macro economy, the government announced the first in a series of budgets aimed at reducing budget deficit on 17 March 1993. Policy makers in South Africa also placed more emphasis on limiting the role of government in the economy and lowering the budget deficit as two of the policy goals of the Growth, Equity and
20 | P a g e Redistribution (GEAR) strategy as adopted in 1996. The budget deficit fell from 8.5% of GDP in 1992/93 to 1.4% in 2002 (Calitz, 2002 and Tswamuno, Pardee and Wunnava, 2007).
2.5.2. Interest rate liberalisation
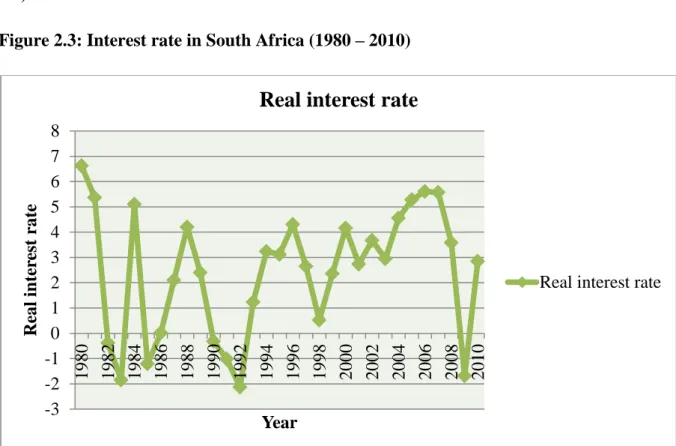
In the 1970s and 1980s, South Africa had fixed interest rates. The period of interest rate deregulation in South Africa was initiated after 1980 but gained momentum in the 1990s.Interest rates have since then been an important tool as a monetary policy tool. In South Africa interest rates were liberalised fully in 1982 whereas mortgage rates were liberalised in 1984. In the years 1982 and 1983, the real interest rate was negative (see figure 2.3).
Figure 2.3: Interest rate in South Africa (1980 – 2010)
Source: World Development Indicators
This downward trend continued until 1987. However, since 1988 interest rates have been positive, implying that no financial repression (in the form of interest ceilings) exists. Interest rates are market determined although SARB still sets the bank rate. Banks are now free to set their own deposit and lending rates and they can, in addition, decide how much credit they want to extend. In March 1998, the bank rate was replaced with a more market related repo rate. -3 -2 -1 0 1 2 3 4 5 6 7 8 1980 1982 1984 1986 1988 1990 1992 1994 1996 1998 2000 2002 2004 2006 2008 2010 Re al i n te re st rat e Year
Real interest rate
21 | P a g e
2.5.3. Reserve and liquidity requirements
The reserve and liquidity requirements were lowered in 1980 and were further lowered on more than one occasion throughout the 1980s. This created a fairer competitive environment for the financial institutions that were subject to these requirements (commercial banks) and those that were not (building societies). In the 1990s, the minimum reserve requirements to be held by banks in South Africa were changed from a fixed proportion of the value of short-term liabilities to a fixed proportion of the value of total liabilities (Nel, 2000). In March 1998, the Reserve Bank then introduced one reserve ratio of 2.5% on the total liabilities of banks, excluding issued capital and reserves. This is the current minimum reserve requirement in South Africa.
2.5.4. Abolition of Credit Ceilings and Directed Credit
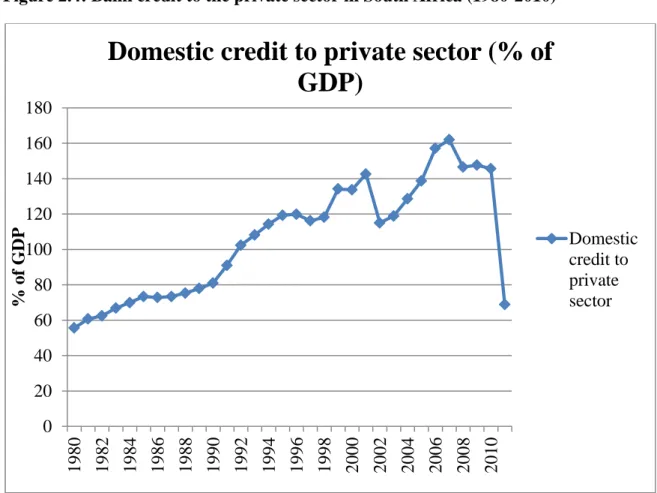
Domestic credit to private sector refers to financial resources provided to the private sector, such as through loans, purchases of non-equity securities and trade credits and other accounts receivable, that establish a claim for repayment (IMF, 2011). For some countries these claims include credit to public enterprises.
Figure 2.4: Bank credit to the private sector in South Africa (1980-2010)
Source: World Development Indicators
0 20 40 60 80 100 120 140 160 180 1980 1982 1984 1986 1988 1990 1992 1994 1996 1998 2000 2002 2004 2006 2008 2010 % of G DP
Domestic credit to private sector (% of
GDP)
Domestic credit to private sector
22 | P a g e Bank credit is an important source of finance to the private sector in South Africa. The credit controls that were imposed in 1965 were subsequently removed in 1980. Since then there has been a massive growth in the private credit extension as shown in Figure 2.4 below. Over the past 30 years bank lending to the private sector increased at a relatively high average annual rate of 17.9%. It has been on the steady increase from 56% of GDP in 1980 to 162% of GDP in 2007. There was however a decline from 2008 which is partly due to the global financial crisis. The credit extension has been on the decline since then as can be seen from the graph.
2.5.5. Strengthening of prudential regulation
The financial regulatory system in South Africa has undergone numerous changes in order to adapt to the changes in the financial system as a whole and the banking sector in particular. The purpose of prudential supervision of banks is to ensure the safety and soundness of the South African banking system and to contribute to the stability of the financial sector (de Lange and Petros, 2010). The changes that the financial regulatory system has undergone include the transfer of responsibility for banking supervision from the National Treasury (formerly the Department of Finance) to the central bank in 1987, the establishment of the Financial Services Board in 1989 and the creation of the Policy Board for Financial Services and Regulation by Act of Parliament in 1993. The Reserve Bank Act of 1989 then gave the South African Reserve Bank more autonomy and independence. The Bank Supervision Department (BSD) of the SARB is the responsible body for carrying out prudential supervision of banks. The Banks Act of 1990 provides these powers to BSD. In December 2009, the Basel Committee on Banking Supervision (BCBS) proposed a set of bank supervision reforms (Basel III) requiring banks to hold sufficient amounts of high-quality capital and liquid assets to see them through both a solvency and a funding crisis. The proposals took into account the lessons of the 2008 crisis, particularly the rapid spread of contagion from one bank to another. The bulk of the Basel III reform package should be phased in by member countries by January 2012 and the liquidity requirements over a lengthy period ending on 1 January 2019. To facilitate implementation in South Africa, the Reserve Bank has made proposals to amend the existing regulations to the Banks Act (National Treasury, 2011).
2.5.6. Deregulated entry into the financial sector
This entails, among other things, the change in the number and range of players in the financial sector, the liberalisation of scope of activities of financial institutions to enhance
23 | P a g e free entry into the market, the change in product offerings and the change in regulatory measures. There are other forces that have caused these changes in the financial sector, but the leading factor is the democratisation and the associated liberalisation of the South African economy since 1994.A number of foreign firms have entered the banking, insurance and broking markets since South Africa rejoined the world community in 1994.Between 1995 and 2000, there was enhanced bank market entry with foreign banks being allowed to open branches in South Africa in 1995.
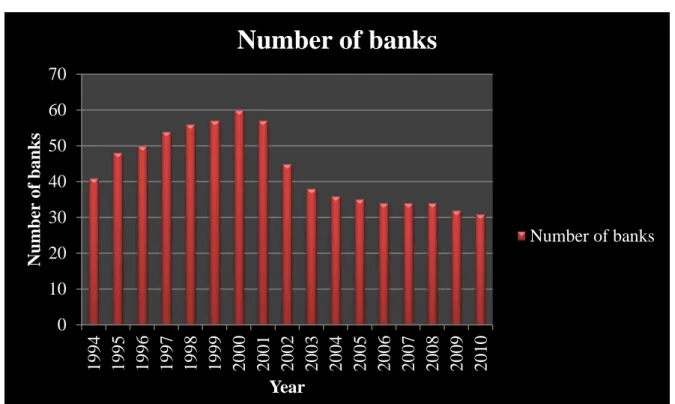
Figure 2.5: Number of players within the banking sector (1994 – 2010)
Source: SARB Bank Supervision Annual Reports (various years)
The period following the liberalisation was characterised by an increase in the number of commercial banks as can be seen from Figure 2.5. There was a steady increase in the number of players in the banking industry from 41 in 1994 to a peak of 60 in 2000. These figures include finally and provisionally registered banks and mutual banks and local branches of foreign banks. There has been a general decline in the number of banks since 2000. There was a slight decline in 2001 to 57 banks and this was followed by a sharp decline of about 21% in 2002.The decline in the number of commercial banks from 2000 was a result of the acquisition of A2 banks (that is, the smaller South African banks) bylarger banks as part of the consolidation in the industry (Hawkins, 2004).Other banks dissolved for reasons of poor financial management while some did not apply for renewal of their licenses as the benefits
0 10 20 30 40 50 60 70 1994 1995 1996 1997 1998 1999 2000 2001 2002 2003 2004 2005 2006 2007 2008 2009 2010 Num b er of b an k s Year
Number of banks
Number of banks24 | P a g e of retaining a bank license no longer appeared to outweigh the costs (Hawkins, 2004).Thus, between 2001 and 2002, 1 bank was liquidated while 11 others were either deregistered, taken over or acquired.However, TIPS (2005) argues that foreign banks entered the South African market after the end of sanctions rather than because of any liberalisation.
This period was also characterised by the development of new markets (for example a formalised gilt market and further development of market for financial derivatives), the introduction/development of new financial instruments (for example commercial paper, equity options and futures contracts and the continuous deregulation of the Johannesburg Stock Exchange (Calitz, 2002).
2.5.7. Trade liberalisation
South Africa has been pursuing a strategy of trade liberalisation since the early 1980s although trade liberalisation gained momentum in the 1990s.South Africa announced a schedule of unilateral tariff liberalisation in 1994, expiring in 1999 and the Government began the dismantling of the system of import surcharges in June of the same year. South Africa also offered a 5-year phased-in tariff reduction with effect from January 1995 by signing the WTO agreement on trade liberalisation.
By the end of the 1990s, virtually all restrictions of trade had been eliminated, the tariff regime had been rationalised and simplified and the tariff rates drastically reduced for many sub-sectors. All other trade-related measures that contravened the WTO rules had also been abolished (Kusi, 2002).
2.5.8. Dismantling of exchange controls
Throughout 1961 to 1993, South Africa intensified its exchange controls through the Exchange Control Regulations Act to prevent deterioration of the capital account. In order to facilitate the controls, the government adopted a dual exchange rate system and introduced the financial rand for all non-resident investor transactions (Tswamuno, Pardee and Wunnava, 2007). The controls were temporarily lifted in 1983 but had to be re-instated due to the worsening political situation and the withdrawal of credit lines by foreign banks to South Africa, which caused severe depreciation of the rand. The exchange controls had a negative impact in the economy as they distorted the allocative efficiency of the market economy. There was a thus a pressing need to do away with the Controls Act. The gradual phasing out of exchange controls began in 1993 (JSE, 2005) against the backdrop of positive political developments. The major step towards dismantling exchange controls however, took place on
25 | P a g e 13 March 1995, when the dual exchange rate system was finally brought to an end. Thereafter, there was a gradual relaxation of other exchange control measures which facilitated easier cross-border movements in capital. This helped minimise the problem of illiquidity in the economy and brought about increased competition, which reduced transaction costs and therefore improved economic efficiency (Gidlow, 1995). Exchange controls over residents and emigrants were however, maintained. The South African government has also taken steps to gradually reduce remaining foreign exchange controls, which apply only to South African residents. Significant relaxation over residents was effected in July 1997 (Takaendesa, 2006) and is still in progress. According to Swiss Business Hub South Africa (2012), private citizens are now allowed a one-time investment of up to 750,000 rand (R) in offshore accounts. Since 2001, South African companies may invest up to R750 million in Africa and R500 million elsewhere.. Smaller South Africa Companies can also move up to 50 Million Rand without SARB approval, allowing for swifter expansion to overseas markets. The long term objective is to lift all controls over residents so that South Africans will be allowed full access to global markets. Table 2.1 summarises the principal changes in the major dimensions of financial liberalisation.
26 | P a g e Table 2.1: Summary of the financial liberalisation process in South Africa
Credit control
Interest rates Entry barriers Exchange control Reserve requirements Credit ceilings effected in 1965, removed in 1980. Interest rate controls removed in 1980, replacement in March 1998 of Bank rate with a more market related repo rate
Enhanced market entry (with permission in 1995 to foreign banks to open branches in South
Africa); some new banks permitted after 1983; 50 new banks since 1990, development of new markets and further development of market for financial derivatives; introduction/development of new financial
instruments (e.g.
commercial paper, equity options and futures contracts); continuous deregulation of the Johannesburg Stock Exchange; Capital controls tightened in 1985, exchange controls on non-residents eliminated in 1995. Controls on residents relaxed in 1997. Cash and liquidity requirements lowered in 1980
Source: Author’s compilation
2.6. Pace of the liberalisation process
The financial liberalisation process in South Africa has taken a gradual stance rather than the “big-bang” approach. The gradual speed of adjustment has the distinct advantage that it reaps more economic advantages because it allows resource allocation to adjust to the new set of conditions. However, a gradual stance has the potential risk of fatigue setting in and the slow progress towards improved results may cause impatience and disillusionment, leading to the abandonment of the reform programme (Calitz, 2002). A rapid transformation on the other
27 | P a g e hand has the political advantage of speed, which gives dissident pressure groups less time to mobilise opposition.
2.7. Economic growth
Strong and sustainable economic growth is important for any country in order to ensure poverty alleviation, reduce unemployment and achieve a more equitable distribution of income. The South African economic performance has shown an upward trend over the study period. An analysis of the economic performance is made using GDP per capita growth which is the growth in economic activity relative to the population.
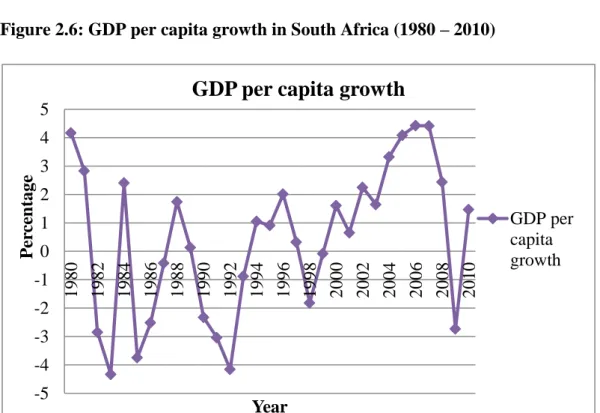
Figure 2.6: GDP per capita growth in South Africa (1980 – 2010)
Source: World Development Indicators
The growth in GDP per capita has largely been volatile over the study period although the trend has been upward (see Figure 2.6). The period from 1980 to 1994 was the most volatile as can be seen from the graph, with an average of -0.795. This was a period of political unrest in the country which impacted negatively on the growth rate. From the graph, the GDP per capita growth rate decreased from 4.164 in 1980 to -4.33 in 1983. There was a short-lived recovery between 1984 and 1988 but the continued political and social unrest resulted in sanctions being imposed on South Africa and the withdrawal of most foreign corporations, which dramatically reduced the growth rate. After this brief recovery, the growth rate was again reduced to a low point of -4.16 in 1992. After 1992, the growth in GDP per capita
-5 -4 -3 -2 -1 0 1 2 3 4 5 1980 1982 1984 1986 1988 1990 1992 1994 1996 1998 2000 2002 2004 2006 2008 2010 P er ce n tage Year
GDP per capita growth
GDP per capita growth
28 | P a g e shows a significant upward trend with a downward shift being recorded after 2007. This is concurrent with the dismantling of the apartheid regime which was also accompanied by increasing gold profits and foreign investment. There was a sharp decline after 2007 when the growth rate decreased from 4.416 to -2.733 in 2009.
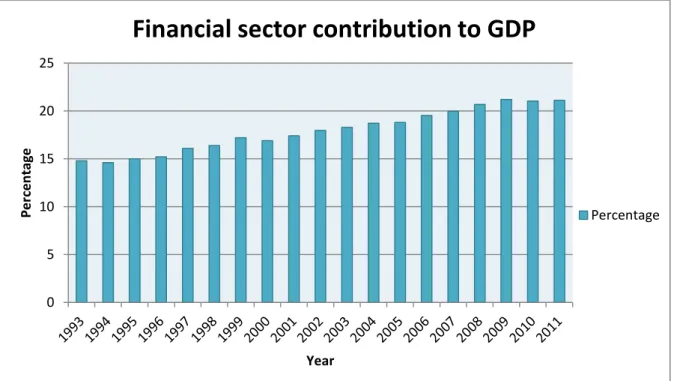
The main purpose of this study is to examine the impact of financial liberalisation on economic growth. Therefore, it is necessary to review the manner in which the South African economic growth has been performing in response to the liberalisation of the economy. In recent years, the South African financial sector has contributed a significant amount towards economic growth through its direct and indirect impact on investment and other factors. Figure 2.7 shows the contribution made by the South African financial sector towards economic activity.The contribution of the financial sector to South African Gross Domestic Product (GDP) has increased steadily over the years since democratisation.
Figure 2.7: Financial sector* contribution to GDP at market prices
*Financial Intermediation, Insurance, Real Estate and Business Services
Source: Statistics South Africa (2011)
As can be seen from Figure 2.7, the financial sector stands at around 20% as a proportion of GDP. The contribution of the sector seems to have stabilised within the 19-20% range over recent years. The data in Figure 2.7 are for the entire financial sector, including real estate and business services. The growth in financial sector contribution can be attributed to the
0 5 10 15 20 25 Per ce n tage Year