Investigating Early Web Size Measures for Web Cost Estimation
Emilia Mendes
Computer Science DepartmentThe University of Auckland Auckland, New Zealand [email protected]
Nile Mosley
MxM Technology Auckland, New Zealand [email protected]Steve Counsell
Computer Science DepartmentBirkbeck College, University of London
London, UK [email protected]
Abstract
Size measures proposed in the literature to Web cost estimation are invariably related to implemented Web applications. Even when targeted at measuring functionality based on function point analysis, researchers only considered the final Web application, rather than requirements documentation generated using any existing Web development methods. This makes their usefulness as early effort predictors questionable.
This paper presents a survey where early size measures for Web cost estimation were identified using data collected from 133 Web companies worldwide. All the companies included in the survey used Web forms to give quotes on Web development projects, based on gathered size measures. These size measures were organised into categories and ranked. The two most common size measures were “total number of Web pages” (70%) and “which features/functionality to be provided by the application” (66%). The results of the survey plus feedback from a Web company were used to prepare Web forms to gather data on Web projects worldwide.
1. Introduction
The World Wide Web (Web) has become the best known example of a hypermedia system, with numerous organisations world-wide developing thousands of commercial and/or educational Web applications. Recently, growth of the Web as a delivery environment has given birth to a new research field - Web engineering, so applying engineering principles to develop quality Web applications (Pressman, 2000). A variety of technological solutions are available for Web developers to facilitate the delivery of quality Web applications and bring them quickly to market, with typical durations ranging from 3 to 6 months (Reifer, 2000). However, there are no standardised development techniques or large datasets of historical data on Web development projects.
For Web development, cost is difficult to estimate because:
• There is no standard to sizing Web applications. Each can be created using diverse technologies such as several varieties of Java (Java, servlets, Enterprise java Beans, applets, and Java Server Pages), HTML, JavaScript, XML, XSL, and so on.
• Web development processes differ substantially from traditional approaches (Reifer, 2002).
• Web project’s primary goal is to bring quality applications to market as quickly as possible, varying from a few weeks (Pressman, 2000 ) to 6 months (Reifer, 2002).
• People involved in Web development are represented by less experienced programmers, users as developers, graphic designers and new hires straight from university (Reifer, 2002).
• Processes employed are in general heuristic, although some organisations are starting to look into the use of agile methods (Ambler, 2002).
The Web is used as the delivery platform for roughly two types of applications: Web hypermedia applications and Web software applications (Christodoulou et al., 2000). A Web hypermedia application is a non-conventional application characterised by the authoring of information using nodes (chunks of information), links (relations between nodes), anchors, access structures (for navigation) and its delivery over the Web. Technologies commonly used for developing such applications are HTML, JavaScript and multimedia. In addition, typical developers are writers, artists and organisations who wish to publish information on the Web and/or CD-ROM without the need to use programming languages such as Java. These applications have great potential in areas such as software engineering (Fielding and Taylor, 2000), literature (Tosca, 1999), education (Michau et al., 2001), and training (Ranwez et al., 2000).
Conversely, a Web software application represents conventional software applications that depend on the Web or use the Web's infrastructure for execution. Typical applications include legacy information systems such as databases, booking systems, knowledge bases etc. Many e-commerce applications fall into this category. Typically they employ technology such as off-the-shelf components such as DCOM, OLE, ActiveX, XML, PHP, dynamic HTML, databases, and development solutions such as J2EE. Typical developers are young programmers fresh from a Computer Science or Software Engineering degree, managed by more senior staff.
We use Web application to refer to both Web hypermedia and software applications.
Over the last decade hypermedia size measures have been proposed. Later these measures were adapted and other were proposed for Web applications. A description of hypermedia and Web size measures is presented in Section 2. Size is considered a primary input to software cost models, and to be of use, must be estimated at the start of the development process.
To date few papers have proposed Web size measures (Cowderoy, 1998; Coederoy, 2000; Reifer, 2000; Cleary, 2000; Mendes et al., 1999; Mendes et al., 2000; Mendes et al., 2001; Rollo, 2000) aimed at Web cost estimation. Cowderoy (1998;2000), Reifer (2000) and Cleary (2000) have used industrial datasets of Web projects to justify their size measures and to generate corresponding cost models, each collecting their data from just one Web company, which may affect the external validity of their results. Mendes et al. (2001) proposes size measures for static and dynamic Web applications and Mendes et al. (2000) proposes size measures for Web hypermedia applications. However the datasets employed in these studies are based on Web applications developed by students, which may also affect the external validity of their results. More details on these size measures will also be given in Section 2.
This paper presents a survey where early Web size measures for early cost estimation were identified using data collected from 133 Web companies worldwide. All the companies included in the survey used Web forms to give quotes on Web development projects, based on gathered size measures. These size measures were organised into categories and ranked.
The two most common size measures were “total number of Web pages” (70%) and “which features/functionality to be provided by the application” (66%). Number of Web pages has traditionally been associated with static Web applications, represented by Web hypermedia applications; Features and functionality are commonly associated with dynamic Web applications, represented by Web software applications.
These results plus feedback from a Web company were used to prepare Web forms to gather data on Web projects worldwide. The gathering of data on Web projects thus became part of a research project called the “TUKUTUKU1
Benchmarking Project”, with the aim to gather data from Web companies to benchmark development productivity and to develop cost estimation models.
The TUKUTUKU project began in October 2002 and by the time this paper was submitted, had gathered data on 36 Web projects, from 17 Web companies in five countries.
The remainder of the paper is organised as follows: Section 2 provides an overview of hypermedia and Web size measures, and places this paper in the context of existing research. Section 3 describes the survey carried out and its results. Section 4 describes the steps used to organise the data entry forms used in the TUKUTUKU project and gives summary statistics related to the data on Web projects obtained to date. Finally, Section 5 presents our conclusions and comments on future work.
2. Hypermedia and Web size measures
Over the last ten years, the proposal of hypermedia and Web size measures has stimulated considerable interest (Botafogo et al., 1992; Hatzimanikatis et al., 1995; Yamada et al., 1995; Bray, 1996; Mendes et al., 1999; Mendes et al., 2000; Mendes et al., 2001; Cleary, 2000; Rollo, 2000; Fletcher et al., 1997; Cowderoy, 1998; Cowderoy, 2000; Reifer, 2000). Each work is briefly described in the following subsections.
We have included hypermedia size measures since the Web also incorporates a hypermedia metaphor in its model, albeit a simplified version. We have not included Web usability measures, Web performance measures and Web consumer cyber-patterns measures as they are being beyond the scope of this paper.
Readers not familiar with the hypertext/hypermedia terminology, the Appendix presents definitions for hypertext, hypermedia and some related concepts.
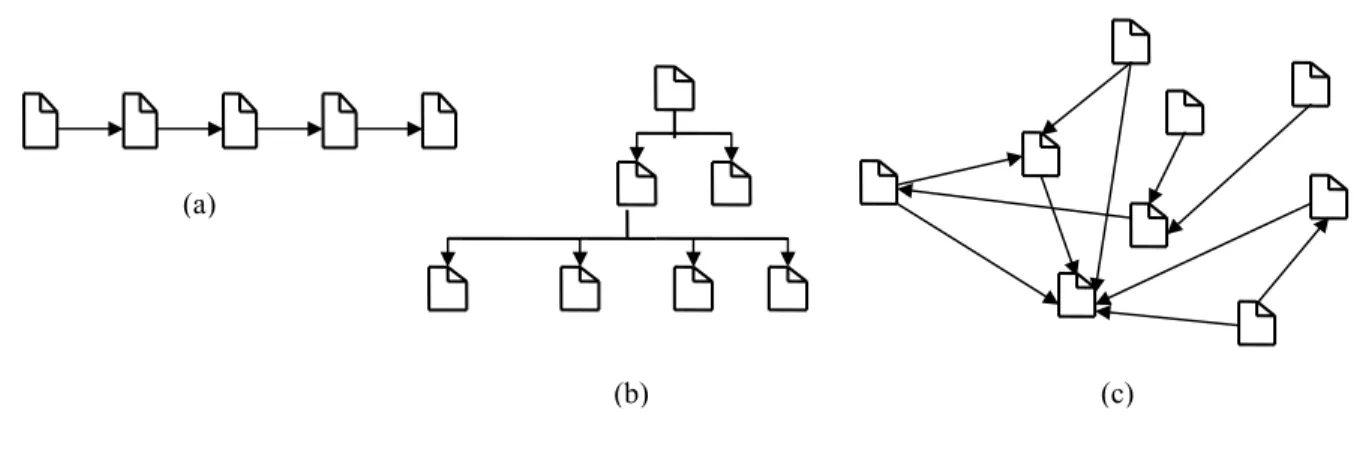
Size is represented using three attributes (Fenton and Pfleeger, 1997): length, functionality and complexity. Length measures the physical size of a Web application; functionality measures the functions supplied by the application to the user; complexity of an application is measured by its structural complexity (Fenton and Pfleeger, 1997), where the structure of a hyperdocument is represented by how nodes are interconnected by links. Figure 1 shows examples of three different structures, respectively linear (1.a), hierarchical (1.b) and network (1.c). Links are represented by arrows, and nodes are represented by documents. The assumption behind structural measures is that by analysing the structure of hyperdocuments,
1 TUKUTUKU means “Web” in Maori, the language of New Zealand natives. The project’s main page is located at
authoring of those hyperdocuments can be improved to create more comprehensible structures, thus improving navigation and reducing cognitive overload. In addition, disorientation caused by traversing a complex structure can be reduced.
Figure 1 – Different hypertext structures
(c) (b)
(a)
All size measures in this Section are presented chronologically.
2.1 Size Measures by Botafogo et al. (1992)
Botafogo et al. (1992) defined complexity measures based on the assumption that giving authors an idea of how complex and connected the hypermedia is could help them in the authoring process. They proposed the stratum and compactness
measures, both calculated from the structure of a hyperdocument. Compactness is a measure that tries to capture how well connected (by links) a hyperdocument is. Its value varies between 0 and 1. A completely disconnected hyperdocument has a value 0 and a completely connected hyperdocument a value 1. Stratum measures how much of a reading (or navigation) order is imposed on the user, i.e., to what degree the hypermedia is organised so that some nodes must be read before the others. Its value also varies between 0 and 1, where a 0 corresponds to no imposed reading order and a 1 corresponds to a linear hypermedia.
2.2 Size Measures by Yamada et al. (1995)
Yamada et al. (1995) suggest three complexity measures: i) an Interface Shallowness measure, ii) a Downward Compactness measure, and iii) a Downward Navigability measure. The Interface Shallowness measure represents the heaviness of the cognitive load on users. The idea is that nodes are linked in such a way that they do or do not preserve interface linearity, i.e., links can lead to nodes in the same layer or on a different one. The Downward Compactness
measure measures the compactness of links from the root, i.e., it denotes the structural complexity of reaching the nodes from the root. The Downward Navigability measure measures hypermedia navigability. This assumes that an easily navigable hypermedia application (1) has a shallow interface layer from the root to the nodes (light cognitive load) and (2) is compact from the root (that is, it is structurally simple to reach the nodes from the root).
2.3 Size Measures by Hatzimanikatis et al. (1995)
Hatzimanikatis et al. (1995) define a hyperdocument quality model, focusing on complexity measures. The quality factors considered are readability and maintainability, and these are decomposed into eight criteria: size, path complexity, tree impurity, modularity, node complexity, coherence, complexity of node contents and simplicity.
They defined complexity measures for : i) path complexity; ii) tree impurity; iii) modularity; and iv) individual node complexity. Path complexity is the number of different paths or cycles that can be found in a hyperdocument, assuming it to be a graph. The path complexity of a linear hyperdocument is minimal. Tree impurity is the extent to which a graph deviates from being a tree. Modularity measures if the nodes are self-contained and independent. The individual node complexity is the complexity that a single node imposes on the overall hypermedia structure.
2.4 Size Measures by Bray (1996)
Bray (1996) aims to offer measures useful to measure the size of the entire World Wide Web. However, amongst the measures suggested, there were also measures targeted at Web applications. As Length measures, he proposed page size, which was measured in three different ways: as the amount of space used (Kbytes) by a Web page; number of words in a Web page; and number of image references in a Web page. As complexity measures, he proposed Outbound connection
and Inbound connection. Given a Web application w, outbound connection measures the number of external links (links that point to another Web application/site); inbound connection measures the number of links from other Web applications/sites pointing to w. Large inbound connection values would represent more visible Web applications.
2.5 Size Measures by Fletcher et al. (1997)
Fletcher et al. (1997) propose an approach for assessing multimedia component and system characteristics and to use these features to estimate the associated development effort. Although their work targets at multimedia applications, there are strong similarities between these and hypermedia applications. Their approach is based on the assertion that Multimedia Information Systems (MMIS) development effort is a function of: i) building the application’s content; and ii) authoring the application.
Building the application’s content: For each media component created, the length measures considered important for this process are: media filename, media type (graphic, audio, video, animation, photograph, scan), media source (original or pre-existing), and component duration (for animation, sound and video).
Authoring the application: For each screen created, the length measures considered important are: number of objects on the screen (including sounds); the complexity measures considered important are the number of links between a screen and other screens, the functionality measures considered are the number of events on a screen and the average number of actions per event.
For each media used, the length measures considered important are: the number of objects within the component, media type (reused or not elsewhere in the project) and media form (button, toolbar, screen, background etc).
2.6 Size Measures by Cowderoy2 (1998; 2000)
Cowderoy (1998; 2000) recommends several size measures for cost estimation and risk assessment of Web application development projects. Measures have been organised into the following categories:
• Web-site design. Creation and organisation of Web pages. Length measures provided are Web pages (number of Web pages), home pages (number of major entry points to the Web application/site), leaf nodes (number of leaf Web pages, i.e., pages that have no siblings), hidden nodes (number of pages excluded from the main navigation buttons),
depth (number of nodes on the second level that have siblings); complexity measures are interconnectivity (number of URLs that link to other pages in the same application/site), external hyperlinks (number of unique URLs in the Web application/site); functionality measures are actions (number of independent actions provided from a Web page by use of Javascript, Active X and Java applets).
• Technical authoring. Collection of text and related hyperlinks, and text structuring sections etc. Length measures
proposed are paragraph count (number of paragraphs in a Web page, Web application, or external document, i.e., PDF document), word count (number of words in a Web page or document); complexity measures are navigational structures (number of different structures in a Web page or document).
• Data entry. Creation and maintenance of databases used by a Web application. Length measures proposed are key record types (number of different tables accessed by the application/site), key entries (number of keys in a database table), entry fields (number of table attributes manipulated by the application/site), secure fields (number of fields that contain safety-critical or financially secure information).
• Graphics design. Creation of 2D images using graphics design tools. Length measures are delivered images
(number of unique images used by the Web application/site), image size (width * height), image composites (number of layers from which the final image was created), language versions (the number of versions of an image that must be produced to accommodate different languages or different cultural priorities).
• 3D and VR design. Creation of 3D objects and environments with which the user can interact. Length measures are
3d objects (number of files including one or more 3D objects used in the Web application/site) and virtual worlds
(number of files including one or more virtual worlds used in the Web application/site).
• Sound engineering. Adaptation of existing audio tracks for use at Web applications. Length measures are audio files (number of unique audio files used in the Web application/site), duration (summed duration of all sequences within an audio file), audio sequences ( number of sequences within the audio file), tracks (number of layers within an audio sequence), audio edits (number of edits applied to groups of frames within a sequence, e.g., fades) and
imported images (number of separate graphics images imported into an interactive audio file).
• Animation and video editing. Building movies from existing images, video, text and sound. Length measures are
movies (number of movie files used in a Web application, Web page, or referenced by other movies at this Web application or Web page), duration of a movie (for each scene in a movie, divide the scene’s final frame number by
the frame rate) and story composites (for each scene, count the number of layers from which the final image was created), frame rate (number of frames per second as defined in the delivered file).
• Programming. Creation of server-side software and client-side programs that replace browsers. Classifies measures into three categories – Specification, Design and Program. The Specification length measures proposed are user commands (number of different menu commands, buttons, etc that the user can access from the application’s interface), database files (number of entities and relationships in the database schema) and classes definitions (object-oriented classes resulting from the analysis of use cases). The Design length measures are any design object-oriented measures where no one in particular is specified. The Design functionality measures are Function Points or Full Function Points. Finally, Program length measures are lines of source code and McCabe complexity measures (Fenton and Pfleeger, 1997).
Finally, for every asset (2D image, Web page, animation etc) its source is measured using a nominal scale, where scale points are “new”, “public library”, “subcontracted” and “own stock”.
2.7 Size Measures by Mendes et al. (1999; 2000; 2001)
Mendes et al. (1999) suggest size measures to be used to predict authoring effort for hypermedia applications. The length measure suggested is Hyperdocument size (refers to the number of documents that the hypermedia application has. Documents are considered here to be either HTML files or any kind of file that is defined as a document in the hypermedia systems used in the evaluations.); the complexity measures suggested are: Connectivity (refers to the number of links that the hypermedia application has. These links can be internal or external, where dynamically generated links are excluded),
Compactness (Botafogo et al., 1992) (indicates how inter-connected the nodes are), Stratum (Botafogo et al., 1992) (indicates to what degree the hypermedia application is organised for directed reading), and Link Generality (refers to whether the link applies to a single instance, for example point-to-point links, or whether it applies (or can be applied) to multiple instances.
Later they proposed a new set of size measures (Mendes et al., 2000), targeting in particular at Web hypermedia applications, which are:
Length measures:
• Page count (number of HTML or SHTML files used in a Web application)
• Media count (number of unique media files used in a Web application)
• Program count (number of CGI scripts, JavaScript files, Java applets used in a Web application)
• Total page allocation (total space allocated for all HTML or SHTML pages (Mbytes) used in a Web application)
• Total media allocation (total space allocated for all media files (Mbytes) used in a Web application)
• Total code length (number of lines of code for all programs used in a Web application)
• Reused program count (number of reused or modified programs used in a Web application)
• Total reused media allocation (total space allocated for all reused media files used in a Web application (Mbytes))
• Total reused code length (total number of lines of code for all programs reused by a Web application)
• Code comment length (number of comment lines in program)
• Reused code length (number of reused lines of code)
• Reused comment length (number of reused comment lines)
• Total page complexity (average number of different types of media used in the Web application, excluding text)
Complexity measures:
• Connectivity (total number of internal links, not including dynamically generated links)
• Connectivity density (Connectivity divided by page count)
• Cyclomatic complexity (Fenton and Pfleeger, 1997) ((Connectivity -page count) + 2)
This list was revisited (Mendes et al., 2001) to include also bottom-up measures:
Length measures:
• Page allocation (size of HTML or SHTML file (Kbytes))
• Media duration (duration of audio, video, and animation (minutes))
• Media allocation (size of media file (Kbytes))
• Program Code length (number of lines of code in program)
• Page complexity (number of different types of media used on page, not including text)
• Graphic complexity (number of graphics media used in page)
• Audio complexity (number of audio media used in page)
• Video complexity (number of video media used in page)
• Animation complexity (number of animations used in page)
• Scanned image complexity (number of scanned images used in page)
Complexity measures:
• Page linking complexity (number of links per page)
2.8 Size Measures by Rollo (2000)
Rollo (2000) did not suggest any new size measures, however, as far as we know, he was the first researcher to investigate the issues of measuring functionality of Web hypermedia and Web software applications, aiming at cost estimation, using several function point analysis methods. He measures the functional size of two applications in both IFPUG, MKII, and
COSMIC-FFP3 methods. Rollo (2000) concludes that COSMIC-FFP proved to be the most flexible approach for counting
the functional size of Web hypermedia and Web software applications and can be applied to any Web application.
2.9 Size Measures by Cleary (2000)
Cleary (2000) proposes size measures for Web cost estimation and divides the size measures into two types: size measures for Web hypermedia applications and size measures for Web software applications.
Size measures for Web hypermedia applications: Length size measures are:
• Number of unique non-textual elements within an application. • Number of externally sourced elements.
• Number of customised infra-structure components. • Number of non-textual elements within a Web page. • Number of words in a Web page.
• Web points (ordinal scale to measure the length of a Web page. Scale points are “Low”, “Medium” and “High”. Each scale point is attributed a number of Web points, previously calibrated to a specific Web projects dataset).
• Total Web points (measures the total size of a Web hypermedia application in Web points by adding the number of Web pages of “Low” complexity * value for “Low” Web points, Web pages of “Medium” complexity * value for “Medium” Web points, Web pages of “High” complexity * value for “High” Web points.
Complexity size measures are:
• Number of links into a Web page (incoming links; can be internal or external links).
• Number of links out of a Web page (outgoing links; can be internal or external links).
• Web page complexity (ordinal scale used to measure the complexity of a Web page based upon its number of words, and combined number of incoming and outgoing links, plus the number of non-textual elements. The scale points are “Low”, “Medium” and “High”. Value ranges are provided for each scale point, for number of words and combination of incoming links + outgoing links + non-textual elements. These values have been calibrated based on a specific Web projects dataset).
Size measures for Web software applications: Suggests the use of functionality measures to measure the dynamic aspects of these applications, targeting at function point analysis. However, he does not specify a particular method.
2.10 Size Measures by Reifer (2000)
Reifer (2000) proposes a length size measure called Web Objects, which measures the number of Web Objects. Size is measured using an adaptation of Halstead’s equation for volume, tuned for Web applications. The equation is as follows:
V = N log2(n) = (N1 + N2) log2 (n1 + n2) (1)
where:
N = number of total occurrences of operands and operators
n = number of distinct operands and operators
N1 = total occurrences of operand estimator
N2 = total occurrences of operator estimators
n1 = number of unique operands estimator
n2 = number of unique operators estimators
V = volume of work involved represented as Web Objects
Operands are organised in nine categories:
• Number of building blocks (Active X, DCOM, OLE etc)
• Number of COTS components (includes any wrapper code)
• Number of multimedia files, except graphics files (text, video, sound etc)
• Number of object or application points (Cowderoy, 1998; Cowderoy, 2000), or others proposed (# server data tables, # client data tables etc)
• Number of xml, sgml, html and query language lines (# lines including links to data attributes)
• Number of Web components (applets, agents etc)
• Number of graphics files (templates, images, pictures etc)
• Number of scripts (visual language, audio, motion etc)
• Other
2.11 Discussion
From 1992 to 1995 size was measured solely based on complexity measures. In 1997 came the first publication that used hypermedia/multimedia size measures aimed at cost estimation. From 1998 to 2000 more work was devoted to size measures applicable to cost estimation; three of these were by industry practitioners (Cowderoy, 1998; Cowderoy, 2000; Cleary, 2000; Reifer, 2000) who proposed measures and then validated with datasets or development practices from one Web company, for each practitioner. Regrettably their findings may not be applicable to other Web companies work and practices, so hampering the external validity of their findings.
All size measures proposed for cost estimation presented in this Section were invariably related to implemented Web applications. Even when targeted at measuring functionality based on function point analysis, researchers only considered
the final Web application, rather than requirements documentation generated using any existing Web development methods. This makes their usefulness as early effort predictors questionable.
The size measures presented in the next Section were obtained from the elicitation of 133 Web companies worldwide, using their own Web development project quote forms. These measures were ranked such that readers can identify those that stand out as strong effort predictors. Although still a small number, if compared to the total number of Web companies worldwide, we believe it gives a better picture of useful size measures than results based on a single Web company.
3. Web Size Measures Survey
3.1 IntroductionThe purpose of the survey was to identify Web size measures used by Web companies as early cost estimators. The target population was that of Web companies that use early size measures to estimate costs. Research questions we were interested in answering were as follows:
• What are the size measures used as early cost estimators by Web companies?
• Which of these are used the most?
• Which of these are characteristic of Web hypermedia applications?
• Which of these are characteristic of Web software applications?
To obtain a sample of our population of interest, we used a Web search engine (www.google.com) to carry out a search, on the 7th of August 2002, using the sentence “quote Web development project”. Google.com was chosen because it is the
fourth most popular search engine in the world, where numbers 1 and 3 both licence Google technology for their Web searches. About half of all Web searches in the world are performed with Google, and is translated into 86 languages. Our objective was to obtain Web addresses (URLs) for Web companies that had on-line quotes for Web development projects where these quotes could be used to identify early cost estimators. Two hundred and fifty nine (259) Web addresses were retrieved. Of those, 38 did not contain any forms or description that could be used to identify cost estimators. Of the remaining 221 URLs, 88 presented on-line quotes that were too general to obtain any useful information. An example of a general Web form is given in figure 2.
3.2 Results
The data collected from 133 on-line quotes was organised into 5 categories:
• Web application static measures
• Web application dynamic measures
• Web Project measures
• Web company measures
Figure 2 – Example of a general Web form with a very simple quote
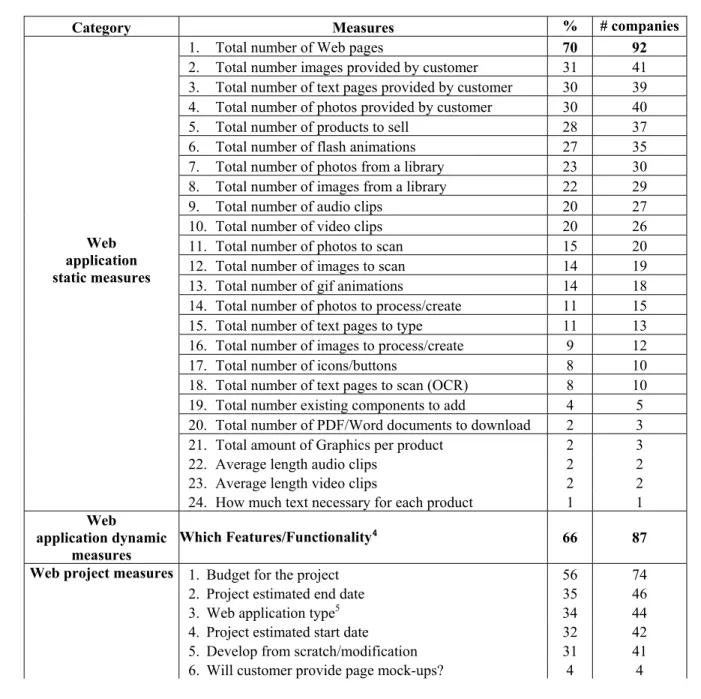
Static measures correspond to measures that have been commonly used to characterise Web hypermedia applications (e.g., number of Web pages, number of graphics etc). Dynamic measures refer to any features or functionality mentioned (e.g., database integration, on-line secure order form etc). Web project measures are measures relative to a Web project (e.g., project budget). Web company measures are measures used in relation to a Web company (e.g., target audience), and Web interface design measures relate to the final appearance of the Web application (e.g., background colour, style etc). The full list of measures per category is given in Table 1. Table 1 also shows the percentage and corresponding number of Web companies that have included that measure in their cost estimation quote form. Two measures stand out, total number of Web pages and which features/functionality. The first is a typical length size measure and the second an abstract measure of functionality.
Seventy four (74) Web companies also asked for the available Web project budget. Project estimated end date, project estimated start date and application type also were important. We believe these help set priorities and perhaps decide on what skills are necessary and available to the project.
Table 1 – Measures organised by category and ranking
Category Measures % # companies
1. Total number of Web pages 70 92
2. Total number images provided by customer 31 41 3. Total number of text pages provided by customer 30 39 4. Total number of photos provided by customer 30 40 5. Total number of products to sell 28 37 6. Total number of flash animations 27 35 7. Total number of photos from a library 23 30 8. Total number of images from a library 22 29 9. Total number of audio clips 20 27 10. Total number of video clips 20 26 11. Total number of photos to scan 15 20 12. Total number of images to scan 14 19 13. Total number of gif animations 14 18 14. Total number of photos to process/create 11 15 15. Total number of text pages to type 11 13 16. Total number of images to process/create 9 12 17. Total number of icons/buttons 8 10 18. Total number of text pages to scan (OCR) 8 10 19. Total number existing components to add 4 5 20. Total number of PDF/Word documents to download 2 3 21. Total amount of Graphics per product 2 3 22. Average length audio clips 2 2 23. Average length video clips 2 2
Web application static measures
24. How much text necessary for each product 1 1
Web
application dynamic
measures Which Features/Functionality
4 66 87
1. Budget for the project 56 74
2. Project estimated end date 35 46
3. Web application type5 34 44
4. Project estimated start date 32 42 5. Develop from scratch/modification 31 41
Web project measures
6. Will customer provide page mock-ups? 4 4
4 All have been considered as functionality/features for the sake of our ranking. Features/functionality are: Auction/Bid utility, Bulletin Boards, Discussion Forum/Newsgroups, Chat Rooms, E-postcard, Email-a-Friend, Mailing List for Site, Subscriptions, Vote System, Web-based e-mail, Database creation, Database integration, Other persistent storage integration (e.g. flat files), Credit Card Authorization, Member login, Online Secure Order Form, Password protected pages, Online Content Updating, Online feedback form, Shopping Cart Services, Invoices/ Billing, Calendars/Event Calendar, Display current date, CSS (Style sheets) Charts, File upload/download, HR Handbooks, Job Accounting, Job Scheduling, Specialized Reports, Live data (stock quotes etc), Performance reviews, Time Tracking, Traffic Statistics, Knowledge Base, Language Translation, Page counters, Personalisation, Search Engine, User Guest book, Visitor statistics, Cell Phone Optimisations, Palm PDA Web Clipping.
5Academic, Corporate, eCommerce, eTrading, Educational, Entertainment, Extranet, Family, Functional, Intranet, Media, Multimedia Presentation, News and Information, Non-Profit, Online community/forum, One Page Presence, Personal, Political, Portal (vertical or horizontal), Professional, Promotional, Search engine, Short-Term Promotion, Small Business, Support site/video chat, Virtual marketplace (B2B)
7. Will the application be translated to different idioms? 3 4 8. Will customer provide website map? 3 4
9. What kind of Internet access most likely for customers?6 1 1
Contact information (e-mail) 100 133 Description of company’s business 19 25
Web company
measures Company’s target audience7 18 24
What is the preferred style for the site8 17 23
Give three URLs for sites you like 17 23
What type of colours for the site?9 13 17
What type of colours for the background?10 5 7 Web interface design
measures
What type of colours for pages?11 5 7
Answering the survey research questions:
• What are the size measures used as early cost estimators by Web companies?
Size measures identified in the survey are presented in Table 1, under Web application static measures and Web application dynamic measures. Observe that no complexity measures have been identified. Those that have been ranked highest are possibly the most important, given that they were suggested by the greatest number of Web companies. For static measures, Web companies require from the beginning, how much information (text, photos, images) ready to use is provided by customers, how much information needs to be digitized or needs to be created from scratch. Number of pages was also important information. We believe this to be the case as most Web companies use number of pages as one of the core components for Web applications (e.g., 5 pages with text only, 5 pages with text, images etc). Regarding dynamic measures, Web companies listed features and functionality, rather than using a more sophisticated mechanism to measure functionality. This may suggest development practices where functional components are not well defined at the start of the project.
• Which measures are used the most?
According to the survey, the two measures used the most are total number of Web pages and which features/functionality. Together they represent respectively seventy (70) and sixty-six (66) percent of those Web companies included in the survey. This suggests that they are the two strongest effort predictors obtained from the survey, despite the need of empirical evidence to support this claim. It is interesting that total number of Web pages represents a length measure, characteristic of Web hypermedia applications and which features/functionality represents more closely an abstract
6 T1 or better, DSL, IDSN, Dial Up (56K), Dial Up (33.6K)
7 Business people and professionals, mainly women, mainly men, teenagers and twenty something, children, students, college or trade schools, anyone and everyone
8 whimsical, bright and vivid, techno-futuristic, gritty, aggressive, mass-consumer oriented, really 'clean' looking, sports-oriented, fun and wacky, for women only, other
9 primary colours, pastel colours
10 solid colour background, image background 11light colour pages, dark colour pages
measure of functionality, characteristic of Web software applications. We believe this is an attractive result as it seems to suggest a balance between static and dynamic characteristics which may be present in Web applications. In addition, total number of Web pages has also been the measure chosen by most literature described in Section 2 targeting at cost estimation. Conversely, the measurement of functionality, as suggested in the previous studies described in Section 2, is quite different from what the survey results suggest.
• Which measures are characteristic of Web hypermedia applications?
The category Web application static measures characterise closely Web hypermedia applications.
• Which measures are characteristic of Web software applications?
The category Web application dynamic measures characterise closely Web software applications.
4. Moving Towards a Repository of Web projects
Once the ranking described in the previous Section was completed, the next stage was to contact an experienced Web company to confirm/deny, based on the ranking provided, those measures identified as most important for early cost estimation. Based on this company’s feedback, we prepared Web forms to be used to gather data on Web projects worldwide. This data gathering initiative was called the TUKUTUKU benchmarking project.
The Web company contacted is based in Rio de Janeiro, Brazil. Five people work in Web design and development within the company. Three of those are company directors, also managing Web projects and preparing quotes for customers, amongst other things.
This company has a portfolio of more than 50 Web applications and has been established for 10 years. They use a documented process and depending on the type of project, one out of two types of process models are used: incremental prototyping or waterfall.
The types of services they provide are: Web application design, Web application development, Web application enhancement, e-commerce/shopping cart Development, Database Integration, Flash Animation Design, Graphic Design, Web application Maintenance, Training and Consulting.
The types of industry representative of their customers are Finance/Investment/Brokerage, Government, Insurance, Legal, Non-Profit, Telecommunications and Utilities.
One of the directors was contacted by one of the authors and helped validate those measures obtained from the survey relevant for early cost estimation. This director has worked in software development for 18 years and is experienced in management of large projects, conventional or Web-based.
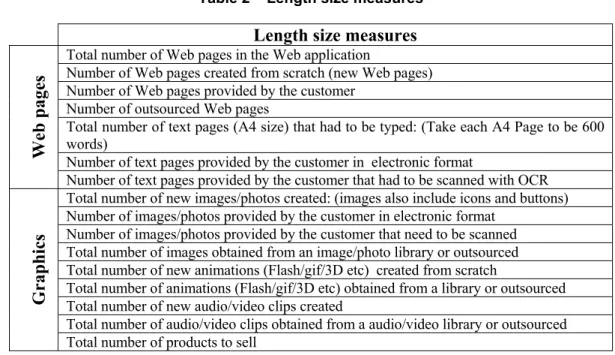
For Web application static measures agreement was reached for most (from number 1 to 18, see Table 1), looking at those which could actually be estimated early on in the Web development life cycle. Some more were added to the list, and some were re-arranged, as presented in Table 2.
For Web application dynamic measures more features/functionality were added to the list and suggested that adding a complexity level to each feature/functionality would help discern more difficult implementations. These measures were also confirmed as suitable for early cost estimation.
For Web Project measures, numbers 1, 2, 4 and 5 (see Table 1) were identified as important for early cost estimation as they can be useful to allocate resources. However, it was suggested these would not be used as input into a cost estimation parametric model.
None of the Web company measures and Web interface design measures were seen as relevant for early cost estimation.
Regarding the Web application dynamic measures, careful consideration was given to differentiate more complex features/functions from less complex ones, without infringing the Representational Theory of Measurement. The solution was devised as follows:
• Companies contributing Web project data to TUKUTUKU would be asked to identify those features and functionality where they spent a high amount of effort to develop or adapt.
• Companies would also be asked to supply the average person hours that represent a high effort to develop and to adapt.
• Companies would be able to provide features/functionality that we had not considered.
In addition, we also characterised features/functionality into three types:
• Feature off-the-shelf (FOTS) – feature/functionality reused as is.
• FOTS adapted (modified) – feature/functionality reused and adapted to local circumstances.
• New in-house Feature/ Functionality – feature/functionality developed from scratch.
Table 2 – Length size measures
Length size measures
Total number of Web pages in the Web application
Number of Web pages created from scratch (new Web pages) Number of Web pages provided by the customer
Number of outsourced Web pages
Total number of text pages (A4 size) that had to be typed: (Take each A4 Page to be 600 words)
Number of text pages provided by the customer in electronic format
Web pages
Number of text pages provided by the customer that had to be scanned with OCR Total number of new images/photos created: (images also include icons and buttons) Number of images/photos provided by the customer in electronic format
Number of images/photos provided by the customer that need to be scanned Total number of images obtained from an image/photo library or outsourced Total number of new animations (Flash/gif/3D etc) created from scratch
Total number of animations (Flash/gif/3D etc) obtained from a library or outsourced Total number of new audio/video clips created
Total number of audio/video clips obtained from a audio/video library or outsourced
Graphics
The Web form to enter data on Web projects, which is used in the TUKUTUKU project, is available at http://www.cs.auckland.ac.nz/tukutuku/project.html.
The Web form used to gather demographics data on the participating Web companies used in the TUKUTUKU project, is available at http://www.cs.auckland.ac.nz/tukutuku/demographics.html.
5. The TUKUTUKU project
The TUKUTUKU project aims to collect data about Web projects. The collected data is used to develop Web cost estimation models and to benchmark productivity across and within Web Companies. The resulting database will provide Web development managers and companies with information about Web projects, delivered Web applications/sites and development effort. This information can be used for productivity benchmarking, cost estimation and to improve current Web development practices.
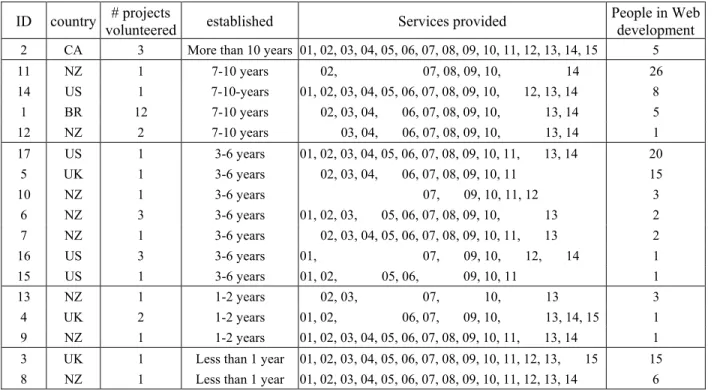
Table 3 – Demographics of Web companies that have volunteered data to the TUKUTUKU project to date
ID country volunteered # projects established Services provided People in Web development
2 CA 3 More than 10 years 01, 02, 03, 04, 05, 06, 07, 08, 09, 10, 11, 12, 13, 14, 15 5 11 NZ 1 7-10 years 02, 07, 08, 09, 10, 14 26 14 US 1 7-10-years 01, 02, 03, 04, 05, 06, 07, 08, 09, 10, 12, 13, 14 8 1 BR 12 7-10 years 02, 03, 04, 06, 07, 08, 09, 10, 13, 14 5 12 NZ 2 7-10 years 03, 04, 06, 07, 08, 09, 10, 13, 14 1 17 US 1 3-6 years 01, 02, 03, 04, 05, 06, 07, 08, 09, 10, 11, 13, 14 20 5 UK 1 3-6 years 02, 03, 04, 06, 07, 08, 09, 10, 11 15 10 NZ 1 3-6 years 07, 09, 10, 11, 12 3 6 NZ 3 3-6 years 01, 02, 03, 05, 06, 07, 08, 09, 10, 13 2 7 NZ 1 3-6 years 02, 03, 04, 05, 06, 07, 08, 09, 10, 11, 13 2 16 US 3 3-6 years 01, 07, 09, 10, 12, 14 1 15 US 1 3-6 years 01, 02, 05, 06, 09, 10, 11 1 13 NZ 1 1-2 years 02, 03, 07, 10, 13 3 4 UK 2 1-2 years 01, 02, 06, 07, 09, 10, 13, 14, 15 1 9 NZ 1 1-2 years 01, 02, 03, 04, 05, 06, 07, 08, 09, 10, 11, 13, 14 1 3 UK 1 Less than 1 year 01, 02, 03, 04, 05, 06, 07, 08, 09, 10, 11, 12, 13, 15 15 8 NZ 1 Less than 1 year 01, 02, 03, 04, 05, 06, 07, 08, 09, 10, 11, 12, 13, 14 6
The TUKUTUKU project started officially on October 2002. Invitation letters were e-mailed to Web companies in New Zealand, with a follow up phone call a few days later, seeking participation. The company from Brazil volunteering data is the same one that has helped us define the early size measures to use at TUKUTUKU. During November Web companies in London were contacted, both by e-mail and by telephone calls and invitation letters were e-mailed to companies in the US, without any follow up phone calls. The Canadian company in our dataset was a result of a snowball process, where
one of the authors contacted a researcher in Canada asking for his help broadcasting the invitation letter to Web companies in Canada he had contact with. The number of companies contacted per country is as follows: NZ:70; London:50; BR:1; US:250. To date we have received 36 Web projects from 17 Web companies in 5 different countries (see Tables 3 and 4). We used a pre-selected respondent sample, however we are also aware that the data obtained is a result of a self-selected sample. We believe the data in the TUKUTUKU database can be very useful as an indicator, provided one is aware of the limitations.
Table 4 – Number of companies that provide each type of service Service # Description # Web companies
10 Graphic Design 17
7 Web programming 16
9 Flash Animation Design 16
2 Web application Design 14
6 e-commerce/shopping cart Development 13 3 Web application Development 12
8 Database Integration 12
13 Web application Maintenance 12
1 Domain Registration 10
4 Web application Enhancement 10 14 Training and Consulting 10
5 Web site hosting 9
11 Internet Marketing and Promotion 9 12 Grammar and Text Editing 6
15 Other(s) 3
A detailed description of the dataset and the results of its use for cost estimation will be the subject of another paper.
6. Conclusions and Comments on Future Work
This paper describes a survey where early Web size measures for cost estimation were identified using data collected from 133 Web companies worldwide. All the companies included in the survey used Web forms to give quotes on Web development projects, based on gathered size measures. These size measures were organised into categories and ranked. The two most used size measures, according to the ranking, were “total number of Web pages” and “which features/functionality to be provided by the application”, where the former was used 70% of the time and the latter was used 66% of the time.
The results of this survey plus feedback from a Web company were used to prepare Web forms to gather data on Web projects worldwide. The gathering of data on Web projects is part of a research project called the TUKUTUKU Benchmarking Project.
The TUKUTUKU project has started in October 2002 and by the time this paper was submitted, we had gathered data on 36 Web projects, from 17 Web companies and 5 countries. One company has contributed so far with data from 12 Web projects and the remaining companies have contributed with data from 1 to 3 Web projects each.
As part of our future work we plan to develop cost estimation models based on the Web projects data we gathered as part of the TUKUTUKU benchmarking project and to use the data to produce productivity benchmarking and cost estimation reports that can help improve the practices of those Web companies that participated in our project.
7. Acknowledgments
We would like to thank Dr. Chris Triggs for his help during the initial stage of the survey, Mr. Marcos Villas for all his help in the TUKUTUKU benchmarking project and Dr. Khaled El-Emam for forwarding on our invitation letter to Web companies in Canada. We would also like to thank all those companies that have volunteered data on their Web projects.
8. References
Ambler, S.W. 2002. Lessons in Agility from Internet-Based Development, IEEE Software, Mar.-Apr. : 66--73.
Botafogo, R., Rivlin, A.E. and Shneiderman, B. 1992. Structural Analysis of Hypertexts: Identifying Hierarchies and Useful Metrics, ACM TOIS,10:2:143--179.
Bray, T. 1996. Measuring the Web. Proc. Fifth International World Wide Web Conference, May 6-10, Paris, France, http://www5conf.inria.fr/fich_html/papers/P9/Overview.html
Christodoulou, S. P., Zafiris, P. A., Papatheodorou, T. S. 2000. WWW2000: The Developer's view and a practitioner's approach to Web Engineering, Proc. 2nd ICSE Workshop Web Eng. 75--92.
Cleary, D. 2000. Web-based development and functional size measurement. Proc. IFPUG 2000 Conference.
Cowderoy, A.J.C., Donaldson, A.J.M., Jenkins, J.O. 1998. A Metrics framework for multimedia creation, Proc. 5th IEEE International Software Metrics Symposium, Maryland, USA.
Cowderoy, A.J.C., 2000. Measures of size and complexity for web-site content, Proc. Combined 11th ESCOM Conference
and the 3rd SCOPE conference on Software Product Quality, Munich, Germany, 423--431.
N. E. Fenton, and S. L. Pfleeger, 1997. Software Metrics, A Rigorous & Practical Approach, 2nd edition, PWS Publishing Company and International Thomson Computer Press.
Fielding, R.T., and Taylor, R.N. 2000. Principled design of the modern Web architecture. Proc. ICSE. ACM. New York, NY, USA, 407--416.
Fletcher, T., MacDonell, S. G., and Wong, W. B. L. 1997. Early experiences in Measuring Multimedia Systems Development Effort. In: Multimedia Technology and Applications, Hong Kong: Springer-Verlag, 211--220.
Hatzimanikatis, A. E., Tsalidis, C. T., and Chistodoulakis, D. 1995. Measuring the Readability and Maintainability of Hyperdocuments, J. of Software Maintenance, Research and Practice, 7, 77--90.
Mendes, E., and Mosley, N. 2000. Web Metrics and Development Effort Prediction, Proc. ACOSM 2000, Sydney, Australia.
Mendes, E., Hall, W., Harrison, R. Applying measurement principles to improve hypermedia authoring, New Review of Hypermedia and Multimedia, Vol.5, pp 105-132, Taylor Graham Publishers. 1999.
Mendes, E., Mosley, N., and Counsell, S. 2001. Web Metrics – Estimating Design and Authoring Effort. IEEE Multimedia, Special Issue on Web Engineering, Jan.-Mar., 50--57.
Michau, F., Gentil, S., and Barrault, M. 2001. Expected benefits of web-based learning for engineering education: examples in control engineering. European Journal of Engineering Education, 26:2:151—168, June.
Pressman, R.S. What a tangled web we weave. IEEE Software, (Jan/Feb), 2000,18-21.
Ranwez, S., Leidig, T., and Crampes, M. 2000. Formalization to improve lifelong learning. Journal of Interactive Learning Research, 11:3-4:389--409. Publisher: Assoc. Advancement Comput. Educ, USA.
Reifer, D.J. Web development: estimating quick-to-market software. IEEE Software, (Nov/Dec), 2000, 57-64. Rollo, T. 2000. Sizing e-commerce. Proc. ACOSM 2000, Sydney, Australia.
Tosca, S.P. 1999. The lyrical quality of links hypertext, Proc. 10th ACM Hypertext Conference. ACM. 217--218. Yamada, S., Hong, J., and Sugita, S. 1995. Development and Evaluation of Hypermedia for Museum Education: Validation of Metrics, ACM Transactions on Computer-Human Interaction, 2(4), 284--307, December.
APPENDIX
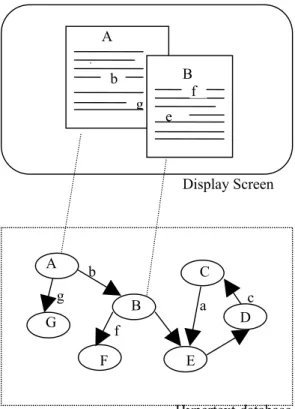
The concept of hypertext was described by Conklin (1987) as follows: “windows on the screen are associated with objects in a database, and links are provided between these objects, both graphically (as labelled tokens) and in the database (as pointers)” (see figure 1). The collection of objects in the database is defined as a hyperdocument. When the elements that can be networked together are only text the hyperdocument is called hypertext. If the elements include graphics, digitised speech, audio recordings, pictures, animation, film clips, etc the hyperdocument is called hypermedia. Hypertext can also be described as a web of chunks of information inter-related through links. The origin or destination of a link is an anchor. Anchors can be words, sentences, areas of an image etc.
Hypertext database A b g B e f Display Screen g a b B C f F E G
c D A
Figure 1:- The concept of Hypertext (Conklin 1987)
A hypertext authoring system (or hypermedia system) is defined as an environment used to create a hypermedia application (Isakowitz et al. 1995). In other words, hypermedia applications are instances of hypermedia systems.
Hypermedia applications can be structured in different ways: sequence, hierarchy, and network (Nielsen 1989; Whalley 1990). A sequential structure represents documents linearly linked (commonly represented by the ‘previous’ and ‘next’ links). A hierarchical structure represents documents linked in a tree shape. A network structure represents documents linked in a net shape.
Keywords: Web hypermedia applications, Web size measures, Web cost estimation, survey, TUKUTUKU.
Footnotes:
1 TUKUTUKU means “Web” in Maori, the language of New Zealand natives. The project’s main page is located at
http://www.cs.auckland.ac.nz/tukutuku/introduction.html.
2 A detailed description of these measures is given in http://www.xvc63.dial.pipex.com/my-complexity/index.shtml. 3 COSMIC-FFP = COmmon Software Measurement International Consortium-Full Function Points
4 All have been considered as functionality/features for the sake of our ranking. Features/functionality are: Auction/Bid
utility, Bulletin Boards, Discussion Forum/Newsgroups, Chat Rooms, E-postcard, Email-a-Friend, Mailing List for Site, Subscriptions, Vote System, Web-based e-mail, Database creation, Database integration, Other persistent storage integration (e.g. flat files), Credit Card Authorization, Member login, Online Secure Order Form, Password protected pages, Online Content Updating, Online feedback form, Shopping Cart Services, Invoices/ Billing, Calendars/Event Calendar, Display current date, CSS (Style sheets) Charts, File upload/download, HR Handbooks, Job Accounting, Job Scheduling, Specialized Reports, Live data (stock quotes etc), Performance reviews, Time Tracking, Traffic Statistics, Knowledge Base, Language Translation, Page counters, Personalisation, Search Engine, User Guest book, Visitor statistics, Cell Phone Optimisations, Palm PDA Web Clipping.
5 Academic, Corporate, eCommerce, eTrading, Educational, Entertainment, Extranet, Family, Functional, Intranet, Media,
Multimedia Presentation, News and Information, Non-Profit, Online community/forum, One Page Presence, Personal, Political, Portal (vertical or horizontal), Professional, Promotional, Search engine, Short-Term Promotion, Small Business, Support site/video chat, Virtual marketplace (B2B)
6 T1 or better, DSL, IDSN, Dial Up (56K), Dial Up (33.6K)
7 Business people and professionals, mainly women, mainly men, teenagers and twenty something, children, students,
college or trade schools, anyone and everyone
8 whimsical, bright and vivid, techno-futuristic, gritty, aggressive, mass-consumer oriented, really 'clean' looking,
sports-oriented, fun and wacky, for women only, other
9 primary colours, pastel colours
10 solid colour background, image background 11 light colour pages, dark colour pages