PROBABILISTIC SEISMIC HAZARD ANALYSIS: A SENSITIVITY STUDY WITH RESPECT TO DIFFERENT MODELS
A THESIS SUBMITTED TO
THE GRADUATE SCHOOL OF NATURAL AND APPLIED SCIENCES OF
MIDDLE EAST TECHNICAL UNIVERSITY
BY
NAZAN YILMAZ ÖZTÜRK
IN PARTIAL FULFILLMENT OF THE REQUIREMENTS FOR
THE DEGREE OF DOCTOR OF PHILOSOPHY IN
CIVIL ENGINEERING
Approval of the thesis:
PROBABILISTIC SEISMIC HAZARD ANALYSIS: A SENSITIVITY STUDY WITH RESPECT TO DIFFERENT MODELS
submitted by NAZAN YILMAZ ÖZTÜRK in partial fulfillment of the
requirements for the degree of Doctor of Philosophy in Civil Engineering Department, Middle East Technical University by,
Prof. Dr. Canan Özgen _____________________ Dean, Graduate School of Natural and Applied Sciences
Prof. Dr. Güney Özcebe _____________________ Head of Department, Civil Engineering
Prof. Dr. M. Semih Yücemen _____________________ Supervisor, Civil Engineering Dept., METU
Examining Committee Members:
Prof. Dr. Ali Koçyiğit _____________________ Geological Engineering Dept., METU
Prof. Dr. M. Semih Yücemen _____________________ Civil Engineering Dept., METU
Prof. Dr. Reşat Ulusay _____________________ Geological Engineering Dept., Hacettepe University
Assoc. Prof. Dr. Ahmet Yakut _____________________ Civil Engineering Dept., METU
Assoc. Prof. H. Şebnem Düzgün _____________________ Mining Engineering Dept., METU
I hereby declare that all information in this document has been obtained and presented in accordance with academic rules and ethical conduct. I also declare that, as required by these rules and conduct, I have fully cited and referenced all material and results that are not original to this work.
Name, Last name : Nazan Yılmaz Öztürk
ABSTRACT
PROBABILISTIC SEISMIC HAZARD ANALYSIS: A SENSITIVITY
STUDY WITH RESPECT TO DIFFERENT MODELS
Yılmaz Öztürk, Nazan
Ph.D., Department of Civil Engineering Supervisor: Prof. Dr. M. Semih Yücemen
February 2008, 253 pages
Due to the randomness inherent in the occurrence of earthquakes with respect to time, space and magnitude as well as other various sources of uncertainties, seismic hazard assessment should be carried out in a probabilistic manner.
Basic steps of probabilistic seismic hazard analysis are the delineation of seismic sources, assessment of the earthquake occurrence characteristics for each seismic source, selection of the appropriate ground motion attenuation relationship and identification of the site characteristics. Seismic sources can be modeled as area and line sources. Also, the seismic activity that can not be related with any major seismic sources can be treated as background source in which the seismicity is assumed to be uniform or spatially smoothed. Exponentially distributed magnitude and characteristic earthquake models are often used to describe the magnitude recurrence relationship. Poisson and renewal models are used to model the occurrence of earthquakes in the time domain.
In this study, the sensitivity of seismic hazard results to the models associated with the different assumptions mentioned above is investigated. The effects of different sources of uncertainties involved in probabilistic seismic hazard analysis methodology to the results are investigated for a number of sites with different distances to a single fault. Two case studies are carried out to examine the influence of different assumptions on the final results based on real data as well as to illustrate the implementation of probabilistic seismic hazard analysis methodology for a large region (e.g. a country) and a smaller region (e.g. a province).
Keywords: Seismic Hazard, Seismic Source, Magnitude Distribution, Renewal, Poisson, Earthquake.
ÖZ
OLASILIKSAL S
İ
SM
İ
K TEHL
İ
KE ANAL
İ
Z
İ
: DE
ĞİŞİ
K
MODELLERE GÖRE DUYARLILIK ÇALI
Ş
MASI
Yılmaz Öztürk, Nazan
Doktora, İnşaat Mühendisliği Bölümü Tez Yöneticisi: Prof. Dr. M. Semih Yücemen
Şubat 2008, 253 sayfa
Deprem oluşumlarının zaman, yer ve büyüklük bakımından gösterdikleri rassallık ve diğer çeşitli belirsizlikler nedeniyle sismik tehlikenin belirlenmesi olasılığa dayanan yöntemlerle yapılmalıdır.
Olasılıksal sismik tehlike analizinin başlıca adımları sismik kaynakların ve bu kaynakların her biri için deprem oluşum özelliklerinin belirlenmesi, uygun azalım ilişkisinin seçilmesi ve sahadaki zemin özelliklerinin saptanmasıdır. Sismik kaynaklar alan ve çizgi kaynaklar olarak modellenebilir. Ayrıca, herhangi bir ana sismik kaynak ile ilişkilendirilemeyen sismik etkinlik, depremselliğin bir biçimli ya da mekansal olarak yaygınlaştırılmış olduğu kabul edilen arka plan kaynak olarak incelenebilir. Üstel dağılımlı büyüklük ve karakteristik deprem modelleri büyüklük-tekrarlanma ilişkilerini tanımlamak için en sık kullanılanlardır. Poisson ve yinelenme modelleri depremlerin zaman uzayındaki oluşumlarını modellemek için kullanılmaktadır.
Bu çalışmada sismik tehlike sonuçlarının yukarıda bahsedilen değişik varsayımlarla ilişkilendirilen modellere duyarlılığı araştırılmıştır. Olasılıksal sismik tehlike analizindeki değişik belirsizliklerin sonuçlara etkileri bir faydan oluşan sismik kaynağa değişik uzaklıklarda yer alan birkaç saha için araştırılmıştır. Değişik varsayımların nihai sonuçlara olan etkisini gerçek veriye dayalı olarak incelemek ve olasılıksal sismik tehlike yönteminin büyük (bir ülke gibi) ve daha küçük bir bölgenin (bir kent gibi) sismik tehlikesinin belirlenmesi için uygulanmasını
göstermek amacıyla iki örnek çalışma yapılmıştır.
Anahtar Kelimeler: Sismik Tehlike, Sismik Kaynak, Büyüklük Dağılımı, Yinelenme, Poisson, Deprem.
ACKNOWLEDGEMENTS
This study was accomplished under the supervision of Prof. Dr. M. Semih Yücemen. I would like to thank him for his continuous guidance, advice, patience, and support throughout the period of this study. His supervision made my biggest academic achievement possible. I am grateful to him for making my way to the academic world.
I want to thank Assoc. Prof. Dr. Ahmet Yakut and Assoc. Prof. Dr. H. Şebnem Düzgün for their valuable suggestions and encouraging comments during the progress of this dissertation.
I would like to thank Prof. Dr. Ali Koçyiğit from the Geological Engineering Department, for his contributions towards my understanding of tectonics and in particular, sharing his knowledge on the faults located in Turkey with me.
I want to thank Prof. Dr. Reşat Ulusay for his detailed review of the manuscript of this dissertation and his valuable suggestions.
This thesis started in the structural mechanics laboratory of Civil Engineering Department. I would like to thank all my friends from the lab for their help and support.
The majority of this study is carried at the Earthquake Engineering Research Center (EERC) at METU. I want to thank to Prof. Dr. M. Semih Yücemen once again for providing the office there and Asst. Prof. Dr. Altuğ Erberik and İlker Kazaz for their supports during all stages of this dissertation.
Special thanks go to my lifelong friend (or my little sister) Dr. Ayşegül Askan-Gündoğan for being nearby in the beginning of this study as well as catching up in
the end. In the mean time, via long-distance phone calls, she proved me that distances do not matter in friendships.
I would like to thank Dr. Erol Kalkan for devoting his time and sharing the documents on the subject of this study and the code for spatially smoothed seismicity model.
My good friends; Eser Tosun, Selim Günay, Berna Unutmaz, Emriye Kazaz, Sermin Oğuz Topkaya, Sergen Bayram and Altuğ Bayram, deserve thanks for their support and patience.
I also would like to extend my thanks to the staff of the Earthquake Research Department at the General Directorate of Disaster Affairs, especially Dr. Murat Nurlu, current director of the Laboratory Division, for his support and understandings. I owe thanks to Cenk Erkmen, Hakan Albayrak, Tülay Uran, Tuğbay Kılıç and Ulubey Çeken for their theoretical and technical supports.
I would like to thank my father, mother, sister and brother for their love, understanding and encouragement throughout my life and for forgiving me for all the postponed get-togethers with them. I promise to make up for those times after I finish.
Finally, I would like to give my thanks to my husband for his invaluable support during this long period.
TABLE OF CONTENTS
ABSTRACT………... iv ÖZ……….. vi ACKNOWLEDGEMENTS………...ix TABLE OF CONTENTS………...xi LIST OF TABLES………....xv LIST OF FIGURES………xvii CHAPTER 1. INTRODUCTION………..1 1.1 GENERAL………...1 1.2 LITERATURE SURVEY………21.3 OBJECTIVES AND SCOPE OF THE STUDY………. 6
2. ALTERNATIVE MODELS APPLIED IN SEISMIC HAZARD ANALYSIS……….8
2.1 INTRODUCTION………... 8
2.2 DETERMINISTIC SEISMIC HAZARD ANALYSIS………... 9
2.3 PROBABILISTIC SEISMIC HAZARD ANALYSIS……….. 13
2.3.1 Seismic Sources………... 14
2.3.2 Magnitude Recurrence Relationship………... 20
2.3.3 Modeling of Earthquake Occurrences………. 25
2.3.4 Attenuation Relationships (Ground Motion Prediction Equations)………... 30
2.3.4.1 Attenuation Models Developed for Other Countries…. 31 2.3.4.1.1 Abrahamson and Silva (1997)………... 31
2.3.4.1.2 Boore et al. (1997)………. 34
2.3.4.1.3 Sadigh et al. (1997)……… 36
2.3.4.2 Attenuation Models Developed for Turkey…………... 43
2.3.4.2.1 İnan et al. (1996)………43
2.3.4.2.2 Aydan et al. (1996) and Aydan (2001)……... 43
2.3.4.2.3 Gülkan and Kalkan (2002), Kalkan and Gülkan (2004)……….44
2.3.4.2.4 Özbey et al. (2004)………. 47
2.3.4.2.5 Ulusay et al. (2004)………48
2.3.5 Seismic Hazard Calculations………... 50
2.3.6 Consideration of Uncertainties……… 51
2.3.6.1 Uncertainty Due to Attenuation Equation……….. 52
2.3.6.2 Uncertainty in the Spatial Distribution of Earthquakes..60
2.3.6.3 Uncertainty in the Magnitude Distribution……… 77
2.3.6.4 Uncertainty in the Temporal Distribution of Earthquakes……… 80
2.3.6.5 Uncertainties in Earthquake Catalogs………. 87
2.3.7 Logic Tree Methodology………. 87
2.3.8 Deaggregation of Seismic Hazard………... 90
3. CASE STUDY FOR A COUNTRY: SEISMIC HAZARD MAPPING FOR JORDAN……….. 93
3.1 INTRODUCTION………. 93
3.2 PREVIOUS PROBABILISTIC SEISMIC HAZARD ASSESSMENT STUDIES FOR JORDAN………..94
3.3 ASSESSMENT OF SEISMIC HAZARD FOR JORDAN……… 96
3.3.1 Seismic Database and Seismic Sources………... 96
3.3.1.1 Seismic Database……… 96
3.3.1.2 Seismic Sources……….. 99
3.3.2 Alternative Models………. 103
3.3.2.1 Model 1………. 103
3.3.2.2 Model 2 and Model 3………....104
3.3.2.3 Model 4………. 105
3.3.4 “Best Estimate” Seismic Hazard Maps for Jordan………. 135
4. CASE STUDY FOR A REGION: SEISMIC HAZARD MAPPING FOR THE BURSA PROVINCE………. 145
4.1 INTRODUCTION………145
4.2 PREVIOUS PROBABILISTIC SEISMIC HAZARD ASSESSMENT STUDIES FOR BURSA……….. 146
4.3 ASSESSMENT OF SEISMIC HAZARD FOR BURSA……….147
4.3.1 Seismic Database and Seismic Sources………. 147
4.3.1.1 Seismic Database……….. 147
4.3.1.2 Seismic Sources……… 150
4.3.2 Methodology……….. 151
4.3.2.1 Seismic Hazard Resulting From Background Seismic Activity………. 154
4.3.2.2 Seismic Hazard Resulting From Faults……… 173
4.3.3 “Best Estimate” of Seismic Hazard for the Bursa Province….. 187
5. SUMMARY AND CONCLUSIONS………. 196
5.1 SUMMARY………. 196
5.2 DISCUSSION OF RESULTS AND MAIN CONCLUSIONS……... 197
5.3 RECOMMENDATIONS FOR FUTURE STUDIES……….. 202
REFERENCES………205
APPENDICES A. GRAPHS SHOWING THE DIFFERENCE BETWEEN THE SEISMIC HAZARD RESULTS OBTAINED BY IGNORING AND CONSIDERING RUPTURE LENGTH UNCERTAINTY………... 217
B. EARTHQUAKE CATALOG PREPARED FOR JORDAN………. 225
C. SEISMIC HAZARD MAPS FOR JORDAN BASED ON DIFFERENT MODELS………. 230
D. MAIN SEISMIC DATABASE COMPILED FOR BURSA FROM THE CATALOGS OF EARTHQUAKE RESEARCH DEPARTMENT, GENERAL DIRECTORATE OF DISASTER AFFAIRS………. 237
E. MAIN SHOCK SEISMIC DATABASE COMPILED FOR BURSA FROM THE CATALOGS OF EARTHQUAKE RESEARCH DEPARTMENT, GENERAL DIRECTORATE OF DISASTER
AFFAIRS………... 246 CURRICULUM VITAE ……… 251
LIST OF TABLES
TABLES
Table 2.1 Parameters of the Fault and the Scenario Earthquake Model Used for İstanbul in This Study (JICA, 2002)………... 11 Table 2.2 Mean and Median PGA Values Estimated at the Site by Using
Different Attenuation Relationships for Rock Site Condition in
DSHA………12 Table 2.3 Coefficients for the Average Horizontal Component
(Abrahamson and Silva, 1997)………. 35 Table 2.4 Smoothed Coefficients for Pseudo-Acceleration Response
Spectra (g) (Boore et al., 1997)……….37 Table 2.5 Coefficients for Rock Sites with Mw ≤ 6.5 (Sadigh et al., 1997)……. 39 Table 2.6 Coefficients for Rock Sites with Mw > 6.5 (Sadigh et al., 1997)……. 39 Table 2.7 Dispersion Relationships for Horizontal Rock Motion (Sadigh et al.,
1997)………. 40 Table 2.8 Coefficients for Deep Soil Sites (Sadigh et al., 1997)……….. 40 Table 2.9 Coefficients of the Attenuation Relationship Proposed by
Ambraseys et al. (1996)……… 42 Table 2.10 Coefficients of Attenuation Relationships Developed by Gülkan and
Kalkan (2002)………... 45 Table 2.11 Coefficients of Attenuation Relationships Developed by Kalkan and
Gülkan (2004)………... 46 Table 2.12 Site Class Definitions Used by Özbey et al. (2004)………..48 Table 2.13 Attenuation Coefficients in the Equation Proposed by
Özbey et al. (2004)………....49 Table 2.14 Examples of Uncertainties in Seismic Hazard Analysis
Table 2.15 Relationships between Magnitude and Rupture Length………61 Table 2.16 Parameters of the Darıca, Adalar, Yeşilköy and Kumburgaz
Segments………....68 Table 2.17 Calculations of Multi-Segment and Individual Segment
Probabilities According to the Cascade Methodology Defined by Cramer et al. (2000)………...71 Table 3.1 Space and Time Windows to Identify Secondary Events
(After Deniz and Yücemen, 2005)……… 98 Table 3.2 Parameters of Seismic Sources Considered in Model 1………..104 Table 3.3 Parameters of Seismic Sources Considered in Model 2 and
Model 3………105 Table 3.4 Parameters of Seismic Sources Considered in Model 4………..108 Table 3.5 PGA and SA (0.2 sec and 1.0 sec) Values Corresponding to
Different Return Periods for the Four Sites According to
Different Assumptions (in g)………...123 Table 4.1 b, β and ν Values Computed According to Alternative
Assumptions for the Background Seismic Activity……… 154 Table 4.2 Maximum PGA Values (in g) Obtained from Background
Area Source with Uniform Seismicity……… 156 Table 4.3 Parameters of the Fault Segments Used in This Study
(Koçyiğit, 2005; Yücemen et al., 2006)……….. 174 Table 4.4 Subjective Probabilities Assigned to Different Assumptions………. 187 Table B.1 Main Shocks in the Earthquake Catalog Prepared for Jordan……….225 Table D.1 All Earthquakes in the Seismic Database Compiled for Bursa……... 237 Table E.1 Mainshocks in the Seismic Database Compiled for Bursa…………..246
LIST OF FIGURES
FIGURES
Figure 2.1 Schematic Description of DSHA for a Site………... 10 Figure 2.2 Map Showing the Location of the Fault (F) Forming the Basis
for the Scenario Earthquake Model Used for İstanbul in
This Study (JICA, 2002)………11 Figure 2.3 Schematic Description of the Classical PSHA Methodology………... 15 Figure 2.4 Linear, Bilinear and Parabolic Magnitude Recurrence Relationships
(Yücemen, 1982)………... 23 Figure 2.5 Characteristic Earthquake Model Proposed by
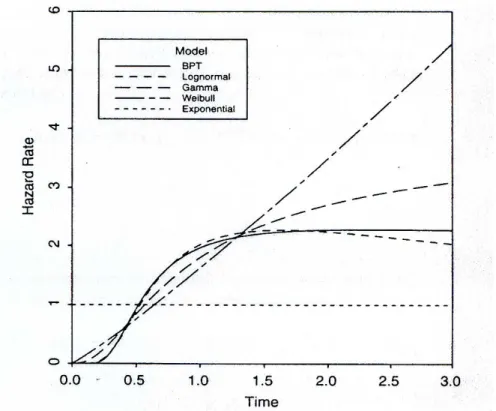
Youngs and Coppersmith (1985)………...24 Figure 2.6 Hazard Rate Functions for Different Inter-Event Time Distributions
(Matthews et al., 2002)……….. 28 Figure 2.7 Median Peak Ground Acceleration (PGA) Curve Predicted for
Kocaeli, 1999 Earthquake by Using Kalkan and Gülkan (2004) Attenuation Relationship at Rock Sites; Distribution of PGA Values at 1 km Distance and the Recorded Data……….. 53 Figure 2.8 (a) Probability Density Function of Ground Motion Parameter, Y,
for a Single Scenario, (b) Complementary Cumulative Distribution Function Describing the Probability of Ground Motion Parameter Exceeding the Level, Y, for a Single Scenario……….. 54 Figure 2.9 Probability Density Functions Corresponding to Different
Values of σln(PGA)………... 55
Figure 2.10 Hazard Curves Corresponding to Different Values of σln(PGA)……….. 56
Figure 2.11 Probability Density Functions of PGA Truncated at Different
Figure 2.12 Hazard Curves Corresponding to Truncation of Attenuation
Residuals at Different Levels……….... 58 Figure 2.13 Hazard Curves Obtained by Using Different Attenuation
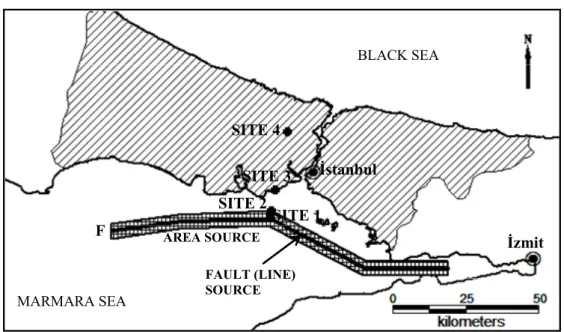
Relationships………. 59 Figure 2.14 Locations of Fault and Sites Considered in the Analyses
Performed to Investigate the Effect of Rupture Length
Uncertainty on Seismic Hazard Results………63 Figure 2.15 Differences in Seismic Hazard Values Obtained for Site 1c by
Using Different Values of Standard Deviation for Logarithm of
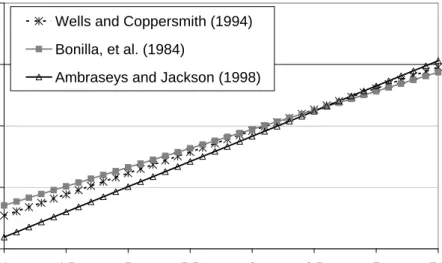
Rupture Length……….. 65 Figure 2.16 Variation of Rupture Length as a Function of Earthquake
Magnitude According to the Relationships Proposed by Wells and Coppersmith (1994), Bonilla, et al. (1984) and Ambraseys
and Jackson(1998)………. 66 Figure 2.17 Seismic Hazard Curves Obtained for Site 1c by Using Different
Rupture Length Estimation Equations for Magnitude 5 Earthquake… 66 Figure 2.18 Locations of Darıca (D), Adalar (A), Yeşilköy (Y) and
Kumburgaz (K) Segments (Yücemen et al., 2006)………... 67 Figure 2.19 Seismic Hazard Curves Obtained by Considering Segmentation
Concept and Fault-Rupture Model……… 69 Figure 2.20 Seismic Hazard Curves Obtained for the Three Sites by Using
Cascade and Fault Segmentation Models……….. 72 Figure 2.21 Locations of Sites, Line (Fault) Source and Area Source
Representing the Fault………... 73 Figure 2.22 Seismic Hazard Curves Obtained by Using Area and
Line (Fault) Source Models………... 74 Figure 2.23 Probability Density Functions Corresponding to Truncated
Exponential Distribution (TED) and Characteristic Earthquake
Figure 2.24 Probability Density Functions Corresponding to Purely Characteristic Earthquake Model (PCEM) and Truncated Gaussian Distribution (TGD) for Characteristic Magnitudes and Truncated Exponential Distribution (TED) for Smaller
Magnitudes……… 79 Figure 2.25 Seismic Hazard Curves for Site 4 Corresponding to: Truncated
Exponential Distributions for 4.5<m<7.5 (TED); Characteristic Earthquake Model (CEM) with Varying Δm values;
Purely Characteristic Earthquake Model Combined with Exponential Distribution for Smaller Magnitudes (4.5≤m≤7.0) (PCEM&TED); Truncated Gaussian Distribution for
Characteristic Magnitudes (7.22≤m≤7.78) Combined with Exponential Distribution for Smaller magnitudes (4.5≤m≤7.0)
(TGD&TED)………. 80 Figure 2.26 Estimated Ruptures (Thick Dashed Green Lines), Modified
Mercalli Intensity (MMI) Values (Yellow Dots), Sites of Damage Potentially Enhanced by Soft Sediments (Red Dots), Moment Magnitude M Needed to Satisfy the Observations for a Given Location (Red Dashed Contours) for Large Earthquakes
Occurred between A.D. 1500 and 2000 (After Parsons, 2004)………. 82 Figure 2.27 Probability Density Functions Corresponding to the BPT and LN
Distributions Based on the Mean Inter-Event Time of
µT =54 years and α=cov=0.5………. 83
Figure 2.28 Hazard Functions Corresponding to the BPT and LN Distributions Based on the Mean Inter-Event Time of
µT =54 years and α=cov=0.5………. 83
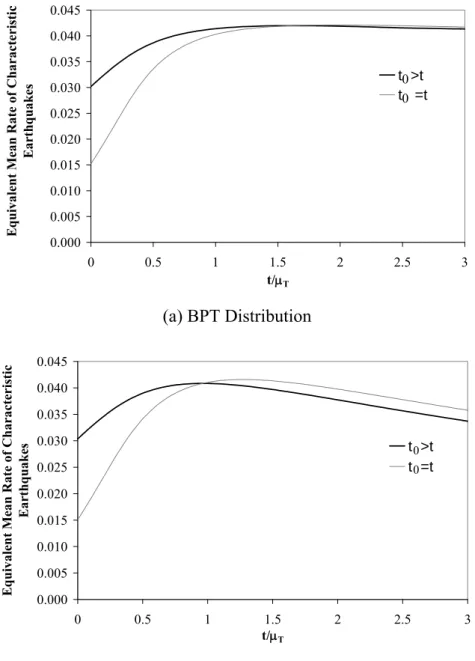
Figure 2.29 Variation of Equivalent Mean Rate of Characteristic
Earthquakes Calculated Based on Eqs. (2.20) and (2.28) for the
Figure 2.30 Seismic Hazard Curves for Site 4 Corresponding to the
Combinations of Renewal Model with PCEM&TED and CEM;
Poisson Model with PCEM and CEM with Δm=1.0………. 86 Figure 2.31 A General Logic Tree (After Risk Engineering, 2006)………. 89 Figure 2.32 Examples of Deaggregation Graphs Obtained from a Seismic
Hazard Analysis Carried Out by Using EZ-FRISK (Risk
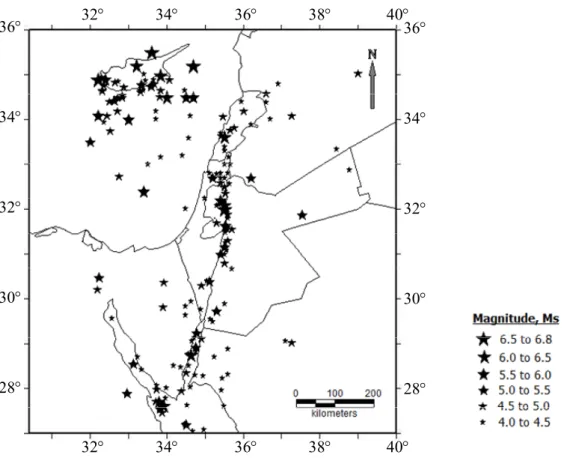
Engineering, 2005)……… 92 Figure 3.1 Map Showing the Spatial Distribution of Main Shocks in the
Catalog Compiled for the Seismic Hazard Assessment of Jordan….. 100 Figure 3.2 Tectonic Setting of Dead Sea Transform Fault System (After
Barazangi, 1983)……….. 101 Figure 3.3 Locations of Area Sources Used in This Study (After
Jiménez, 2004)………. 102 Figure 3.4 Locations of Line Sources Used in This Study (After
Jiménez, 2004)………. 102 Figure 3.5 Map Showing the Distribution of Earthquakes Used in Spatially
Smoothed Seismicity Model and Locations of the Cities for
Which Seismic Hazard are Computed………. 109 Figure 3.6 Magnitude-Recurrence Relationship Derived from the Data Used
in Spatially Smoothed Seismicity Model……… 110 Figure 3.7 Seismic Hazard Curves Obtained for the Site Located in Amman…. 112 Figure 3.8 Seismic Hazard Curves Obtained for the Site Located in Azraq…….112 Figure 3.9 Seismic Hazard Curves Obtained for the Site Located in Aqaba…… 113 Figure 3.10 Seismic Hazard Curves Obtained for the Site Located in Irbid…….. 113 Figure 3.11 Contributions of the Different Seismic Sources to the Seismic
Hazard at the Site Located in Amman………. 114 Figure 3.12 Contributions of the Different Seismic Sources to the Seismic
Hazard at the Site Located in Azraq……… 116 Figure 3.13 Contributions of the Different Seismic Sources to the Seismic
Figure 3.14 Contributions of the Different Seismic Sources to the Seismic
Hazard at the Site Located in Irbid………..120 Figure 3.15 Seismic Hazard Map for PGA (in g) Obtained by Using Spatially
Smoothed Seismicity Model for a Return Period of 475 Years…….. 127 Figure 3.16 Seismic Hazard Map for PGA (in g) Obtained by Using Spatially
Smoothed Seismicity Model for a Return Period of 1000 Years…… 127 Figure 3.17 Seismic Hazard Map for PGA (in g) Obtained by Using Spatially
Smoothed Seismicity Model for a Return Period of 2475 Years…… 128 Figure 3.18 Seismic Hazard Map Showing the PGA Values (in g) Obtained
by Using Spatially Smoothed Seismicity Model for a Return Period of 2475 Years and Epicenters of Earthquakes Considered in the
Assessment of Seismic Hazard……… 128 Figure 3.19 Map Showing the Spatial Variation of the Difference between
PGA Values Obtained by Using Spatially Smoothed Seismicity Model and Background Seismic Source with Uniform Seismicity for a Return Period of 2475 Years and Epicenters of Earthquakes…. 129 Figure 3.20 Map Showing the Spatial Variation of the Difference between
the PGA Values Obtained from Model 2 and Model 1 for a Return Period of 475 Years………. 129 Figure 3.21 Map Showing the Spatial Variation of the Difference between
the PGA Values Obtained from Model 2 and Model 1 for a Return Period of 2475 Years………... 130 Figure 3.22 Map Showing the Spatial Variation of the Difference between
the PGA Values Obtained from Model 2 and Model 1 for a Return Period of 2475 Years and Locations of Area Seismic Sources
(Dashed Black Lines) and Line Sources (Black Lines)………... 130 Figure 3.23 Map Showing the Spatial Variation of the Difference between
the PGA Values Obtained from Model 3 and Model 2 for a Return Period of 475 Years………. 131
Figure 3.24 Map Showing the Spatial Variation of the Difference between the PGA Values Obtained from Model 3 and Model 2 for a Return Period of 2475 Years………... 131 Figure 3.25 Map Showing the Spatial Variation of the Difference between
the PGA Values Obtained from Model 3 and Model 2 for a Return Period of 2475 Years and Locations of Line Sources (Black Lines).. 132 Figure 3.26 Map Showing the Spatial Variation of the Difference between
the PGA Values Obtained from Model 4 and Model 3 for a Return Period of 475 Years………. 132 Figure 3.27 Map Showing the Spatial Variation of the Difference between
the PGA Values Obtained from Model 4 and Model 3 for a Return Period of 2475 Years………... 133 Figure 3.28 Map Showing the Spatial Variation of the Difference between
the PGA Values Obtained from Model 4 and Model 3 for a Return Period of 2475 Years and Locations of Line Sources (Black Lines) and Epicenters of Earthquakes Considered in Spatially
Smoothed Seismicity Model……… 133 Figure 3.29 Logic Tree Formulation for the Combinations of Different
Assumptions (The values given in the parentheses are the subjective probabilities assigned to the corresponding
assumptions.)………... 136 Figure 3.30 Best Estimate Seismic Hazard Map of Jordan for PGA (in g)
Corresponding to 10% Probability of Exceedance in 50 Years
(475 Years Return Period)………... 137 Figure 3.31 Best Estimate Seismic Hazard Map of Jordan for PGA (in g)
Corresponding to 5% Probability of Exceedance in 50 Years
(1000 Years Return Period)………. 137 Figure 3.32 Best Estimate Seismic Hazard Map of Jordan for PGA (in g)
Corresponding to 2% Probability of Exceedance in 50 Years
Figure 3.33 Best Estimate Seismic Hazard Map of Jordan for SA at 0.2 sec (in g) Corresponding to 10% Probability of Exceedance in
50 Years (475 Years Return Period)………....138 Figure 3.34 Best Estimate Seismic Hazard Map of Jordan for SA at 0.2 sec
(in g) Corresponding to 5% Probability of Exceedance in
50 Years (1000 Years Return Period)………..139 Figure 3.35 Best Estimate Seismic Hazard Map of Jordan for SA at 0.2 sec
(in g) Corresponding to 2% Probability of Exceedance in
50 Years (2475 Years Return Period)………..139 Figure 3.36 Best Estimate Seismic Hazard Map of Jordan for SA at 1.0 sec
(in g) Corresponding to 10% Probability of Exceedance in
50 Years (475 Years Return Period)………....140 Figure 3.37 Best Estimate Seismic Hazard Map of Jordan for SA at 1.0 sec
(in g) Corresponding to 5% Probability of Exceedance in
50 Years (1000 Years Return Period)………..140 Figure 3.38 Best Estimate Seismic Hazard Map of Jordan for SA at 1.0 sec
(in g) Corresponding to 2% Probability of Exceedance in
50 Years (2475 Years Return Period)………..141 Figure 3.39 Best Estimate Seismic Hazard Map of Jordan for SA at 0.2sec
(in g) Corresponding to 2% Probability of Exceedance in
50 Years (2475 Years Return Period) and Locations of Faults……... 142 Figure 3.40 Seismic Hazard Maps Derived for PGA with 10% Probability of
Exceedance in 50 Years by (a) Yücemen (1992) (Values are given in terms of %g) (b) Al-Tarazi and Sandvol (2007) (Values are given in terms of cm/sec2) (c) This study
(Values are given in terms of g)……….. 143 Figure 4.1 Map Showing the Locations of Faults (Thick Lines in Various
Colors) Considered in This Study (Yücemen et al., 2006; Koçyiğit, 2005; Koçyiğit, 2006; Emre and Awata (2003),
Figure 4.2 Map Showing the Faults (Thick Black Lines) and the Spatial
Distribution of All Earthquakes………... 153 Figure 4.3 Map Showing the Faults (Thick Black Lines) and the Spatial
Distribution of Main Shocks………153 Figure 4.4 Schematic Description of the Procedure Utilized in the
Assessment of Background Seismic Activity……….. 157 Figure 4.5 Seismic Hazard Curves Obtained by Using Spatially Smoothed
Seismicity Model with; (a) Main Shocks in the Incomplete
Database, (b) All Earthquakes in the Incomplete Database, (c) Main Shocks and Adjusting for Incompleteness, (d) All Earthquakes and Adjusting for Incompleteness and by Using Uniform Seismicity with; (e) Main Shocks in the Incomplete Database, (f) All Earthquakes in the Incomplete Database, (g) Main Shocks and Adjusting for Incompleteness, (h) All Earthquakes and Adjusting for
Incompleteness……… 158 Figure 4.6 Seismic Hazard Maps for PGA (in g) Corresponding to the
Return Period of 475 Years Obtained by Using Spatially Smoothed Seismicity Model with Main Shocks (a) Incomplete
Database (b) Database Adjusted for Incompleteness……….. 159 Figure 4.7 Seismic Hazard Maps for PGA (in g) Corresponding to the
Return Period of 475 Years Obtained by Using Spatially
Smoothed Seismicity Model with All Earthquakes (a) Incomplete Database (b) Database Adjusted for Incompleteness……….. 160 Figure 4.8 Seismic Hazard Maps for PGA (in g) Corresponding to the
Return Period of 1000 years Obtained by Using Spatially Smoothed Seismicity Model with Main Shocks (a) Incomplete
Database (b) Database Adjusted for Incompleteness……….. 161 Figure 4.9 Seismic Hazard Maps for PGA (in g) Corresponding to the
Return Period of 1000 years Obtained by Using Spatially
Smoothed Seismicity Model with All Earthquakes (a) Incomplete Database (b) Database Adjusted for Incompleteness……….. 162
Figure 4.10 Seismic Hazard Maps for PGA (in g) Corresponding to the Return Period of 2475 years Obtained by Using Spatially Smoothed Seismicity Model with Main Shocks (a) Incomplete
Database (b) Database Adjusted for Incompleteness……….. 163 Figure 4.11 Seismic Hazard Maps for PGA (in g) Corresponding to the
Return Period of 2475 years Obtained by Using Spatially
Smoothed Seismicity Model with All Earthquakes (a) Incomplete Database (b) Database Adjusted for Incompleteness……….. 164 Figure 4.12 Map Showing the Spatial Variation of the Difference between
the PGA Values Obtained from Spatially Smoothed Seismicity Model and Background Area Source with Main Shocks and
Incomplete Database for a Return Period of 475 Years……….. 167 Figure 4.13 Map Showing the Spatial Variation of the Difference between
the PGA Values Obtained from Spatially Smoothed Seismicity Model and Background Area Source with Main Shocks and
Incomplete Database for a Return Period of 2475 Years……… 167 Figure 4.14 Map Showing the Spatial Variation of the Difference between
the PGA Values Obtained from Spatially Smoothed Seismicity Model and Background Area Source with Main Shocks and Incomplete Database for a Return Period of 2475 Years and Epicenters of Earthquakes Considered in Spatially Smoothed
Seismicity Model………. 168 Figure 4.15 Map Showing the Spatial Variation of the Difference between
the PGA Values Obtained from Spatially Smoothed Seismicity Model and Background Area Source with Main Shocks and Database Adjusted for Incompleteness for a Return Period of 475 Years……… 168
Figure 4.16 Map Showing the Spatial Variation of the Difference between the PGA Values Obtained from Spatially Smoothed Seismicity Model and Background Area Source with Main Shocks and Database Adjusted for Incompleteness for a Return Period of 2475 Years……… 169 Figure 4.17 Map Showing the Spatial Variation of the Difference between
the PGA Values Obtained from Spatially Smoothed Seismicity Model and Background Area Source with Main Shocks and Database Adjusted for Incompleteness for a Return Period of 2475 Years and Epicenters of Earthquakes Considered in Spatially
Smoothed Seismicity Model……… 169 Figure 4.18 Map Showing the Spatial Variation of the Difference between
the PGA Values Obtained from Spatially Smoothed Seismicity Model and Background Area Source with All Earthquakes and
Incomplete Database for a Return Period of 475 Years……….. 170 Figure 4.19 Map Showing the Spatial Variation of the Difference between
the PGA Values Obtained from Spatially Smoothed Seismicity Model and Background Area Source with All Earthquakes and
Incomplete Database for a Return Period of 2475 Years……… 170 Figure 4.20 Map Showing the Spatial Variation of the Difference between
the PGA Values Obtained from Spatially Smoothed Seismicity Model and Background Area Source with All Earthquakes and Incomplete Database for a Return Period of 2475 Years and Epicenters of Earthquakes Considered in Spatially Smoothed
Seismicity Model………. 171 Figure 4.21 Map Showing the Spatial Variation of the Difference between
the PGA Values Obtained from Spatially Smoothed Seismicity Model and Background Area Source with All Earthquakes and Database Adjusted for Incompleteness for a Return Period of 475 Years……… 171
Figure 4.22 Map Showing the Spatial Variation of the Difference between the PGA Values Obtained from Spatially Smoothed Seismicity Model and Background Area Source with All Earthquakes and Database Adjusted for Incompleteness for a Return Period of 2475 Years……… 172 Figure 4.23 Map Showing the Spatial Variation of the Difference between
the PGA Values Obtained from Spatially Smoothed Seismicity Model and Background Area Source with All Earthquakes and Database Adjusted for Incompleteness for a Return Period of 2475 Years and Epicenters of Earthquakes Considered in Spatially
Smoothed Seismicity Model……… 172 Figure 4.24 Seismic Hazard Curves Obtained by Using Fault Segments: with
Poisson Model and Attenuation Relationships proposed by (a) Boore et al. (1997); (b) Kalkan and Gülkan (2004); and with Renewal Model and Attenuation Relationships proposed
by (c) Boore et al. (1997); (d) Kalkan and Gülkan (2004)………….. 179 Figure 4.25 Contributions of Different Faults to Seismic Hazard under the
Assumption of (a) Poisson Model and (b) Renewal Model………… 180 Figure 4.26 Seismic Hazard Map Obtained for PGA (in g) Corresponding to
the Return Period of 475 Years (10% Probability of Exceedance in 50 Years) by Considering Only Faults with (a) Poisson Model, (b) Renewal Model……….. 181 Figure 4.27 Seismic Hazard Map Obtained for PGA (in g) Corresponding to
the Return Period of 1000 Years (5% Probability of Exceedance in 50 Years) by Considering Only Faults with (a) Poisson Model, (b) Renewal Model……….. 182 Figure 4.28 Seismic Hazard Map Obtained for PGA (in g) Corresponding to
a Return Period of 2475 Years (2% Probability of Exceedance in 50 Years) by Considering Only Faults with (a) Poisson Model, (b) Renewal Model……….. 183
Figure 4.29 Map Showing the Spatial Variation of the Difference between the PGA Values Obtained from Renewal and Poisson Models
for a Return Period of 475 Years………. 185 Figure 4.30 Map Showing the Spatial Variation of the Difference between
the PGA Values Obtained from Renewal and Poisson Models
for a Return Period of 2475 Years………... 185 Figure 4.31 Map Showing the Spatial Variation of the Difference between
the PGA Values Obtained from Renewal and Poisson Models for a Return Period of 2475 Years and Faults (Thick Black,
Dark Blue, Dark Green Lines)………. 186 Figure 4.32 Seismic Hazard Curves Resulting from Background Seismic
Activity and Faults and the “Best estimate” Seismic Hazard Curve for the Site (40.24° N, 29.08° E) at the City Center of Bursa………. 188 Figure 4.33 Best Estimate Seismic Hazard Map of Bursa Province for PGA
(in g) Corresponding to the Return Period of 475 Years (10%
Probability of Exceedance in 50 Years)……….. 188 Figure 4.34 Best Estimate Seismic Hazard Map of Bursa Province for PGA
(in g) Corresponding to the Return Period of 1000 Years (5%
Probability of Exceedance in 50 Years)……….. 189 Figure 4.35 Best Estimate Seismic Hazard Map of Bursa Province for PGA
(in g) Corresponding to the Return Period of 2475 Years (2%
Probability of Exceedance in 50 Years)……….. 189 Figure 4.36 Best Estimate Seismic Hazard Map of Bursa Province for SA
at 0.2 sec (in g) Corresponding to the Return Period of 475 Years (10% Probability of Exceedance in 50 Years)……….190 Figure 4.37 Best Estimate Seismic Hazard Map of Bursa Province for SA
at 0.2 sec (in g) Corresponding to the Return Period of 1000 Years (5% Probability of Exceedance in 50 Years)………...190 Figure 4.38 Best Estimate Seismic Hazard Map of Bursa Province for SA
at 0.2 sec (in g) Corresponding to the Return Period of 2475 Years (2% Probability of Exceedance in 50 Years)………...191
Figure 4.39 Best Estimate Seismic Hazard Map of Bursa Province for SA at 1.0 sec (in g) Corresponding to the Return Period of 475 Years (10% Probability of Exceedance in 50 Years)……….191 Figure 4.40 Best Estimate Seismic Hazard Map of Bursa Province for SA
at 1.0 sec (in g) Corresponding to the Return Period of 1000 Years (5% Probability of Exceedance in 50 Years)………...192 Figure 4.41 Best Estimate Seismic Hazard Map of Bursa Province for SA
at 1.0 sec (in g) Corresponding to the Return Period of 2475 Years (2% Probability of Exceedance in 50 Years)………...192 Figure 4.42 Seismic Hazard Map Obtained by Yücemen et al. (2006) for PGA
Corresponding to the Return Period of 475 Years (10%
Probability of Exceedance in 50 Years)……….. 194 Figure 4.43 Seismic Hazard Maps for Bursa Province for PGA Corresponding to
the Return Period of 475 Years (10% Probability of Exceedance in 50 Years) Constructed from the Results of (a) the Study Conducted by Yücemen et al. (2006) (Values are given in terms of g), (b) This Study (Values are given in terms of g); (c) Current Regulatory
Earthquake Zoning Map for Bursa (Özmen et al., 1997)……… 195 Figure A.1 The Variation of the Difference Between the Seismic Hazard
Results Obtained by Ignoring Rupture Length Uncertainty and Considering it As a Function of Number of Rupture Lengths
per Magnitude (Site1a)……… 217 Figure A.2 The Variation of the Difference Between the Seismic Hazard
Results Obtained by Ignoring Rupture Length Uncertainty and Considering it As a Function of Number of Rupture Lengths
per Magnitude (Site5a)……… 218 Figure A.3 The Variation of the Difference Between the Seismic Hazard
Results Obtained by Ignoring Rupture Length Uncertainty and Considering it As a Function of Number of Rupture Lengths
Figure A.4 The Variation of the Difference Between the Seismic Hazard Results Obtained by Ignoring Rupture Length Uncertainty and Considering it As a Function of Number of Rupture Lengths
per Magnitude (Site1b)……….... 219 Figure A.5 The Variation of the Difference Between the Seismic Hazard
Results Obtained by Ignoring Rupture Length Uncertainty and Considering it As a Function of Number of Rupture Lengths
per Magnitude (Site5b)……… 219 Figure A.6 The Variation of the Difference Between the Seismic Hazard
Results Obtained by Ignoring Rupture Length Uncertainty and Considering it As a Function of Number of Rupture Lengths
per Magnitude (Site10b)……….. 220 Figure A.7 The Variation of the Difference Between the Seismic Hazard
Results Obtained by Ignoring Rupture Length Uncertainty and Considering it As a Function of Number of Rupture Lengths
per Magnitude (Site1c)……… 220 Figure A.8 The Variation of the Difference Between the Seismic Hazard
Results Obtained by Ignoring Rupture Length Uncertainty and Considering it As a Function of Number of Rupture Lengths
per Magnitude (Site 5c)………... 221 Figure A.9 The Variation of the Difference Between the Seismic Hazard
Results Obtained by Ignoring Rupture Length Uncertainty and Considering it As a Function of Number of Rupture Lengths
per Magnitude (Site10c)……….. 221 Figure A.10 The Variation of the Difference Between the Seismic Hazard
Results Obtained by Ignoring Rupture Length Uncertainty and Considering it As a Function of Number of Rupture Lengths
Figure A.11 The Variation of the Difference Between the Seismic Hazard Results Obtained by Ignoring Rupture Length Uncertainty and Considering it As a Function of Number of Rupture Lengths
per Magnitude (Site5d)……… 222 Figure A.12 The Variation of the Difference Between the Seismic Hazard
Results Obtained by Ignoring Rupture Length Uncertainty and Considering it As a Function of Number of Rupture Lengths
per Magnitude (Site10d)……….. 223 Figure A.13 The Variation of the Difference Between the Seismic Hazard
Results Obtained by Ignoring Rupture Length Uncertainty and Considering it As a Function of Number of Rupture Lengths
per Magnitude (Site1e)……… 223 Figure A.14 The Variation of the Difference Between the Seismic Hazard
Results Obtained by Ignoring Rupture Length Uncertainty and Considering it As a Function of Number of Rupture Lengths
per Magnitude (Site5e)……… 224 Figure A.15 The Variation of the Difference Between the Seismic Hazard
Results Obtained by Ignoring Rupture Length Uncertainty and Considering it As a Function of Number of Rupture Lengths
per Magnitude (Site10e)……….. 224 Figure C.1 Seismic Hazard Map Obtained from Model 1 for PGA at 10%
Probability of Exceedance in 50 Years (475 Years Return
Period)………. 230 Figure C.2 Seismic Hazard Map Obtained from Model 1 for PGA at 5%
Probability of Exceedance in 50 Years (1000 Years Return
Period)………. 231 Figure C.3 Seismic Hazard Map Obtained from Model 1 for PGA at 2%
Probability of Exceedance in 50 Years (2475 Years Return
Figure C.4 Seismic Hazard Map Obtained from Model 2 for PGA at 10% Probability of Exceedance in 50 Years (475 Years Return
Period)………. 232 Figure C.5 Seismic Hazard Map Obtained from Model 2 for PGA at 5%
Probability of Exceedance in 50 Years (1000 Years Return
Period)………. 232 Figure C.6 Seismic Hazard Map Obtained from Model 2 for PGA at 2%
Probability of Exceedance in 50 Years (2475 Years Return
Period)………. 233 Figure C.7 Seismic Hazard Map Obtained from Model 3 for PGA at 10%
Probability of Exceedance in 50 Years (475 Years Return
Period)………. 233 Figure C.8 Seismic Hazard Map Obtained from Model 3 for PGA at 5%
Probability of Exceedance in 50 Years (1000 Years Return
Period)………. 234 Figure C.9 Seismic Hazard Map Obtained from Model 3 for PGA at 2%
Probability of Exceedance in 50 Years (2475 Years Return
Period)………. 234 Figure C.10 Seismic Hazard Map Obtained from Model 4 for PGA at 10%
Probability of Exceedance in 50 Years (475 Years Return
Period)………. 235 Figure C.11 Seismic Hazard Map Obtained from Model 4 for PGA at 5%
Probability of Exceedance in 50 Years (1000 Years Return
Period)………. 235 Figure C.12 Seismic Hazard Map Obtained from Model 4 for PGA at 2%
Probability of Exceedance in 50 Years (2475 Years Return
CHAPTER 1
INTRODUCTION
1.1 GENERAL
Earthquakes are natural events with random characteristics. The potential effects of future earthquakes can not be exactly assessed but it can be predicted within the probabilistic framework. In its broad sense, seismic hazard estimation includes the investigation of the effects of future potential earthquakes at a site. These effects are the parameters which describe the severity of ground shaking. In the past, intensity was the most commonly used parameter due to lack of instrumentation to measure strong ground motion. After the instruments are developed and installed to record strong ground motion data, peak ground acceleration was started to be used in seismic hazard studies. Peak ground velocity and displacement as well as spectral acceleration at different periods are examples of the other parameters used in recent seismic hazard studies.
Seismic hazard estimation is an essential component for earthquake-resistant design, seismic risk analyses, loss estimation and premium calculations in the insurance industry. Also, it is necessary for the preparation of seismic zoning maps which provide the necessary input information for the design of ordinary structures. The design and estimation of safety of important structures, such as dams, nuclear power plants etc, are performed based on the site specific seismic hazard estimation studies.
Since earthquakes are very complicated phenomena, the assessment of future earthquake threat is not an easy task. Because, it requires characterization of future potential earthquakes as well as generation and propagation of their effects on earth
surface. Therefore, it can be carried out by the combined understanding of earthquakes in several disciplines; such as geology, geophysics, geotechnics, seismology, earthquake and structural engineering, mathematics and statistics. Studies carried out in these disciplines for understanding of earthquake phenomenon and its effects led to the development of procedures followed for seismic hazard estimations and models used in these procedures to describe location, magnitude, probability of future earthquake occurrences and the spatial distributions of their effects. Therefore, seismic hazard estimation is a dynamic work and should be updated in time.
1.2 LITERATURE SURVEY
In literature, there are two basic approaches for seismic hazard assessment: deterministic and probabilistic. Since earthquakes are random events with respect to magnitude, location and time, probabilistic seismic hazard assessment procedures are more appropriate than the deterministic ones in most of the applications.
In the past, seismic hazard was quantified deterministically from maximum earthquake intensity maps constructed by seismologists from the available data on past earthquakes. In 1968, Cornell (1968) proposed a model in which probabilistic approach to estimate seismic hazard was formulated. The results of this model gave the selected seismic hazard parameter versus exceedance probabilities or average return periods corresponding to different levels of this parameter. In the Probabilistic Seismic Hazard Analysis (PSHA) methodology introduced by Cornell (1968), the occurrences of earthquakes in time were assumed to be independent events and follow the memoryless Poisson process. In addition, randomness in the size and location of future earthquakes was also taken into consideration. For this purpose, the size of future earthquakes was assumed to be exponentially distributed. The uncertainty in the location of future earthquakes was incorporated into the analysis by assigning the seismic activity surrounding the site to seismic sources which have potential to generate earthquakes in the future. In this model, the
uncertainty in the attenuation relationship (ground motion prediction equation), which describes the decrease in the intensity of earthquake induced effects with the increase of distance between the site and the earthquake epicenter, was not taken into consideration. Later, Vanmarcke and Cornell (1969) and Cornell (1971) proposed a procedure to incorporate the scatter around the mean attenuation relationship into PSHA computations. Although Cornell (1968) developed this model for seismic hazard assessment of individual sites, it can be used in the development of regional seismic hazard maps by applying it to a grid of points. The pioneering work of Cornell (1968) motivated researchers to develop alternative models for temporal, spatial and magnitude distribution of earthquakes and attenuation relationships as well as computer programs to perform PSHA computations. As a consequence of these developments, PSHA methodology was started to be applied for the assessment of seismic hazard at specific sites where important structures are to be constructed and preparation of seismic hazard and zoning maps in macro-scale. The studies carried out by Cornell and Merz (1974), Gülkan and Yücemen (1975, 1976) and Christian et al. (1978), are the examples of first applications of PSHA for specific sites. On the other hand, Lomnitz (1969), Shah et al. (1975), Kiremidjian and Shah (1975), Gülkan and Gürpınar (1977) and Mortgat and Shah (1978) used the PSHA methodology for seismic zoning mapping purposes. In addition, 1976 national earthquake hazard map of United States was prepared based on the PSHA methodology. Therefore, 1970’s can be accepted as the beginning period in which PSHA methodology was adopted in seismic hazard estimation studies.
Many computer programs have been coded and improved later with developments in computational technology and models in PSHA methodology. EQRISK (McGuire, 1976) was the most widely used one in earlier applications of PSHA methodology. McGuire (1978) improved it under the name of FRISK. Bender and Perkins (1982) developed a computer program, SEISRISK II. It is actually a revised and improved version of the original undocumented program SEISRISK I
(Algermissen et al., 1976), developed during the preparation of the 1976 national earthquake hazard maps. Chiang et al. (1984) developed a computer program, named as STASHA, at Stanford University. Bender and Perkins (1987) revised SEISRISKII and published the improved version as SEISRISKIII. Computer programs were also developed at United States Geological Survey (USGS) by Frankel et al. (1996) during the preparation of the 1996 national seismic hazard maps. EZ-FRISK (Risk Engineering, 2005), CRISIS-2003 (Ordaz et al., 2003), FRISK88M (Risk Engineering, 2006) are the other computer programs which have been used in recent probabilistic seismic hazard estimation studies.
As an alternative to the memoryless Poisson model, time dependent models (such as; Markov, semi-Markov and renewal process models) were developed to model temporal dependence of earthquakes. In the PSHA model developed by Cornell (1968), earthquake magnitudes are assumed to be exponentially distributed based on the linear magnitude recurrence relationship of Richter (1958). Since then, researches were carried out to develop alternative magnitude distributions. The magnitude distributions based on the bilinear (Shah et al., 1975) and quadratic (Shlien and Toksöz, 1970 and Merz and Cornell, 1973) magnitude recurrence relationships were proposed since linear magnitude recurrence relationship overestimates the frequency of large magnitude earthquakes. However, linear model is widely used in probabilistic seismic hazard estimation studies due to the fact that it yields conservative seismic hazard results.
Schwartz and Coppersmith (1984) indicated that some individual faults and fault segments have a tendency to repeatedly generate characteristic earthquakes and proposed the characteristic earthquake model.
Seismic sources have been modeled as point, area and line (fault) sources. In earlier studies, seismic activity in a seismic source (line or area) was assumed to be homogeneous. Fault-rupture, segmentation and cascade models are the mostly used ones in recent seismic hazard assessment studies for earthquake occurrences along faults. On the other hand, spatially smoothed seismicity model (Frankel, 1995) is
used as an alternative to the assumption of uniform seismicity distribution over background area sources. In order to model attenuation characteristics of ground motion, different attenuation relationships (ground motion prediction equations) have been developed for different tectonic regimes and for different ground motion parameters (intensity, peak ground acceleration, peak ground velocity, spectral acceleration, etc.) over the years.
Until 1996, the seismic zoning maps for Turkey were prepared based on deterministic procedures. Gülkan et al. (1993) conducted a study for Turkey to estimate seismic hazard in terms of peak ground acceleration (PGA) for a return period of 475 years. They used area sources with exponentially distributed magnitudes and Poisson model to predict probabilities of occurrence of earthquakes in these sources. Uncertainties in the location of the boundaries of seismic sources were taken into consideration. Seismicity parameters of each source were predicted by using information in the original earthquake catalog and in the artificially completed one. They used the attenuation relationship developed by Joyner and Boore (1981) based on northern U.S. ground motion data. In order to compensate for the use of nonlocal attenuation relationship, they made different analyses by using the mean PGA values calculated by this relationship and adding variations of 0.2 or 0.3 to these values. The results of analyses made according to different assumptions with respect to uncertainty in source boundaries, seismicity parameters and attenuation characteristics of the ground motion were combined by utilizing the theorem of total probability within the framework of logic tree methodology. Regulatory earthquake zoning map of Turkey was prepared based on this study of Gülkan et al. (1993) and became effective in 1996.
Until recently, probabilistic seismic hazard assessment studies carried out for a region or a province in Turkey were limited in number. After the 1999 Kocaeli and Düzce earthquakes, researchers have been motivated on the estimation of seismic hazard for İstanbul, Marmara Region since the future earthquake is expected to occur on the segments of North Anatolian Fault beneath the Marmara Sea and near
the southern boundary of this city. Consequently, the recent investigations on the region or city based estimation of seismic hazard are focused on this region. Studies have been carried out by using different seismic hazard assessment approaches (i.e. deterministic and probabilistic), different attenuation relationships and different models for seismic sources, magnitude distribution and earthquake occurrence in time.
1.3 OBJECTIVES AND SCOPE OF THE STUDY
In this study, it is aimed to investigate the sensitivity of seismic hazard results with respect to different models adopted and assumptions made in probabilistic seismic hazard assessment methodology. In other words, this study is focused on the influence of different assumptions on seismic source modeling, magnitude distribution and stochastic models used for the temporal distribution of earthquakes on seismic hazard results. Depending on the information available, the applicability of different models and effects of them on the seismic hazard results are investigated first for a semi-hypothetical example which includes a number of sites and a single fault. Then, the spatial sensitivity of seismic hazard estimation with respect to different models are examined for a large (a country) and a smaller region (a province) based on real data. In addition, the application of logic tree methodology in the combination of different results obtained from different models and assumptions is illustrated.
After this introductory chapter, in Chapter 2, deterministic and probabilistic seismic hazard estimation procedures and the treatment of uncertainties in PSHA procedure are explained in detail. In addition, the difference in the seismic hazard results obtained by using different procedures, attenuation relationships, source, magnitude distribution and earthquake occurrence models are illustrated for a number of sites under the threat of a single fault. It is to be noted that in recent years, more attention has been paid to the assessment of seismic hazard nucleating from faults. The fact that more reliable values have been obtained for the fault parameters had a
significant effect on this. The seismic hazard assessment procedures taking into consideration the hazard nucleating from active faults and utilizing the more appropriate stochastic models have become the current trend in the development of new generation of seismic hazard maps. In view of this observation, particular emphasis is given on the assessment of seismic hazard due to active faults. For this reason, in this study particular emphasis is given to the presentation and application of various models applicable to the faults, as it is done in Chapter 2.
In Chapters 3, the case study carried out for probabilistic seismic hazard assessment for Jordan is presented. It is generally very difficult both time wise and financially to update seismic hazard maps on the country basis. Accordingly the updating of current seismic hazard maps should be carried out on region or province basis. In view of this opinion, the case study carried out for probabilistic seismic hazard assessment for Bursa province is presented in Chapter 4. Here, particular emphasis is given on the investigation of the sensitivity of results to different assumptions based on real life data.
In Chapter 5, the results obtained in this study are briefly discussed and the main conclusions drawn based on them and recommendations for future studies are presented.
CHAPTER 2
ALTERNATIVE MODELS APPLIED IN SEISMIC HAZARD
ANALYSIS
2.1 INTRODUCTION
The future earthquake threat at a site is generally quantified by carrying out a seismic hazard analysis. There are two basic seismic hazard assessment methodologies, namely, deterministic and probabilistic.
In the deterministic approach, one or more critical earthquake scenario(s) (i.e. maximum possible earthquake magnitudes occurring at seismic sources with minimum distances to the site) are developed. Among them, the one that will produce the largest ground motion at the site is selected. Based on the magnitude, distance and site characteristic, the ground motion at the site is predicted for this earthquake scenario. Since single deterministic values are selected for earthquake magnitude, site to source distance and ground motion prediction equation, this method is called as the deterministic seismic hazard analysis.
Although deterministic seismic hazard analysis (DSHA) is based on the most adverse earthquake scenarios regardless of how unlikely they may be, in probabilistic seismic hazard analysis (PSHA), randomness in earthquake magnitude, location and time is taken into account by considering all probable earthquake scenarios that are capable of affecting the site of interest and frequency of their occurrences. There are also uncertainties in the attenuation of ground motion of an earthquake by distance as well as in the spatial locations of faults or boundaries of area sources. In PSHA, the uncertainties in these parameters are described by probability distributions and systematically integrated into the results via
probability theory. Therefore, instead of a single ground motion value obtained from DSHA, PSHA produces likelihoods of different ground motion values occurring at the site. In other words, the output of PSHA is a set of different ground motion levels and a probability distribution described on this set. This approach also allows the analyst to compare different alternatives quantitatively in making decisions (Reiter, 1990).
In this chapter, the basic concepts, tools and models used in seismic hazard analysis will be explained and the sensitivity of seismic hazard estimations on these assumptions will be illustrated with a semi-hypothetical example which includes a single seismic source, in the form of a fault. The selection of a fault as the seismic source is due to the fact that in the development of new generation of seismic hazard maps more attention is paid on the faults which are the main source of seismic hazard.
2.2 DETERMINISTIC SEISMIC HAZARD ANALYSIS
Deterministic seismic hazard analysis (DSHA) involves three basic steps; definition of earthquake sources, determination of earthquake potential of each source, selection of an attenuation relationship and estimation of selected ground motion parameter or other earthquake effects at the site of interest. Figure 2.1 shows these steps schematically.
First, seismic sources (faults or seismic provinces) within 250 km or larger radius, which depends on the attenuation characteristics as well as tectonic settings of the region, around the site of interest are determined. Seismic sources can be modeled as line, area, dipping plane and volumetric sources. Point source model can also be used in the case that the epicenters of past earthquakes are concentrated in a very small area and they are far away from the site. Then, earthquake potential, i.e. maximum magnitude earthquake that is assumed to occur at the closest distance from the site, of each seismic source is determined. Afterwards, the ground motion values resulted from these earthquakes at the site are estimated by using selected
empirical ground motion estimation equation. Among them, the largest ground motion value is used in the deterministic method.
Figure 2.1 Schematic Description of DSHA for a Site
In order to illustrate the calculations performed in DSHA, a case study is carried out for a site located in İstanbul. There are several studies in literature to predict magnitude and location of potential earthquake that can cause substantial damage in İstanbul. JICA (2002) performed an extensive study in which four scenario earthquake models were described. Among them, the most probable earthquake scenario model is used in this example. This model is presented in Figure 2.2 and its parameters are given in Table 2.1.
Fault (Line Source)
Site Fault (Line Source)
Area Source
Seismic Sources
Site
F1
F2
Maximum Earthquake Magnitudes
Attenuation Relationship Magnitude, M Distance Ground moti on paramet er Seismic Hazard Ground motion parameter
or
other earthquake effects
M1 for Fault F1
M2 for Fault F2
BLACK SEA MARMARA SEA İstanbul İzmit Fault Line F İzmit Gulf
Figure 2.2 Map Showing the Location of the Fault (F) Forming the Basis for the Scenario Earthquake Model Used for İstanbul in This Study (JICA, 2002)
Table 2.1 Parameters of the Fault and the Scenario Earthquake Model Used for İstanbul in This Study (JICA, 2002)
Length (km) 119 Moment magnitude (Mw) 7.5 Dip angle (Degree) 90 Depth of upper edge (km) 0
Type Strike Slip
A site with a closest distance to the fault of about 16 km is selected. Peak Ground Acceleration (PGA) is selected as the ground motion parameter. Four different attenuation relationships developed by Abrahamson and Silva (1997), Boore et al. (1997), Sadigh et al. (1997) and Kalkan and Gülkan (2004) for rock sites are used to predict PGA values at the site. These attenuation relationships are briefly presented in Section 2.3.4. As explained in Section 2.3.6.1, attenuation relationships are generally in the form that they predict the natural logarithm of the ground motion
parameter. Therefore, the values calculated by using these equations are median values of the ground motion parameter. Median values are converted to mean values by assuming a lognormal distribution for the ground motion parameters, Y, as follows (Risk Engineering, 2005);
⎟⎟ ⎟ ⎠ ⎞ ⎜⎜ ⎜ ⎝ ⎛ σ = 2 exp Y Y 2 Y ln median mean (2.1) where;
Ymean : mean value of the selected ground motion parameter
Ymeadian : median value of the selected ground motion parameter
σln Y : standard deviation of the natural logarithm of the selected ground
motion parameter
Table 2.2 shows the mean and median PGA values estimated at the site by using these attenuation relationships for rock site condition.
Table 2.2 Mean and Median PGA Values Estimated at the Site by Using Different Attenuation Relationships for Rock Site Condition in DSHA
PGA (in g)
Abrahamson and Silva (1997)
Boore et al. (1997)
Sadigh et al. (1997)
Kalkan and Gülkan (2004)
Mean 0.317 0.258 0.346 0.277
Median 0.289 0.228 0.322 0.230
Compared with the probabilistic approach, DSHA approach requires less data, computational effort and time. Therefore, it is extensively used in regional seismic hazard estimates. But it is still deficient in taking into account the randomness involved in the temporal, spatial and magnitude-wise distribution of earthquakes as well as uncertainties in each step of the seismic hazard analysis. Due to these randomness and uncertainties, DSHA may not always guarantee the intended
conservatism. Furthermore, selecting the most pessimistic scenario in DSHA is not likely to represent the reality and it is not a good engineering decision (Gupta, 2002).
2.3 PROBABILISTIC SEISMIC HAZARD ANALYSIS
Considering the randomness in the occurrence of earthquakes with respect to time, space and magnitude as well as the various other sources of uncertainties, probabilistic concepts and statistical methods are the appropriate tools for the assessment of seismic hazard. PSHA methodology was first proposed by Cornell (1968) to quantify the seismic hazard at a site of interest in terms of a probability distribution. In contrast to DSHA in which seismic hazard is based on a single earthquake scenario, PSHA integrates the effects of all future earthquakes of all possible magnitudes, at all significant distances from the site. Besides, random nature of earthquake occurrences and uncertainty in attenuation of ground motion are taken into consideration in PSHA. As a result, instead of discrete, single-valued event and model used in DSHA, PSHA allows the use of continuous, multi-valued events and models.
Implementation of PSHA consists of the following basic steps: the delineation of seismic sources, assessment of the earthquake occurrence characteristics for each seismic source, selection of the appropriate ground motion attenuation relationship and identification of the site characteristics, preparation of a computational algorithm which will aggregate the seismic threat nucleating from different sources and yielding to the probability distribution for the specified ground-motion parameter at the site of interest. In addition, different sources of uncertainties are considered in PSHA and their effects are reflected to the hazard results either directly or by employing logic tree or similar statistical methods.
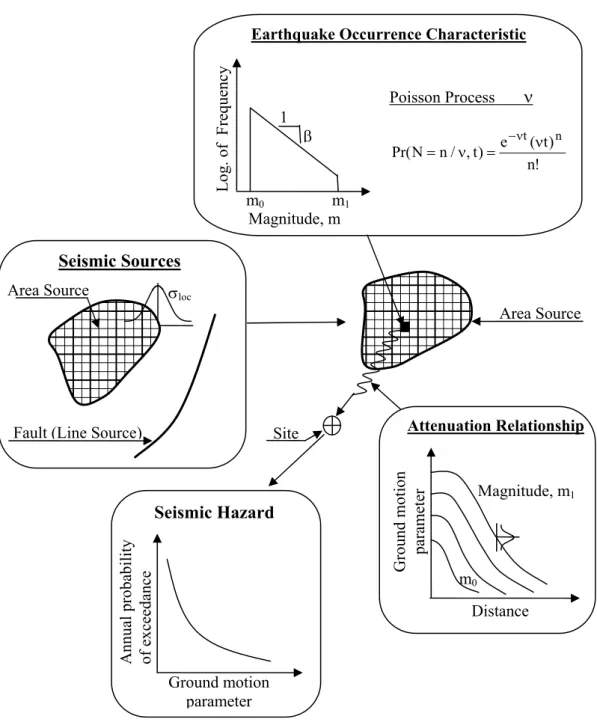
The basic steps of PSHA are schematically shown in Figure 2.3. They are similar to DSHA with some major differences. First, like DSHA, seismic sources that affect the site of interest are defined. Then, for each seismic source, magnitude recurrence
relationship which gives the relative frequency of different earthquake magnitudes is defined. In order to predict the probability of future earthquake occurrences, stochastic models are applied. This step of PSHA is fundamentally different from that of DSHA in which only maximum magnitude earthquake is determined for each seismic source and only this earthquake is considered in the analysis. However, in PSHA, a probability distribution is determined for earthquake magnitude and maximum magnitude is the upper bound of all earthquake magnitudes that will be used in the analysis for each source. Therefore, randomness in earthquake occurrences with respect to magnitude and time is considered in this step.
In the third step, similar to DSHA, attenuation relationship is utilized to predict the effects of all earthquakes determined in the previous step. At the last step, the effects of all earthquakes, which have different magnitudes and occur at different locations in different seismic sources are aggregated and displayed in the form of a curve that shows the probability of exceeding different levels of the selected ground motion parameter.
In the following sections, basic steps of PSHA will be explained in detail.
2.3.1 Seismic Sources
The first step in PSHA analysis is to determine the spatial distribution of potential seismic sources of future earthquakes around the site of interest. In PSHA, a seismic source is a configuration (point, line or area) in which seismicity characteristics; i.e. annual earthquake occurrence rate, attenuation characteristics and maximum earthquake magnitude value, are considered to be the same. In other words, in each seismic source, earthquakes are assumed to occur at the same rate with respect to magnitude regardless of location (Reiter, 1990). The geological and seismological data as well as present earthquake catalogs are the useful tools for the delineation of seismic sources. Expert opinion should also be consulted during this process (SSHAC, 1997).
Figure 2.3 Schematic Description of the Classical PSHA Methodology Area Source Site Magnitude, m1 m0 Distance Ground moti on paramet er Attenuation Relationship σloc
Fault (Line Source) Area Source Seismic Sources m1 m0 Magnitude, m Poisson Process ν ! n ) t ( e ) t , / n N Pr( n t ν = ν = −ν Log. of Freq uency β
Earthquake Occurrence Characteristic
Ground motion parameter Annual proba bility of exceedanc e Seismic Hazard 1
There are three general types of seismic source models; point, line (fault model) and area (source zone model). Among them, the point source model is the simplest case. When epicenters of past earthquakes are clustered in a relatively small area and they are far away from the site, they can be assumed to emanate from a point in space. Therefore, in point source model, there is no randomness with regard to the location of earthquakes and the distance of future earthquakes to the site is assumed to be same (Yücemen, 1982).
Line sources are used to model well defined faults. This model can be imagined as map view representation of three dimensional fault planes (Thenhaus and Campbell, 2003). It is assumed that the earthquakes occur with equal probability at anywhere along the length of a line source. Therefore, line sources are divided into smaller small segments and each segment is treated as a point source in PSHA calculations.
Tectonic stresses cause the deformations or strains in the rock and earthquakes occur when some point reaches the strain level that the rock can no longer withstand. Rupture occurs along a fault and accumulated strain energy relieves or releases. Therefore, earthquakes occur as finite ruptures along the fault. Accordingly, Bender (1984) developed a fault-rupture model in which earthquakes occur as finite length ruptures along the fault and length of each rupture is the function of earthquake magnitude.
In recent studies, fault segmentation model (WGCEP, 1995, 1999) is incorporated into PSHA. In this model, a fault is divided into segments. A segment is a part of the fault with well defined end points, geometry, type and dimensions. Depending on the geometry and seismicity of the fault, there are two types of segments: seismic segment and structural segment. A seismic segment is a portion of the fault which is acti