Dissertations and Theses from the College of
Business Administration Business Administration, College of
7-20-2010
APPLICATION OF OPEN-SOURCE
ENTERPRISE INFORMATION SYSTEM
MODULES: AN EMPIRICAL STUDY
Sang-Heui Lee
University of Nebraska-Lincoln, [email protected]
Follow this and additional works at:http://digitalcommons.unl.edu/businessdiss
Part of theManagement Information Systems Commons,Other Business Commons, and the Technology and Innovation Commons
This Article is brought to you for free and open access by the Business Administration, College of at DigitalCommons@University of Nebraska -Lincoln. It has been accepted for inclusion in Dissertations and Theses from the College of Business Administration by an authorized administrator of DigitalCommons@University of Nebraska - Lincoln.
Lee, Sang-Heui, "APPLICATION OF OPEN-SOURCE ENTERPRISE INFORMATION SYSTEM MODULES: AN EMPIRICAL STUDY" (2010).Dissertations and Theses from the College of Business Administration.Paper 13.
APPLICATION OF OPEN-SOURCE ENTERPRISE INFORMATION
SYSTEM MODULES: AN EMPIRICAL STUDY
by
Sang-Heui Lee
A DISSERTATION
Presented to the Faculty of
The Graduate College at the University of Nebraska In Partial Fulfillment of Requirements For the Degree of Doctor of Philosophy
Major: Interdepartmental Area of Business (Management)
Under the Supervision of Professor Sang M. Lee
Lincoln, Nebraska July 2010
APPLICATION OF OPEN-SOURCE ENTERPRISE INFORMATION
SYSTEM MODULES: AN EMPIRICAL STUDY
Sang-Heui Lee, Ph.D. University of Nebraska, 2010
Advisor: Sang M. Lee
Although there have been a number of studies on large scale implementation of proprietary enterprise information systems (EIS), open-source software (OSS) for EIS has received limited attention in spite of its potential as a disruptive innovation. Cost saving is the main driver for adopting OSS among the other possible benefits including security and reliability, transparency of development process, etc. Due to the costly implementation of proprietary EIS, small- and medium-sized organizations have given attention to OSS as an alternative. OSS EIS can also help create a competitive advantage by enabling organizations to customize their information systems by modifying the open-source software codes without the dependency on vendors.
Prior OSS related studies focused mostly on the desktop software, database management systems (DBMS), web server software, and operating systems (OS) to exploit the motivation of OSS developers, social structures, collaborations in OSS development communities, etc. The present research project conducted a confirmatory analysis on enterprise application built by open-source communities by adopting an
information system success model that primarily relies on constructs that consists of user perspectives on OSS EIS that organizations have adopted.
This research consists of a two-phase qualitative/quantitative mixed method. The first phase investigates the frequencies of EIS modules that have been developed in OSS communities to find the most widely applied functions of OSS EIS. The second phase of the research examined the success factors of OSS EIS based on an IS success model. The study used a sample of OSS EIS users. Users of popular OSS EIS were surveyed about the quality of the system, the information from the system, the community service, the user satisfaction, individual net benefits, and the organizational net benefits. The results suggest removing several constructs entirely from the model proposed by this research and building a new simplified OSS EIS success model.
ACKNOWLEDGEMENT
I owe a tremendous debt of gratitude to Dr. Sang M. Lee for his wisdom and guidance of my path through this work and my entire doctoral program, during which I have strived and grown academically and personally. Dr. Lee always waits for me until I do better.
Dr. David L. Olson deserves special recognition for his valuable input and guidance on my research activities during the program. I am grateful to Dr. Marc J. Schniederjans for his precious advice and support. I also thank to Dr. Alvin J. Surkan for his willingness to serve on my committee.
I wish to thank Pastors Jeoungchil Jo and Joseph Kim for their spiritual guidance during the journey and Dr. Sungbae Lim for introducing me to the world of academia.
I also wish to thank my parents, Choon Woo Lee and Sunhwa Lee for their unfailing support and prayers from my birth to this moment. I should give thanks to my five Js - Joshua, Joseph, Joy, John, and Junghee for their sacrifices during my study. This study could not be completed without the dedication of my precious wife and friend, Junghee.
My last but most gratefulness is to the Lord who built me.
Sang-Heui Lee Lincoln, Nebraska July 2010
TABLE OF CONTENTS
CHAPTER ONE ... 1
1.1 OVERVIEW ... 1
1.2 RESEARCH OBJECTIVE ... 7
1.3 SIGNIFICANCE OF THE STUDY ... 12
1.4 STRUCTURE OF THE DISSERTATION ... 13
CHAPTER TWO ... 14
2.1 OPEN-SOURCE SOFTWARE ... 14
2.1.1 OPEN-SOURCE SOFTWARE DEFINED ... 14
2.1.2 OSS AND PROPRIETARY SOFTWARE ... 17
2.2 ENTERPRISE INFORMATION SYSTEMS AND MODULES ... 19
2.2.1 ERP SYSTEM MODULES ... 19
2.2.2 SCM SYSTEM MODULES ... 23
2.2.3 CRM SYSTEM MODULES ... 26
2.2.4 KM SYSTEM AND BI SYSTEM MODULES ... 27
2.3 OSS EIS ... 29
2.4 OSS EIS MODULES ... 32
2.5 IS SUCCESS MODEL ... 34 2.5.1 SYSTEM QUALITY ... 36 2.5.2 INFORMATION QUALITY ... 37 2.5.3 SERVICE QUALITY ... 38 2.5.4 SYSTEM USE ... 40 2.5.5 USER SATISFACTION ... 40 2.5.6 INDIVIDUAL IMPACT ... 40 2.5.7 ORGANIZATIONAL IMPACT ... 41 CHAPTER THREE ... 42 3.1 PHASE ONE ... 42 3.1.1 DATA SELECTION ... 43
3.1.3 SAMPLE ... 44
3.1.4 MODULES ... 45
3.1.5 INTER-CODER TRAINING AND RELIABILITY ... 45
3.2 PHASE TWO ... 48
3.2.1 RESEARCH FRAMEWORK ... 48
3.2.2 HYPOTHESES ... 49
3.2.3 MEASURES OF ENDOGENOUS VARIABLES... 56
3.2.4 MEASURES OF EXOGENOUS VARIBALBES ... 58
3.2.5 QUESTIONNAIRE DEVELOPMENT ... 61
3.2.6 DATA COLLECTION ... 65
3.2.7 STATISTICAL TECHNIQUE ... 66
3.3 SUMMARY ... 66
CHAPTER FOUR ... 69
4.1 DEMOGRAPHIC CHARACTERISTICS OF RESPONDENTS ... 69
4.2 GENERAL CHARACTERISTICS OF OSS EIS ... 71
4.2.1 DURATION OF OSS EIS USE ... 71
4.2.2 OSS EIS MODULES IN USE ... 72
4.2.3 CUSTOMIZATION OF OSS EIS ... 73
4.2.4 CONFIGURATION OF OSS EIS ... 74
4.2.5 IMPLEMENTATION OF OSS EIS ... 76
4.2.6 TECHNICAL SUPPORT FOR OSS EIS ... 77
4.2.7 VARIOUS T-TESTS ... 78
4.3 MODEL ANALYSES ... 82
4.3.1 ANALYSIS OF THE MEASUREMENT MODEL ... 83
4.3.2 RELIABILITY AND VALIDITY TEST ... 87
4.4 ANALYSIS OF STRUCTURAL MODEL ... 90
4.4.1 MODEL FITNESS OF STRUCTURAL (FULL) MODEL ... 90
4.4.2 HYPOTHESES TESTING ... 90
4.5 DISCUSSION ... 95
4.5.1 COMPARISON ON TWO RESULTS ... 95
4.5.2 RESULTS OF STATISTICAL ANALYSIS ... 97
CHAPTER FIVE ... 105
5.1 SUMMARY ... 105
5.2 IMPLICATIONS AND LIMITATIONS OF THE STUDY ... 106
5.3 FUTURE STUDY ... 108
REFERENCES ... 110
APPENDICES ... 126
LIST OF TABLES
Table 1.1 Top 10 On‐line OSS Communities ... 8
Table 2.1 Business Functions Supported by ERP (Davenport, 1998) ... 20
Table 2.2 Modules Offered by Leading Vendors (Brady et al. 2001) ... 22
Table 2.3 Use of ERP Modules (Mabert et al., 2000; Olhager and Selldin, 2003; Katerattanakul et al., 2006) ... 23
Table 2.4 Proprietary ERP Implementations and OSS ERP Projects ... 30
Table 2.5 EIS Modules ... 33
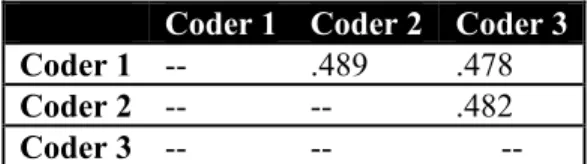
Table 3.1 Cohen’s Kappa of Each Pair of Three Coders with p<.001 ... 47
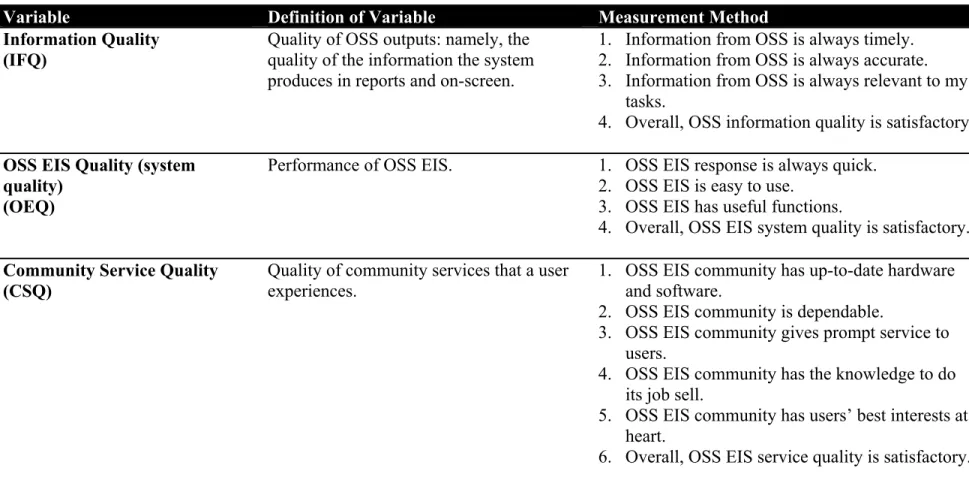
Table 3.2 Definition of Endogenous Variables and Measurement Methods ... 63
Table 3.3 Definition of Exogenous Variables and Measurement Methods ... 64
Table 4.1 Demographic Characteristics ... 70
Table 4.2 Duration of OSS EIS Use ... 72
Table 4.3 OSS EIS Module Experience ... 75
Table 4.4 Percentage of OSS EIS Customized ... 76
Table 4.5 OSS EIS Configuration ... 76
Table 4.6 Implementation of OSS EIS ... 77
Table 4.7 Provider of technical support for OSS EIS ... 78
Table 4.8 Module Use Based on Duration of OSS EIS use ... 79
Table 4.9 Module Use Based on Number of Employees ... 80
Table 4.10 Duration of Use Comparison for Customization ... 81
Table 4.11 Number of Employee Comparisons for Customization/Duration of Use ... 82
Table 4.12 Measurement Model Fitness ... 86
Table 4.13 New Measurement Model Fitness ... 86
Table 4.14 Items, Factor‐loadings, and Construct Reliability ... 88
Table 4.15 Means (Standard Deviation) and Correlation Matrix ... 89
Table 4.16 Overall Model Fitness ... 90
Table 4.17 Path Coefficient and Significance Test of Structural Model ... 92
Table 4.18 A Summary of Path Analysis Results ... 94
Table 4.19 OSS EIS Modules Developed in On‐Line Communities ... 95
LIST OF FIGURES
Figure 1.1 OSS Success Model for Enterprise Information Systems ... 6
Figure 1.2 Waterfall Software Development Model (Royce, 1970) ... 11
Figure 3.1 Research Model with Hypotheses ... 55
Figure 3.3 Research Model Drawn in AMOS ... 68
CHAPTER ONE
INTRODUCTION
“Once openness is adopted as a business strategy then participation and collaboration naturally follow (Lee and Olson 2010).”
1.1
OVERVIEW
The advanced technology of the Internet that continuous to expand, the cheaper costs of hardware and telecommunication, and active participation of users through Web 2.0 are just some of the factors that contribute to the flood of information inundating society today. It has become increasingly important for firms to collect raw data, transform it into valuable information, and analyze the information for better decision making in the competitive global market. Firms continuously create transaction data 24/7 globally, where environmental resources and constrains including governments, competitors, customers, and cultures are constantly changing. Lee and Olson (2010) defined globalization as “… the development of connected world, that is much more open and interdependent.” In the fast-moving business environments open to global competition, sustainable advantage requires unique and difficult-to-replicate dynamic capabilities (Teece, 2007).
These capabilities are necessary to sustain superior enterprise performance in an open economy with rapid innovation and globally dispersed sources of invention, innovation, and manufacturing capability. Firms not only adapt to business ecosystems,
but also shape them through innovation and through collaboration with other enterprises, entities, and institutions. Iansiti and Clark (1994) found that integration capability was associated with positive enterprise performance, which demonstrates the importance of knowledge integration skills. In fast-paced environments, firms must have considerable autonomy (to make decisions rapidly) but remain connected to activities that must be coordinated (Porter, 1996). As a result, firms need to find the best industry practices to manage the growing volume of information in a manner that is valuable to their businesses. For example, the firm’s strategies can be kept congruent with environmental changes by developing considerable knowledge management (KM) systems through information systems (IS) support.
The development of enterprise-level IS has enhanced such dynamic capabilities of firms. The functionalities of such IS include enterprise resource management, customer and supply chain management, knowledge management, business intelligence, etc. (Laudon and Laudon, 2010). The enterprise information systems (EIS) have been an emerging trend of implementation to meet the needs of businesses in the 21st Century.
However, as Olson (2004) explained, implementing EIS software is typically too complex for in-house capability and very expensive, involving millions of dollars for vendor purchasing price, consultant expertise, in-house development, and user education. The large size of financial investment and its inherent risk make firms hesitate to invest in the system, especially for small- and medium-sized businesses (SMBs). Additionally, since EIS are widely applied by organizations, it is hard to gain competitive advantage through EIS implementation (Karimi et al., 2007). Organizations can customize EIS
through open-source codes to fit their processes and gain competitive advantage (Jaisingh et al., 2008).
Recently, EIS vendors have realized that open-source software (OSS) offer capabilities, both as a source of content for vendors as well as a threat to the proprietary enterprise system market share from competitors based on OSS development or delivery (Grewal et al., 2006). Porter (1996) stated, “… new market entrants, unencumbered by a long history in the industry, can often more easily perceive the potential for a new way of competing. Unlike, incumbents, newcomers can be more flexible because they face no trade-offs with their existing activities.”
OSS development involves voluntary participation of individuals in on-line communities to develop computer software codes. The underlying philosophy of OSS is to enhance software reliability and quality through independent peer reviews and rapid evolution of applications. With OSS, developers and users are free to utilize and modify OSS by accessing open codes. The zero-cost licensing structure of most open-source projects has opened up the acceptance of these products into a number of previously untapped markets. According to Serrano and Sarriegi (2006), three major reasons why OSS is advantageous to implement and maintain EIS are: (1) increased adaptability to match the business processes and local regulations; (2) decreased reliance on a single supplier; and (3) reduced costs to implement and maintain the system. Johansson and Sudzina (2008) also claimed that OSS EIS enable SMBs to implement EIS at a minimal cost which often is an impediment for EIS implementation in SMBs. Thus far, though, OSS EIS are not yet the main stream since few trustworthy organizations have shown success in implementing them.
The motivation for this research can be summarized as follows:
y Although implementing OSS EIS can result in competitive advantage for SMBs, there have been few empirical studies on the topic.
y Success factors of information systems and general OSS have been discovered in prior studies. A confirmatory analysis of enterprise-level OSS based on the existing IS success research frames can discover success factors of OSS EIS. The significance of this research resides in confirming the success factors of OSS EIS implementation that may help SMBs to adopt appropriate EIS modules. Although there have been several studies on large scale implementations of proprietary enterprise software, OSS EIS development has received limited attention in spite of its potential as a disruptive innovation (Brydon and Vining, 2008).
Reviews of prior studies and the motivations described above resulted in the following research question: How does OSS development penetrate the proprietary EIS market?
To answer this research question the following questions shall be examined:
1. Which EIS modules/functions are appropriate to be initiated and sustained for OSS development? (Development phase)
2. What are the major drivers of enterprise OSS modules for developing niche markets and reaching a critical mass of adopters? (Diffusion phase)
While there has been an abundance of literature on OSS, most studies on OSS success are qualitative or exploratory. An empirical study that measures OSS success would improve OSS use by delineating the success factors. This study develops an OSS EIS success model by expanding on a prior information systems success model by
incorporating the characteristics of EIS and OSS.
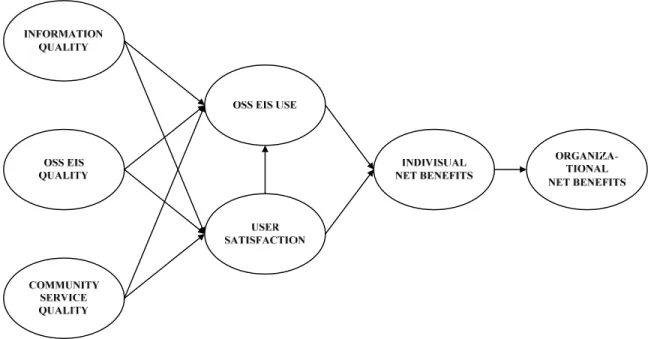
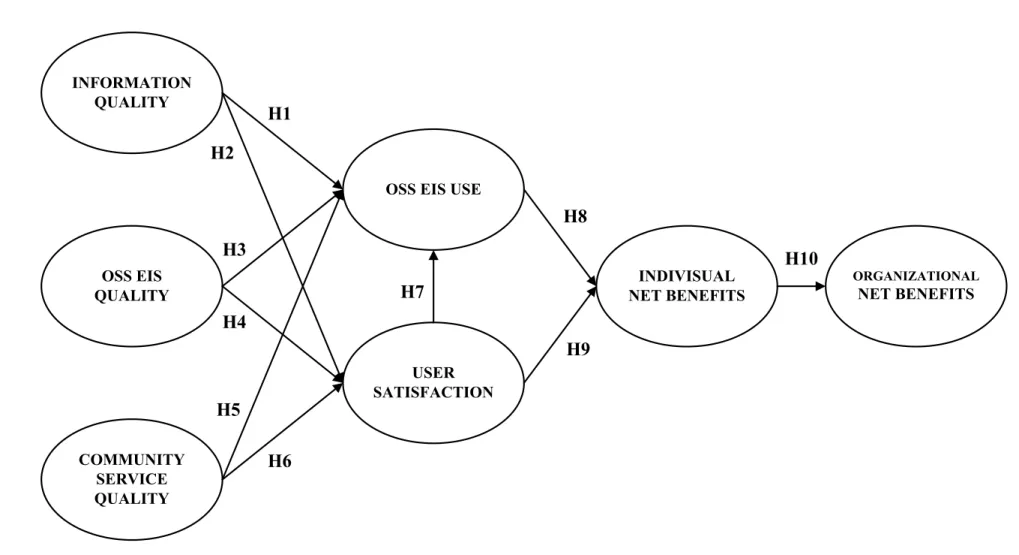
An IS success model developed by DeLone and McLean (1992, 2003) has been applied to OSS in general to measure OSS success (Lee et al., 2009). The research model for this study is shown in Figure 1.1, which is distinguished from prior research due to the addition of two constructs, community service quality and organizational net benefits in accordance with the nature of enterprise-level information systems. This dissertation extends the application of the IS success model even further to enterprise software.
To evaluate the relationships shown in the model, end users of OSS EIS were surveyed about their perspectives on the use of OSS EIS based on their work experiences. The measurement instrument (survey of OSS EIS users) was developed by adopting existing validated instruments wherever possible. Summated scales for each variable were calculated from the survey item responses. The hypothesized relationships between variables were analyzed using structural equation modeling to assess the direction and strength of the relationships. The methodology used in this study is discussed in Chapter Three.
A modified model based on the studies by DeLone and McLean (2003) and Lee et al. (2009)
Figure 1.1 OSS Success Model for Enterprise Information Systems
Results of this analysis are expected to confirm those from general IS success studies and find the relationships with the two additional variables of Community Service Quality and Organizational Net Benefits, which were intended to capture the properties of OSS and EIS. More specifically, the relative importance of each user perspective in relation to OSS EIS and the resulting impact on organization benefit will be shown. A comparison of the model and the typical IS success model by incorporating the two additional variables and by considering OSS EIS Use as a mediating variable will be discussed. Quantifying the strength and direction of these relationships has both theoretical and practical significance. From a research standpoint, this study will enrich the body of knowledge of OSS EIS development and provides a model that can
potentially be applied to other OSS information systems development. For OSS developers and other practitioners including consulting firms, partners, and large firms who practice in-house OSS development, understanding the strength of various success factors aids in the decision-making processes in adapting OSS EIS for organizations. In addition, the study provides insight to the relationships between success factors and individual and organizational benefit. It may also help organizations who are pursuing the advantages of OSS select appropriate modules/functions of OSS EIS for their needs.
1.2
RESEARCH OBJECTIVE
The overall objective of this study is to examine the relationships between success factors identified in the literature as critical to open-source enterprise application and the net benefits of individuals and organizations that adopt OSS EIS for business purposes. Thus, the research purposes are: “What functions/modules of EIS are successful in OSS practice?” and “What are the success factors that influence the adaptation of OSS EIS?”
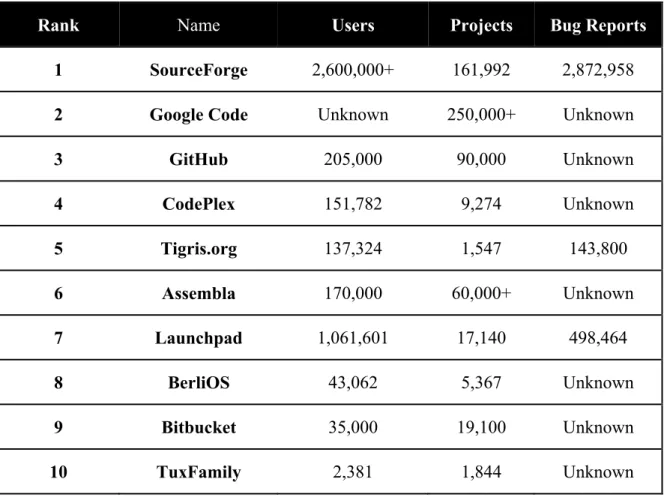
There are a number of on-line OSS development communities as shown in Table 1.1. Each community provides software development platforms for various types of OSS projects. OSS project has expanded the boundary from operating systems (OS) to database management systems (DBMS) to enterprise-level business software.
Rank Name Users Projects Bug Reports
1 SourceForge 2,600,000+ 161,992 2,872,958
2 Google Code Unknown 250,000+ Unknown
3 GitHub 205,000 90,000 Unknown 4 CodePlex 151,782 9,274 Unknown 5 Tigris.org 137,324 1,547 143,800 6 Assembla 170,000 60,000+ Unknown 7 Launchpad 1,061,601 17,140 498,464 8 BerliOS 43,062 5,367 Unknown 9 Bitbucket 35,000 19,100 Unknown 10 TuxFamily 2,381 1,844 Unknown
Table 1.1 Top 10 On-line OSS Communities
Enterprise applications include document management, office automation, network management, portal frame work, and so on, in addition to EIS that is the focal subject of this study. The study only examines the five major OSS enterprise applications. Laudon and Laudon (2010) defined EIS into five categories: enterprise resource planning (ERP) systems, supply chain management (SCM) systems, customer relationship management (CRM) systems, knowledge management (KM) systems, and business intelligence (BI) systems. Identification of such information system modules helps organizations, especially SMBs, find alternative ways to adopt EIS.
For software development, systems development life cycle (SDLC) or the waterfall model shown in Figure 1.2, which is the oldest form of SDLC suggested by Royce (1970), is the most widely applied process. According to Royce (1970), the waterfall model involves five steps: requirements specification, design, implementation, verification, and maintenance. To properly apply this model to software development, each step must be followed in sequential manner. Output from each step serves as input to the next step.
The requirements specification phase involves gathering information about customer’s needs and defining the problem that the product is expected to solve. The design process involves defining the hardware and software architecture, designing data storage, choosing programming language, and designing user interface. The implementation step consists of constructing the product as per the design specification(s) developed in the previous step (Royce, 1970). Typically, this step is performed by a development team consisting of programmers, interface designers and other specialists, using tools such as compilers, debuggers, interpreters and media editors. In test/verification stage, both the individual components and the integrated whole are methodically verified to ensure that they are error-free and fully meet the requirements outlined in the first step (TechRepublic, 2006).
Lastly, the installation/maintenance stage involves preparing the system or product for installation and use at the customers’ site. The maintenance stage occurs after installation, and involves making modifications to the system or an individual component to alter attributes or improve performance. These modifications arise either due to change
requests initiated by the customer, or defects uncovered during live use of the system (TechRepublic, 2006).
These five steps can be viewed from the perspectives of the status of OSS project. The present study identified two distinct steps of the OSS project based on the proprietary Software (or System) Development Life Cycle (SDLC)/Waterfall model for research purpose as shown in Figure 1.2. The two phases that a typical OSS project goes through are: development and diffusion. Unlike in the proprietary software development process, in OSS users are not usually involved in the early stages, such as design and implementation. This lack of user involvement has noted as an issue in a prior study (Hughes and Cotterell, 1999).
In comparison to proprietary software, more OSS projects are ending their SDLC in the development phase. Not all OSS projects can be sustained in on-line community and diffused to fields, where users become actively involved. Lee et al. (2009) said, “… While there have been successful OSS projects, mostly with backend servers and Internet-related software, the number of failed or dormant OSS projects is also notable. In fact, according to the popular open source portal, SourceForge.net, most OSS projects have ended in failure: 58% do not move beyond the alpha developmental stage, 22% remain in the planning phase, 17% remain in the pre-alpha phase, and some become inactive.”
The three milestones of the two phases, development and diffusion are: project initiative, project sustaining, and project adoption. Project initiative involves the first four stages of the Waterfall model: requirements specification, design, implementation, and verification, which are done in the development phase. Project adoption involves the last
two steps of the Waterfall model: verification, and maintenance, which are done in diffusion phase. Project sustaining involves overlapped area between development and diffusion phases, including implementation, verification, and maintenance steps.
Toward this end, this study involves two research phases: (1) Identification of the most popular applications of OSS EIS modules by exploring on-line OSS communities shown in Table 1.1 to assess the proportion of EIS development among the various projects; and (2) A confirmatory analysis on the modified IS success model based on the user survey to analyze user perspectives on OSS EIS. The overview of this research is shown in Figure 1.3.
Figure 1.3 Research Overview
1.3
SIGNIFICANCE OF THE STUDY
The research published to date has developed the theoretical and conceptual relationships between success factors and individual or organizational net benefits for information systems. This study in the context of OSS EIS is an empirical extension that tests the relationships between user perspectives on the system and individual net benefits to assess their strength, direction, and impact on organizational net benefits. The results from the survey of end users are investigated to further the understanding of success factors of OSS EIS projects. Additionally, the evidence from this research may help
practitioners make more informed decisions regarding employment of OSS EIS for their business.
1.4
STRUCTURE OF THE DISSERTATION
The dissertation is structured with five chapters; Introduction, Literature Review, Research Design and Methodology, Results and Discussion, and Summary and Conclusion.
Chapter One has introduced the topic of the study and discussed the general research objectives and research questions. Chapter Two presents a literature review on OSS EIS and information system success measures for OSS. Chapter Three outlines the research design and methodology employed in this study. It describes a research framework developed based on literature review. Hypotheses are developed and the variables used in the study are presented. Details of research design, the sample, and the survey instrument are also discussed. Chapter Four presents the results of statistical analyses and discussion. Chapter Five concludes the study by presenting the summary, limitations, and practical and academic contributions of the study.
CHAPTER TWO
LITERATURE REVIEW
“Information has no intrinsic value; any value comes only through the influence it may have on physical events. Such influence is typically
exerted through human decision makers (Emery 1971, p.1).”
This chapter presents the literature review on OSS, EIS, and user perspectives on information systems. It consists of four sections. The first section presents a literature review on OSS in general. The second section reviews literature on EIS modules, describing the functions of EIS and the modules that vendors develop for firms. The section concludes by presenting a comprehensive set of EIS modules derived from prior studies. In the third section, a discussion of OSS EIS and its module development is presented. The fourth section presents the success factors of information systems. The existing literature in each of these areas, including their respective findings and implications are summarized in this chapter.
2.1
OPEN-SOURCE SOFTWARE
2.1.1
OPEN-SOURCE SOFTWARE DEFINED
OSS is computer software that is available in the source code form for which the source code and certain other rights normally reserved for copyright holders are provided under a software license that permits users to study, change, and improve upon it. OSS
development projects are initiated by an individual or a small group with an interesting software idea that they themselves want for an intellectual or business reason (Subramanian and Soh, 2008). Raymond (1999) argued in his essay, The Cathedral and the Bazaar, the more widely available the source code is for public testing, scrutiny, and experimentation, the more rapidly all forms of bugs will be discovered. Raymond (1999) also claimed that an inordinate amount of time and energy must be spent hunting for bugs in the Cathedral model, since the working version of the code is available only to a few developers. On the other hand, OSS is a platform for the wisdom of the crowd. Sunstein (2006) suggested in his book about collective intelligence, “… a diverse collection of independently-deciding individuals is likely to make certain types of decisions and predictions better than individuals or even experts, draws many parallels with statistical sampling …” Boer et al. (1999) supports the arguments by suggesting that knowledge integration is the fusion and combination of knowledge from sources that are multiple, distributed and heterogeneous.
Lee and Olson (2010) argued the ability to access millions or potentially billions over the internet makes it far more valuable than a local area network. OSS development involves the voluntary participation of individuals on on-line communities that have no physical boundary. OSS is developed through open-source projects which are developed through group participation to modify and utilize the open software code for their own needs (Krogh and Hippel, 2006). OSS also works for the public interests by allowing developers and users utilize and modify OSS by accessing open code (O’Mahony, 2003; Roberts et al., 2006; Jaisingh et al., 2008).
Weber (2005) reviewed industry surveys seeking to identify why participants gave their time to such endeavors. One might naturally think of altruism, but that does not seem to be the explanation, as participants care a great deal about the credit for their work. They seem to emphasize feeling part of the technical community, using open-source participation to improve their programming skills as well as having fun. Software creators participate due to enjoyment, learning, reputation, and community membership (Lakhani and Wolf, 2005).
The underlying philosophy of OSS is to enhance software reliability and quality through independent peer review and rapid evolution of source code. Low cost is also a main driver of OSS implementation. OSS ERP’s average implementation costs are at between one- sixth and one- third of the costs for typical proprietary ERPs (Lee and Olson, 2010). OSS has provided a number of successes. The most commonly understood open-source success is the Linux operating system, used by Dell, Compaq, and IBM, as well as many other firms. MySQL is an open-source database server. Apache web server leads over Microsoft IIS by a substantial margin. Sun Microsystems have long viewed OSS as a means to develop long-range market strength (Babcock, 2009). Other firms have been able to make OSS work, including Dell computers (Conry-Murray, 2009). According to Iansiti and Richards (2006), OSS is created by two clusters, the money-driven cluster and the community-driven cluster. IT vendors, such as Oracle and IBM, mainly focus on money-driven cluster and actively promote a proprietary product over an open source equivalent.
Open-source licenses often meet the requirements of the Open Source Definition suggested by Open Source Initiative (Open Source Initiative, 2010). OSI, an organization
dedicated to promoting OSS, defines OSS in the following 10 criteria: (1) Free Redistribution – the license shall not restrict any party from selling or giving away the software. The license shall not require a royalty or other fees for such sale; (2) Source Code - the program must include source code in the preferred form in which a programmer would modify the program; (3) Derived Works - the license must allow modifications and derived works; (4) Integrity of The Author's Source Code - the license may restrict source-code from being distributed in a modified form only if the license allows the distribution of "patch files" with the source code for the purpose of modifying the program at build time; (5) No Discrimination Against Persons or Groups - the license must not discriminate against any person or group of persons; (6) No Discrimination Against Fields of Endeavor - the license must not restrict anyone from making use of the program in a specific field of endeavor; (7) Distribution of License - the rights attached to the program must apply to all to whom the program is redistributed without the need for execution of an additional license by those parties; (8) License Must Not Be Specific to a Product - The rights attached to the program must not depend on the program's being part of a particular software distribution; (9) License Must Not Restrict Other Software - the license must not place restrictions on other software that is distributed along with the licensed software; (10) License Must Be Technology-Neutral - No provision of the license may be predicated on any individual technology or style of interface.
2.1.2
OSS AND PROPRIETARY SOFTWARE
Davis (2009) surveyed 656 business technology professionals, 557 of whom used OSS. OSS was reported as pervasive in 17 percent of these firms, but was reported to
have rather limited use by 68 percent. The primary barrier to adoption of OSS was cited to be lack of formal support, followed by lack of functionality and lack of financial stability of supporting vendors. Security and legal issues were reported to be of minor importance.
Economides and Katsamakas (2006) found that the OSS industry is more lucrative than proprietary software industry when adopters have weak needs for platform and strong needs for applications or customization. In this regard, there is now keen competition between OSS and closed software in the software market (Jaisingh et al., 2008). According to Lee and Mendelson (2008), the optimal strategies of the two software industries, commercial software and OSS, depend on both product timing and compatibility.
Network effects make compatibility a key competitive factor. Network effects also create an intense competitive environment, driving profits down if the technologies are incompatible. If OSS can establish itself first, the commercial firm is always better off mitigating the network effects by following the OSS lead and designing a compatible product. Sen (2007) also insisted that most OSS are late entrants to the market, already consisting of proprietary and its complementary/supplementary products. In order to attract users in this market, the OSS will have to be compatible with these existing complementary/supplementary products. Even in a situation where all consumers eventually adopt the proprietary software, the presence of OSS as a credible threat drives down prices, thereby increasing consumer surplus. Open source developers derive not only personal satisfaction from developing software but they also seek to maximize a measure of consumer surplus and therefore suffer if incompatibility splits the market.
Lee and Mendelson (2008) argued that with zero switching cost, open-source software does not gain a market-share advantage by being available first. However, the presence of OSS pushes the proprietary software firm to improve its product features and launch their products early. A firm considering open source development as an alternative to closed source development would need to carefully review the relationship between the software in question and the firm’s other products. If the software is found to enhance the usefulness or quality of complementary products and/or if the users of the software and the users of the complementary product belong to the same network, the complementary software can be exploited (Haruvy et al., 2008).
2.2
ENTERPRISE INFORMATION SYSTEMS AND MODULES
The organizational benefits of an information system often depend on how they are implemented and utilized in addition to what functional attributes they possess (Markus, 1983; Robey and Boudreau, 1999). EIS are applications that focus on managing and integrating whole business processes including accounting, finance, manufacturing, human resources, and inventory management (Davenport and Brooks, 2004). The following sections describe functions/modules of each five major enterprise applications, ERP, SCM, CRM, KM, BI systems.2.2.1
ERP SYSTEM MODULES
Business computing systems were initially applied to those functions that were easiest to automate and that called for the greatest levels of consistency and accuracy.
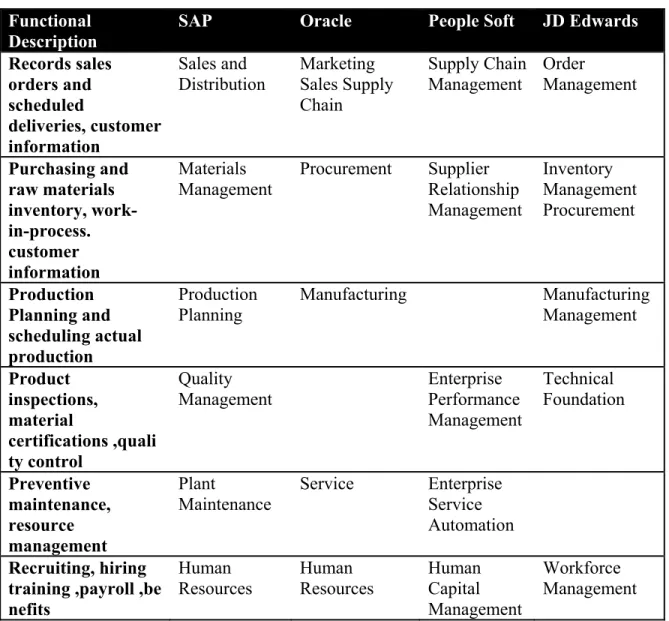
Davenport (1998) defined business functions potentially supported by ERP as shown in Table 2.1. The top five categories defined by Davenport (1998) include: financial function, human resources function, operations and logistics function, and sales and marketing function. Each function includes several modules. Financial function may include financial and accounting modules, such as accounts receivable and payable, cash forecasting, and cost accounting. Human resource function may include time accounting and payroll modules. Operations and logistics function includes inventory management, materials requirement planning, and purchasing modules. Sales and marketing function may include order management and sales planning. Olson (2004) argued that ERP systems in concept cover all computing for an organization to centralize data and computation and to remove the redundancy and inconsistency of data. However, proprietary ERP vendors sell their software in modules as shown in Table 2.2.
Financial Human Resource Operations and Logistics Marketing Sales and
Accounts receivable and payable Asset accounting Time accounting Payroll Inventory management Materials Requirement Planning (MRP) Order management Pricing Cash forecasting
Cost accounting Personnel planning Travel expenses Plant maintenance Production planning Sales management Sales planning Executive
information systems Project management
Financial consolidation General ledger Profitability analysis Standard costing Purchasing Quality management Shipping Vendor evaluation
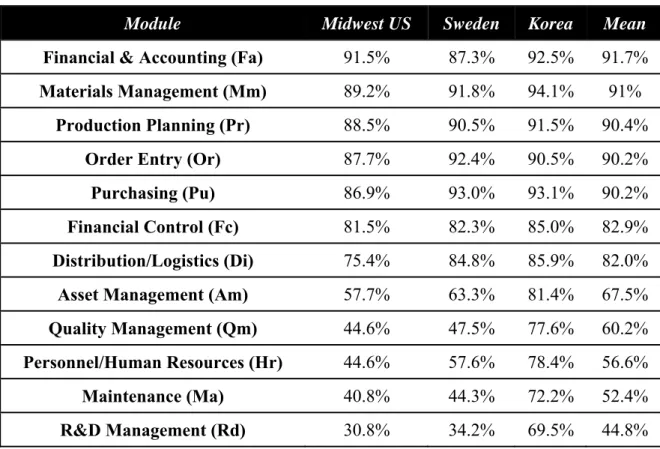
Mabert et al. (2000) reported the extent of ERP module use by surveying 479 ERP users from the American Inventory and Inventory Control Society. Olhager and Selldin (2003) conducted a similar study by surveying 190 Swedish manufacturing firms. Another study by Katerattanakul et al. (2006) was done by surveying 306 Korean manufacturing firms. The results from the three studies are listed in Table 2.3. These studies found that the most frequently used module of ERP in the United States was financial and accounting (Mabert et al., 2000); materials management, production planning, and order entry in Sweden (Olhager and Selldin, 2003); and the modules related to the time-to-customer process in Korea (Katerattanakul et al., 2006).
The results from the similar studies show different ERP implementation practices in the three countries. Olhager and Selldin (2003) explained that Swedish firms are keener on using European, and in particular Swedish, ERP systems while the US study rank SAP, Baan and PeopleSoft as the most popular systems. (PeopleSoft acquired JD Edwards in 2003 and Oracle acquired PeopleSoft in 2005) Swedish firms typically implement more modules; all individual modules have a higher implementation frequency in the Sweden research except financial accounting, which is the most widely implemented module in the US. The study found that information speed, quality and availability improved but the information technology costs were not decreased, which were quite similar to those experienced in the US.
Functional Description
SAP Oracle People Soft JD Edwards
Records sales orders and scheduled deliveries, customer information Sales and Distribution Marketing Sales Supply Chain Supply Chain Management Order Management Purchasing and raw materials inventory, work- in-process. customer information Materials Management Procurement Supplier Relationship Management Inventory Management Procurement Production Planning and scheduling actual production Production
Planning Manufacturing Manufacturing Management
Product inspections, material certifications ,quali ty control Quality Management Enterprise Performance Management Technical Foundation Preventive maintenance, resource management Plant Maintenance Service Enterprise Service Automation Recruiting, hiring training ,payroll ,be nefits Human Resources Human Resources Human Capital Management Workforce Management
Module Midwest US Sweden Korea Mean
Financial & Accounting (Fa) 91.5% 87.3% 92.5% 91.7%
Materials Management (Mm) 89.2% 91.8% 94.1% 91%
Production Planning (Pr) 88.5% 90.5% 91.5% 90.4%
Order Entry (Or) 87.7% 92.4% 90.5% 90.2%
Purchasing (Pu) 86.9% 93.0% 93.1% 90.2%
Financial Control (Fc) 81.5% 82.3% 85.0% 82.9%
Distribution/Logistics (Di) 75.4% 84.8% 85.9% 82.0%
Asset Management (Am) 57.7% 63.3% 81.4% 67.5%
Quality Management (Qm) 44.6% 47.5% 77.6% 60.2%
Personnel/Human Resources (Hr) 44.6% 57.6% 78.4% 56.6%
Maintenance (Ma) 40.8% 44.3% 72.2% 52.4%
R&D Management (Rd) 30.8% 34.2% 69.5% 44.8%
Table 2.3 Use of ERP Modules (Mabert et al., 2000; Olhager and Selldin, 2003; Katerattanakul et al., 2006)
2.2.2
SCM SYSTEM MODULES
SCM information systems (IS) are distinguished from other EIS in that they focus primarily on supply chain planning and execution rather than other functions such as human resources or accounting. The main idea of ERP was to centralize data and computation, so that data can be entered once in a clean form, and then be used by everyone in the organization (and even by supply-chain partners outside the organization) (Olson, 2004). According to the ERP study in Sweden done by Olhager and Selldin (2003), the set of modules requiring customization is similar to those in the US. Order entry was singled out as number one in the US study followed by distribution/logistics,
production planning, and materials management. Thus, it seems that the supply chain process from suppliers through manufacturing to customer generally is important and needs some tailoring to support the needs of the individual enterprise and its relationship with supply chain partners.
Motivations for developing a hierarchical taxonomy for SCM IS include: there is no comprehensive classification of SCM IS modules due to the overlapping functionality in most SCM IS and due to their tendency to be configured differently for each implementation (Helo and Szekely, 2005); the ‘best-of-breed’ approach for EIS implementation complicates the process of matching organizational requirements to software functionality (Light et al. 2001); and overlaps in functionality among different SCM IS prevent the development of useful taxonomies using the traditional approach of grouping products into different categories. In the following sections, various SCM classifications are discussed.
2.2.2.1GENOMIC CLASSIFICATION SCHEME
McLaren and Vuong (2008) developed a hierarchical classification scheme, which is the scheme utilized in this study for SCM classification. The taxonomy developed by McLaren and Vuong (2008) describes 83 major functional attributes that form five top-level categories: primary supply chain processes, data management, decision support, relationship management, and performance improvement as shown in Appendix A. A modified grounded theory approach was followed to help ensure the model constructs. The categories were derived from empirical descriptions of commercial SCM IS packages, rather than from purely theoretical constructs.
Using the hierarchical taxonomy, researchers and practitioners will be able to more accurately classify and describe SCM IS while providing greater detail on the functionality provided by specific SCM IS. The use of the qualitative analysis software facilitated the analysis of the approximately 1,800 pages of text. The study was limited to the seven most popular SCM IS packages. Although this ignores some specialized functionality in other niche SCM IS, limiting the scope to the "Big Seven" facilitated comparison and theoretical replication between the packages while reducing extraneous differences (Yin, 2003).
At the highest level, the attributes were organized into five categories as indicated before. These functional attributes should be viewed as the attributes that were prominent in the most commonly used SCM IS applications. Future research could include investigating more niche functionalities as appropriate.
2.2.2.2OTHER CLASSIFICATIONS
AMR Research, Inc., a company providing supply chain and supporting technologies, classified SCM technologies by application segment in 2007 into 10 categories, including Warehouse Management (16%), Order Fulfillment (15%), Supply Chain Management Performance (14%), Production and Distribution Planning (12%), Demand Planning (11%), Transportation Management (11%), Inventory Optimization (7%), Service Parts Management and Planning (6%), Sales and Operation Planning (5%), and Global Trade Management (3%) (Kerr, 2009).
Most of these categories are inclusive in the top level of the genomic classification or the successive levels. Fawcett, Ellram, and Ogden (2007) suggested that
operations processes must manage the same core set of decisions, which can be classified into two groups: design decisions and control decisions. The design decisions including Product Design, Process Design, Facility Layout and Facility Location are under the primary SCM of the genomic classification. The control decisions are also a subset of the genomic classification since they fit well under the rest of the categories. In comparison to the described categories, the study of genomic classification was based on the quite collective data and provides sufficient information to identify SCM IS modules for this study. Defining a comprehensive set of EIS modules is a necessary step that must be done prior to the present research for consistency. Both the content analysis in phase one and the confirmatory factor analysis in phase two of the research are performed based on the same EIS categories.
2.2.3
CRM SYSTEM MODULES
Porter’s (1979) five competitive forces model provides a general view of the organization, its competitors, and the environment. The five competitive forces include traditional competitors, new market entrants, substitute products and services, suppliers, and customers. A profitable company depends in large measure on its ability to attract and retain customers (Laudon and Laudon, 2010). In a survey of 506 global CEOs, CEOs ranked customer loyalty and retention as their No. 1 management challenge (Rosenbleeth et al., 2002). Advanced information technologies, such as CRM systems, have forced firms to focus on managing customer relationships through meeting customer satisfaction to maximize revenues. Mass customization and personalization have been discussed in many studies as instruments of customer loyalty and retention. Mass customization and
the corresponding approach of personalization have the potential to address competitive market requirements while improving a firm’s profitability (Tseng and Pillar, 2003). Prior studies developed the instrument of customer-centric knowledge management (Stefanou et al., 2003; Alvert et al., 2004).
Colombo et al. (2004) defined eight CRM system modules. They classified CRM system modules into three main categories and then each main category has multiple sub-modules. The three main classifications are collaborative CRM system, analytical CRM system, and operational CRM system. The collaborative CRM system includes two sub-modules, channel management and call center/help desk. The analytical CRM system also includes two sub-modules data integration and data warehousing and knowledge management. Lastly, the operational CRM system includes four sub-modules, field, sales, marketing, and product management.
2.2.4
KM SYSTEM AND BI SYSTEM MODULES
Knowledge management systems facilitate the efficient and effective sharing of a firm’s intellectual resources (Poston and Speier, 2005). KM systems refer to (generally IT based) systems for managing knowledge in organizations for supporting creation, capture, storage, and dissemination of information. KM systems are positively related to administrative and technical innovation performance (Huang and Li, 2009; Thornhill, 2006). Sher and Lee (2002) presented that KM systems contribute to the enhancement of dynamic capabilities and thus to the enhancement of business excellence and competitive advantages.
Laudon and Laudon (2010) defined KM systems as enterprise-wide systems for managing and distributing documents, graphics, and other digital knowledge objects; systems for creating corporate knowledge directories of employees with special areas of expertise; office systems for distributing knowledge and information; and knowledge work systems to facilitate knowledge creation. Other knowledge management applications use intelligent techniques that codify knowledge for use by other members of the organization and tools for knowledge discovery that recognize patterns and important relationships in large pools of data.
The last entity that the study considers as EIS is business intelligence systems. BI systems are designed to help individual users grapple with vast quantities of data as they make decisions about organizational processes (Watson et al., 2004). Once data have been captured and organized in data warehouses and data marts, they are available for further analysis. BI systems encompass a set of tools, techniques, and processes to help harness this wide array of data and allow decision makers to convert them to useful information and knowledge (Negesh, 2004). A series of tools enables users to analyze data in search of new patterns, relationships, and insights that are useful for guiding decision making. BI systems are tools for consolidating, analyzing, and providing access to vast amounts of data to help users make better business decisions. Principle tools for business intelligence include software for database query and reporting, tools for multidimensional data analysis (online analytical processing, OLAP), and data mining.
2.3
OSS EIS
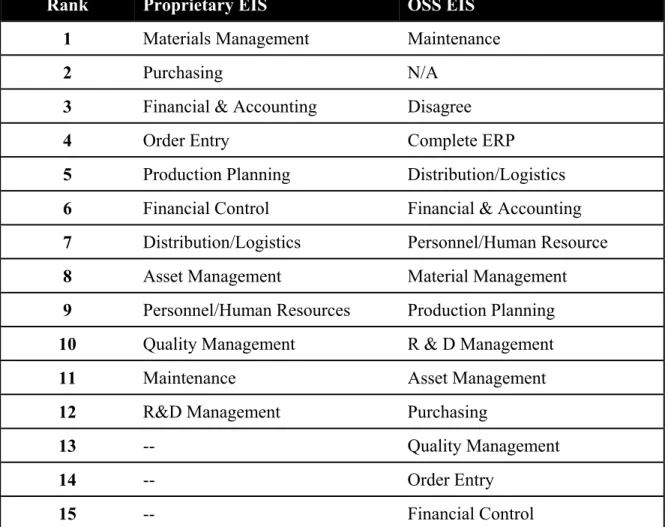
Implementation of enterprise systems, such as EIS, requires a large amount of investment and its inherent risk makes firms hesitate to implement the system, especially for SMBs. Recently, as open-source projects became more popular, there have been some studies on OSS EIS. Lee et al. (2010) conducted a comparative study of proprietary and OSS ERP modules. They investigated Sourceforge.net, a community-driven OSS developing site that has 348,000 open source projects including EIS, business intelligence, and database management systems, among others. The study shows that OSS ERP projects are being developed more in supportive modules than value chain modules, which are opposite to the results from the proprietary studies as shown in Table 2.4.
The rankings of proprietary ERP modules were calculated based on the results from the three studies by Mabert et al. (2000), Olhager and Selldin (2003), and Katerattanakul et al. (2006). The rankings of ERP modules in proprietary market are almost opposite of the ranking of OSS modules. Even though OSS is disruptively innovative, it is the commercial vendors of enterprise systems that are still dominating the market for ERP main activities modules.
Rank Proprietary EIS OSS EIS
1 Materials Management Maintenance
2 Purchasing N/A
3 Financial & Accounting Disagree
4 Order Entry Complete ERP
5 Production Planning Distribution/Logistics
6 Financial Control Financial & Accounting
7 Distribution/Logistics Personnel/Human Resource
8 Asset Management Material Management
9 Personnel/Human Resources Production Planning
10 Quality Management R & D Management
11 Maintenance Asset Management
12 R&D Management Purchasing
13 -- Quality Management
14 -- Order Entry
15 -- Financial Control
Table 2.4 Proprietary ERP Implementations and OSS ERP Projects
Explanation can be that because large firms already have large financial investments and implemented the main-activities modules, they are reluctant to experiment and install new OSS modules. Large firms do not want to take high risk for such main modules of the value chain. They would rather like to get their toes in and experiment with OSS for the supportive modules of ERP and may want to see if there is a compatibility issue between the existing main-activities modules and OSS modules.
According to the work done by Park et al. (2002), manufacturing was the highest regarding proprietary ERP implementation with 71.7% among the industries of the
respondents’ organization. Damanpour (1992) studied about the relationship between organizational size and innovation. The size of firm is more positively related to innovation in manufacturing and profit-making organizations than in service and non-profit-makingorganizations. They also found that size is more strongly related to the implementation of proprietary system than to the initiation of innovation (OSS system) in organizations. These findings are consistent with the results of the comparison by Lee et al. (2010) and also induce a conclusion that large organizations are reluctant to adopt OSS EIS.
On the other hand, since OSS ERP is more affordable, SMBs are the ones which are more likely to try out the free software as an alternative of expensive proprietary ERP. There are, however, an increasing number of large firms using OSS EIS, such as Home Depot, Toyota, and Fidelity (Weber, 2005). This indicates that OSS EIS receives more focus than before. In recent years, the general OSS development model has gained significant momentum and is now generally considered a viable approach also in commercial settings (Ågerfalk and Fitzgerald, 2008). Because of its nature of virtuality and since anyone can joint any OSS project, the development of on-line community can be assumed to be global (Millar et al. 2005). Agerfalk and Fitzgerald (2008) in their study collected numerous instances of research that confirm the global nature of contributions to open source projects (Lakhani and Wolf, 2001; Ghosh et al., 2002; Dempsey et al., 2002; Robles-Martinez et al., 2001).
2.4
OSS EIS MODULES
This dissertation first identifies the extent of OSS EIS module use. To identify the OSS EIS modules that are frequently downloaded by users, the study investigated the top 10 on-line OSS communities shown in Table 1.1. A total of 1,240 OSS EIS projects were collected: 1,199 projects from SourceForge.net; 5 from GitHub; 35 from Launchpad; 1 from TuxFamily. Several items that describe each project were collected: title, description, number of download, and recommendation rate by users. Appendix C has a table that contains the entire lists of OSS projects collected for this research.
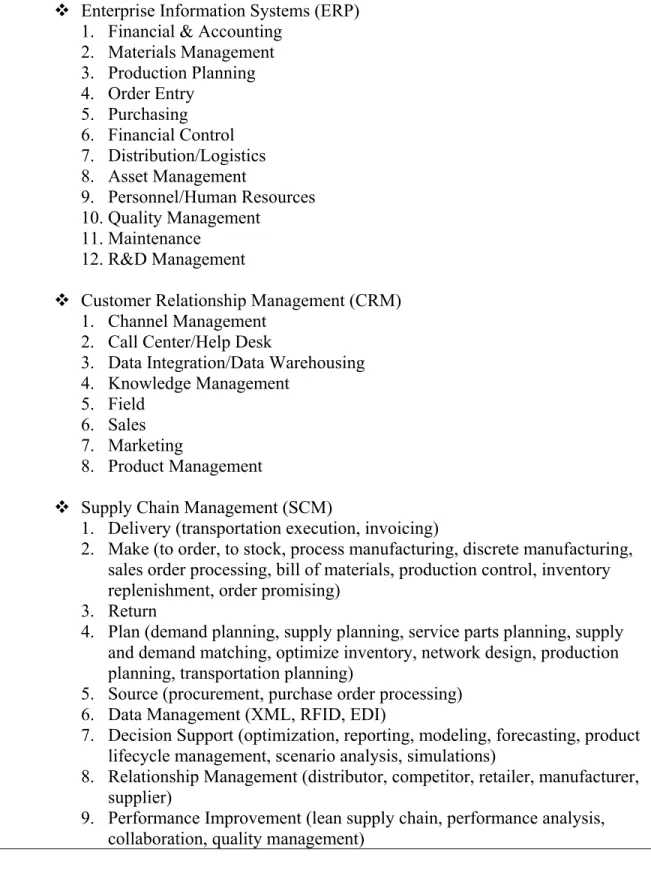
Based on the literature review presented in 2.2, this study develops a comprehensive set of EIS modules as shown in Table 2.5 that were used in the content analysis and the confirmatory analysis consistently. It consists of the following primary categories: ERP, CRM, and SCM, each category has sub categories. KM systems and BI systems are not shown in the top level because in many cases, they match with one of the subcategories of ERP, CRM, or SCM. The 1,240 OSS EIS projects collected from top 10 on-line OSS communities are categorized based on this set of modules and gives the extent of use. The survey on users reveals the actual use of OSS EIS modules. The two results are compared and discussed in Chapter 4.
Enterprise Information Systems (ERP) 1. Financial & Accounting
2. Materials Management 3. Production Planning 4. Order Entry 5. Purchasing 6. Financial Control 7. Distribution/Logistics 8. Asset Management 9. Personnel/Human Resources 10.Quality Management 11.Maintenance 12.R&D Management
Customer Relationship Management (CRM) 1. Channel Management
2. Call Center/Help Desk
3. Data Integration/Data Warehousing 4. Knowledge Management
5. Field 6. Sales 7. Marketing
8. Product Management
Supply Chain Management (SCM)
1. Delivery (transportation execution, invoicing)
2. Make (to order, to stock, process manufacturing, discrete manufacturing, sales order processing, bill of materials, production control, inventory replenishment, order promising)
3. Return
4. Plan (demand planning, supply planning, service parts planning, supply and demand matching, optimize inventory, network design, production planning, transportation planning)
5. Source (procurement, purchase order processing) 6. Data Management (XML, RFID, EDI)
7. Decision Support (optimization, reporting, modeling, forecasting, product lifecycle management, scenario analysis, simulations)
8. Relationship Management (distributor, competitor, retailer, manufacturer, supplier)
9. Performance Improvement (lean supply chain, performance analysis, collaboration, quality management)
2.5
IS SUCCESS MODEL
A large number of studies have been conducted to identify success factors of information systems. Prior studies have focused on various aspects of IS success for three decades (Matlin, 1979; Melone, 1990; DeLone and McLean, 1992; Bonner, 1995; Ballantine et al., 1996; Gable, 1996; Kapalan and Norton, 1996; Myers et al. 1998; Seddon et al, 1999; Irani and Love, 2000; Lin and Shao, 2000; Thatcher and Oliver, 2001; DeLone and McLean, 2002; Rai et al., 2002; Shin, 2003; DeLone and McLean, 2003; Gable et al., 2003; Sedera and Gable, 2004; Sabherwal et al., 2006; Gable et al., 2008; Lee et al., 2009).
Rai et al. (2002) assessed two main IS success models: DeLone and McLean (1992) and Seddon (1997). Their findings support DeLone and McLean’s argument that IS success models need to be carefully specified in a given context. Shin (2003) investigated the effectiveness of the four IS success constructs, system quality, information quality, and service quality on user satisfaction in the context of data warehouse by employing a survey and interview. Sabherwal et al. (2006) developed a theoretical model combining four IS success constructs developed in prior studies. They added four user-related constructs: user experience with IS, user training in IS, user attitude toward IS, and user participation in the development of IS.
Irani and Love (2000) conducted a case study at a leading manufacturing organization during its adoption of a vendor-supplied MRPII. They developed technology management taxonomies that contributed to the successful MRP implementation. Seddon et al. (1999) developed an IS effectiveness matrix for conceptualizing IS success measurements in the two dimensions, the type of system and the type of stakeholder.
Thatcher and Oliver (2001) examined the impact of technology investment on various measures of performance, such as product quality, production efficiency, and firm productivity. Thatcher and Olivers’s study (2001) evaluated IS investments post-implementation. Myers (1998) suggested a comprehensive IS success model by combining prior studies and adding a service quality dimension.
Gable et al. (2003) developed four measurement models and 27 instruments for assessing enterprise system success by employing an exploratory inventory survey followed by a confirmatory weights survey. The four measurement models are information quality, system quality, individual impact, and organizational impact. Sedera and Gable (2004) found the four distinct dimensions of IS success in the context of enterprise information systems – individual impact, organizational impact, system quality, and information quality.
Prior studies discussed here have heavily referred to DeLone and McLean’s works (1992, 2002, 2003). The DeLone and McLean (1992) IS success model is most widely cited and has provided valuable contributions to the literature of IS success. DeLone and McLean (1992) introduced their first edition of a comprehensive taxonomy with six major dimensions – system quality, information quality, use, user satisfaction, individual impact, and organizational impact. Their study on IS success model was based on the review of 180 conceptual and empirical studies.
As the output of an information system or the message in a communication system, information can be measured at different levels, including the technical level, the semantic level, and the effectiveness level (Shannon and Weaver, 1949). For Shannon and Weaver (1949), these were defined as accuracy and efficiency of the system, the
success of the information in conveying the intended meaning, and the effect of the information on the receiver, respectively. Based on this concept, DeLone and McLean argued that information flows through a series of states from its production through its use or consumption to its influence on individual and/or organizational performance. The six distinct dimensions of IS success developed by DeLone and McLean (1992) matching with Shannon and Weaver’s (1949) three dimensions are: system quality at technical level; information quality at semantic level; and use, user satisfaction, individual impact, and organizational impact at effectiveness level.
The present study built, as an expansion of the general IS success model, an OSS EIS success model employing seven constructs: Information Quality, OSS EIS Quality, Community Service Quality, OSS Use, User Satisfaction, Individual Net Benefit, and Organizational Net Benefit.
2.5.1
SYSTEM QUALITY
System quality construct has been represented in some of prior research as ease of use to measure the quality of an information system itself. Some IS researchers have studied the processing system itself to evaluate the contribution of information systems to the organization. Rai et al. (2002) utilized user friendliness and ease of use as the two instruments to measure system quality. For his IS success study in the context of data warehouse, Shin (2003) included system throughput, ease of use, ability to locate data, access authorization, and data quality (currency, level of detail, accuracy, consistency). Wixom and Todd (2005) defined reliability, flexibility, integration, accessibility, and
timeliness as the measures of system quality in their combined model of user satisfaction and technology acceptance.
Sabherwal et al. (2006) defined system quality as the quality of the system in terms of reliability, ease of use, and response time. Their work separated user-related constructs and context-related constructs from prior IS success models. They used systems quality as a construct representing IS success. Gable et al. (2003) used system quality as a construct of success for enterprise information systems. Sedera and Gable (2004) found nine validated items to measure system quality for enterprise system success. The nine items include: ease of use, ease of learning, user requirements, system fearues, system accuracy, flexibility, sophistication, integration, and customization.
2.5.2
INFORMATION QUALITY
Information quality is to measure outputs of an information system. Wixom and Todd (2005) developed an integrated research model based on two research stream, user satisfaction literature and technology acceptance literature. They defined completeness, accuracy, format, and currency as four information quality antecedents. Rai et al. (2002) developed seven items to measure information quality, which has the attributes of content, accuracy, and format required by the user. Shin (2003) investigated information quality dimension by measuring the utility (usefulness) of information acquired from a data warehouse. Some IS researchers have preferred to measure the quality of the information that the system produces, primarily in the form of reports. Gable et al. (2003) used information quality as an IS success factor of enterprise systems.
Ahituv (1980) developed five information characteristics: accuracy, timeliness, relevance, aggregation, and formatting. Swanson (1974) developed measurements, such as uniqueness, conciseness, clarity, and readability to measure IS appreciation among user managers. King and Epstein (1983) proposed multiple information attributes including sufficiency, understandability, freedom from bias, reliability, decision relevance, comparability, and quantitativeness to yield a composite measure of information value. Iivari and Koskela (1987) included three information quality constructs: informativeness, which consists of relevance, comprehensiveness, recentness, accuracy, and credibility; accessibility which consists of convenience, timeliness, and interpretability; and adaptability.
2.5.3
SERVICE QUALITY
Service quality is to measure the extent of service that IS users experience from communities. Communities, in our context of OSS EIS, include on-line communities or partners who provide OSS EIS and/or supports to organizations. Researchers who argue to include service quality as a measure of IS success apply the 22-item SERVQUAL measurement instrument. SERVQUAL measurement includes five dimensions: tangible, reliability, responsiveness, assurance, and empathy. Examples of the instruments are: “IS has up-to-date hardware and software” (tangible); “IS is dependable” (reliability); “IS employees give prompt service to users” (responsiveness); “IS employees have the knowledge to do their job well” (assurance); “IS has users’ best interests at heart” (empathy) (DeLone and McLean, 2003).
Parasuraman et al. (1988) originally developed the 22-item SERVQUAL instrument for assessing customer perceptions of service quality in service and retailing organizations. There were some controversies between Parasuraman et al.’s (1988) work and other studies regarding the discrepancy between expectations and perceptions (Cronin and Taylor, 1992; Teas, 1993) and difference score conceptualization (Brown et al., 1993). Asubonteng et al. (1996) compared Parasuraman et al.’s work (1988) with other studies in terms of the scale’s psychometric properties. Lee et al. (2000) confirmed that perceived service quality is an antecedent of satisfaction.
Yang et al. (2004) claimed the difficulty of defining and interpreting the meaning of service quality in Web sites. Service quality dimensions differ according to the context. It is hard to develop a global measure of service quality for IS. DeLone and McLean (2003) defined service quality in e-commerce context as “the overall support delivered by the service provider, applies regardless of whether this support is delivered by the IS department, a new organizational unit, or outsourced to an Internet service provider (ISP). Its importance is most likely greater than previously since the users are now our customers and poor user support will translate into lost customers and lost sales (p.25).” Shin (2003) included user training as construct for service quality for a IS success model. Yang et al. (2005) validated five instruments to measure service quality on a Web portal. The instruments include: usability, usefulness of content, adequacy of information, accessibility, and interaction. Pitt et al. (1995) insisted to include service quality in assessment package of IS success.
2.5.4
SYSTEM USE
System use use is an indicator that shows the extent of OSS EIS use by individual users. Rai et al. (2002) measured ‘utilization’ for IS use through an instrument. Utilization is the degree to which the user is dependent on the IS for the execution of their tasks. Sabherwal et al. (2006) used system use as a construct to measure the individual’s behavior of, or effort put into, using the system.
2.5.5
USER SATISFACTION
User satisfaction is to measure recipients’ response to the use of the output of an information system. Sabherwal et al. (2006) used user satisfaction as a construct for IS. Chen et al. (2000) and Ginzberg (1981a, b) chose user satisfaction as his dependent variable. Some IS researchers have suggested user satisfaction as a success measure for their empirical IS research (Ein-Dor and Segev, 1978; Hamilton and Chervany, 1981). Rai et al. (2002) defined user satisfaction as perceptual measures of net benefits from IS use for their study in assessing the validity of IS success models.
2.5.6
INDIVIDUAL IMPACT
Individual impact is to measure the effect of information on the behavior of the recipient. Impact is probably the most difficult measure to define in a non-ambiguous fashion. It is closely related to performance, and so "improving my - or my department's - performance" is certainly evidence that the information system has had a positive impact. Sabherwal et al. (2006) defined individual impact as perceived usefulness in their work of