National Institutes of Health Loan Repayment Program
Evaluation Working Group
Milton Hernandez, Chair National Institute of Allergy and Infectious Disease
Steve Boehlert
Division of Loan Repayment Frank Calvo
National Institute of Diabetes and Digestive and Kidney Diseases James Corrigan
National Cancer Institute Paul Johnson
National Institute of Child Health and Human Development
Steve Korn
National Institute of Neurological Disorders and Stroke
Matthew Lockhart
Division of Loan Repayment Sherry Mills
Office of Extramural Research Richard Phillips
Division of Loan Repayment Peggy Reed
Division of Loan Repayment Carl Roth
National Heart, Lung, and Blood Institute
Mercedes Rubio
National Institute of Mental Health Jennifer Sutton
Office of Extramural Research
Study Director Laurel Haak Discovery Logic Analysts
Beth Masimore, Rajan Munshi, Matt Probus, Yvette Seger Discovery Logic
TABLE OF CONTENTS
EXECUTIVE SUMMARY 1 Findings 1
Who is Applying? 1
Do the LRPs Retain Participants? 2
How do the LRPs Compare to Other NIH Mentored Career Awards Programs? 2 Conclusions and Recommendations 2
HISTORY OF THE NIH EXTRAMURAL LRP 3 EVALUATION OBJECTIVES 5 RESEARCH DESIGN 5 Scope 5 Data Sources 6 Statistics 6 Applicant Pool 6 Impact of Participation 6
Comparison with Other NIH Mentored Career Awards 6 QUESTION 1: WHO IS APPLYING? 7
1.1 Goals 7 1.2 Methods 7 1.3 New Applicants 7
1.3.1 New applications and awards, by program and IC 7 1.3.2 New applications and awards, by gender 9
1.3.3 New applications and awards, by race and ethnicity 10 1.3.3.1 Distribution of ethnicity 10
1.3.3.2 Distribution of race 11
1.3.3.3 Distribution of ethnicity / race and gender 13 1.3.3.4 Distribution of ethnicity / race by IC 14 1.3.4 New applications and awards, by degree type 15
1.3.4.1 Distribution of degree types 15
1.3.4.2 Distribution of degree types and gender 15 1.3.4.2.1 Degree by gender 16
1.3.4.2.2 Gender by degree 16 1.3.4.3 Distribution of degree types by IC 16 1.3.5 New applications and awards, by LRP 17
1.3.5.1 Distribution of IC and LRP 17 1.3.5.2 Distribution of gender and LRP 17
1.3.5.2.1 LRP by gender 18 1.3.5.2.2 Gender by program 18 1.3.5.3 Distribution of degree types and LRP 18 1.3.6 New applications and awards, by years since degree 19
1.3.6.1 Distribution of years since degree and degree type 19 1.3.6.2 Distribution of years since degree and gender 21 1.3.7 New applications and awards, by prior research support 22 1.3.8 New applications and awards, by educational debt level 23
1.3.8.1 Distribution of educational debt level 23
1.3.8.2 Distribution of educational debt level and degree type 24 Summary of Findings: FY03-FY07 Extramural New Applicant Pool 26 1.4 Renewal Applicants 27
1.4.1 Renewal applications and awards 27
1.4.2 Renewal applications and awards, by degree type 29
1.4.3 Renewal applications and awards, by educational debt level 29 Summary of Findings: FY03-FY07 Extramural Renewal Applicant Pool 30
QUESTION 2: DOES THE LRP RETAIN PARTICIPANTS IN THE NIH EXTRAMURAL WORKFORCE? 31
2.1 Goals 31 2.2 Methods 31
2.3 Analysis of the Study Cohort 32
2.3.1 Comparison of the study cohort and the total new applicant pool 32 2.3.2 Comparison of funded and not funded applicants in the study cohort 33 2.4 Subsequent Participation in NIH Grant Programs 33
2.4.1 Composite Analysis 33 2.4.2 Gender 35
2.4.3 Degree Type 35 2.4.4 Program 36
Summary of Findings: Retention in the NIH Workforce 38 2.5. Publications and Citations 39
Summary of Findings: Publications and Citations 40
2.6. Outcomes Analysis for Applicants without Subsequent NIH Records 41 2.6.1 Current Affiliation 41
2.6.2 Current Position 42
QUESTION 3: HOW DOES THE LRP COMPARE WITH MENTORED K AWARDS? 43 3.1 Goals 43 3.2 Methods 43 3.3 Demographic Distribution 43 3.3.1 Gender 45 3.3.2 Degree type 45
3.3.3 Subsequent Participation in NIH Grant Programs 46 3.3.4 Composite Analysis 46
3.3.5 Gender 47 3.3.6 Degree Type 48 3.4 Publications and Citations 49
Summary of Findings: Comparison of LRP with Mentored K Awards—Top 10% 51 APPENDIX 1: DETAILS BY IC 52
A1.1. New and Renewal Applications and Awards, by IC 52 A1.2. New Applications and Awards, by IC and LRP 53 A1.3. New Awards, by IC and Degree Category 54 APPENDIX 2: DEGREE CLASSIFICATIONS 56
APPENDIX 3: DETAILED OUTCOMES METHODS 58
A3.1. Construction of the Funding Bubble 58 A3.2. Determination of Subsequent NIH Activity 60
A3.3. Matching Applicants to MEDLINE Publication Records 60 A3.4. Manual Error Checking 61
FIGURES
Figure 1. Distribution of new LRP applications, FY03-FY07 7
Figure 2. Gender distribution of new male and female LRP applicants, and success rates in each fiscal year, FY03-FY07 9
Figure 3. Percent of new extramural Hispanic or Latino LRP applicants and awardees in each fiscal year between FY03-FY07 11
Figure 4. Percent of new extramural LRP applicants in the shown racial categories in each fiscal year from FY03-FY07 12
Figure 5. Success rates of new LRP applicants in the listed racial categories in each fiscal year, FY03-FY07 13
Figure 6. Gender distribution of ethnicity and race of new LRP applicants from FY03-FY07 14 Figure 7. IC distribution of ethnicity and race of new LRP applicants from FY03-FY07 14 Figure 8. Gender distribution of new LRP applicants, by degree type, FY03-FY07 16 Figure 9. Gender distribution of new extramural applicants by LRP, FY03-FY07 17
Figure 10. Distribution of degree type of new LRP applicants in each of the five LRPs, FY03-FY07 18
Figure 11. Distribution of years since degree of new LRP applicants, FY03-FY07 19 Figure 12. Years since degree distribution of new LRP applicants, FY03-FY07 20
Figure 13. Interval distribution of years since degree of new LRP applicants, FY03-FY07 21 Figure 14. Gender by years since degree of new LRP applicants, FY03-FY07 21
Figure 15. Prior research support of new extramural LRP applicants and awardees, FY03-FY07 22
Figure 16. Percent of new extramural LRP awardees FY03-FY07 by prior support source 22 Figure 17. Correlation between applicant reported and DLR verified educational debt level of
new LRP applicants, FY03-FY07 23
Figure 18. Reported educational debt level of new extramural LRP applicants, FY03-FY07 24 Figure 19. Distribution of reported educational debt level of new extramural LRP applicants with
different degree types, FY03-FY07 25
Figure 20. Distribution of renewal extramural LRP applications, FY03-FY07 27
Figure 21.Number of renewal LRP applications and awards in each fiscal year, FY03-FY07 28 Figure 22. Identifying applicants on the “Funding Bubble” 31
Figure 23. Composite analysis of outcomes for the funded and not funded groups in the study cohort 34
Figure 24. Analysis of outcomes, by gender, of subsequent NIH grant participation 35 Figure 25. Analysis of outcomes, by degree type, of subsequent NIH grant participation 36 Figure 26. Analysis of outcomes, by degree type, of subsequent NIH grant participation 37 Figure 27. Distribution of the number of articles published by applicants in the study cohort 39 Figure 28. Distribution of the number of articles published by applicants in the study cohort for
FY03-FY04 39
Figure 29. Distribution of the number of citations for articles published by applicants in the study cohort for FY03-FY08 40
Figure 30. Current affiliation of applicants without subsequent NIH records 41 Figure 31. Current position of applicants without subsequent NIH records 42
Figure 32. Definitions of each comparison cohort and the number of awardees in each group 43
Figure 33. Gender distribution of LRP, K, and LRP+K Top-10% awardee cohorts 45
Figure 34. Distribution of degree type of the LRP, K, and LRP+K Top-10% awardee cohorts 46 Figure 35. Composite analysis of outcomes for the LRP, K, and LRP+K Top-10% awardee cohorts
47
Figure 36. Analysis of outcomes, by gender, of subsequent NIH grant participation of the LRP and the K Top-10% awardee cohort 48
Figure 37. Analysis of outcomes, by degree type, of subsequent NIH grant participation of the LRP and the K Top-10% awardee cohort 49
Figure 38. Distribution of the number of articles published by the LRP, K, and LRP+K Top-10% awardee cohorts 50
Figure 39. Distribution of the number of citations for articles published by the LRP, K, and LRP+K Top-10% awardee cohorts 50
Figure A3.1. Schematic outline of the steps used for the generation of the FY-IC Bubble 59 TABLES
Table 1. Number of new LRP applications and awards, FY03-FY07 8 Table 2. Supporting ICs for each LRP 8
Table 3. Degree distribution of new LRP applicants and awardees, FY03-FY07 15
Table 4. Proportion of new extramural LRP awards to physician researchers at ICs that state a funding preference for physician researchers, FY03-FY07 17
Table 5. Number of renewal extramural LRP applications and awards, FY03-FY07 28
Table 6. Distribution of degree types for renewal extramural LRP applicants and awardees, FY03-FY07 29
Table 7. Distribution of renewal awards by initial educational debt for extramural LRP awardees, FY03-FY07 29
Table 8. Demographic distribution of funded and not funded applicants, and comparison to total new applicant pool 33
Table 9. Available information on career outcomes for applicants without subsequent NIH records 41
Table 10. Demographic distribution of total LRP, K, and LRP+K Top-10% awardee cohorts 45 Table 11. Demographic distribution of the 0-6 YSD LRP, K, and LRP+K Top-10% awardee cohorts
45
Table A1.1. Distribution (number and percent of total) of new extramural LRP applications and awards at each IC, FY03-FY07 52
Table A1.2. Distribution (number and percent of total) of renewal extramural LRP applications and awards at each IC, FY03-FY07 53
Table A1.3. Success rate of new Clinical Research LRP applications by IC, FY03-FY07, 54 Table A1.4. Success rate of new Pediatric Research LRP applications by IC, FY03-FY07, 54 Table A1.5. Percent of new extramural LRP awards to physician doctorates and academic
doctorates by IC, FY03-FY07 55
Table A2.1. Classification of LRP applicant degrees 56 Table A2.2. Degree definitions and classifications 57
EXECUTIVE SUMMARY
The National Institutes of Health (NIH) Extramural Loan Repayment Program (LRP) is a set of programs that have as a mandate to attract and retain early career health professionals in biomedical and
behavioral research careers. A barrier to entering these careers, particularly for physicians, is believed to be the educational debt burden from student loans. The LRP offers qualified applicants repayment of up to $35,000 per year of eligible educational debt in exchange for a 2-year commitment to conduct qualified research. Awardees may apply for additional one- or two-year renewal contracts.
The extramural NIH Loan Repayment Program is managed by the NIH Office of the Director, Office of Extramural Research, Office of Extramural Programs, Division of Loan Repayment. Since its inception in 2001, NIH has made approximately 7,500 awards totaling more than $347 million in loan repayment funds.
To determine whether the extramural programs are meeting their programmatic goals, DLR carried out a quantitative program evaluation for new extramural LRP applicants from FY2003 to FY2007. The evaluation addressed three key areas:
(1) Are the extramural LRPs attracting early-career clinician researchers with high debt? (2) Do the LRPs positively affect career outcomes for awardees?
(3) How do the LRPs compare to other NIH career development award programs?
Findings
Who is Applying?
The number of new applications has remained fairly constant at about 1900 per year since 2003. The Clinical Research and Pediatric Research LRPs attract and fund over 80% of new applicants. About 46% of applicants receive awards; the success rate decreased beginning in FY2004 as NIH began funding LRP renewal contracts.
The LRPs attract more women than expected based on the demographics of recent PhD and MD classes. Near-equal numbers of men and women applicants have physician doctoral degrees; however, 2.5 times more women applicants have academic doctorates. There is no gender difference in success rate.
The LRPs are attracting more African Americans or Blacks in comparison to the demographics of recent MD and PhD graduating classes. This is largely due to programs funded by the National Center on Minority Health and Health Disparities (NCMHD). There are no racial or ethnic differences in success rate.
The LRPs are attracting biomedical researchers with high debt compared to recent MD and PhD graduating classes.
The LRPs are attracting early career researchers: 72% of new applicants apply within 6 years of receiving their qualifying degree. Most academic doctorates apply within 1-3 years of receiving their degree, while Physician Doctorates tend to apply near the completion of their residency, about 6 years after receiving their degree.
Do the LRPs Retain Participants?
The LRPs are increasing the retention of physician doctorates in the NIH extramural workforce, both through increased grant applications and participation in research activities.
The LRPs are selectively losing women awardees.
At this point in the LRPs history, there is no significant difference between funded and non-funded applicants in research productivity. This may be because the current study examined outcome data for 1-4 years since award, which may be too soon a time point to use to measure productivity for LRP applicants. This may be further accentuated by the fact that LRP participants tend to be early in their career.
How does the LRP Compare to Other NIH Mentored Career Awards Programs?
The LRPs are attracting applicants that are earlier in their research career than the K program. Overall, the top 10% of LRP awardees are more likely to be Academic Doctorates and to be within 3 years of degree than either K or LRP+K top 10% awardees.
The K awardees were more likely to apply for NIH Research Project Grant (RPG) support 1-4 years after their award than the LRP awardees. This follows from the previous finding that the LRP awardees are in a less developed career stage than K awardees and may need time to produce research results that can support a RPG application.
Gender distribution among the top 10% of awardees was similar for LRP and K awardees. However, K awardee women were more likely than their LRP counterparts to apply for subsequent NIH grant support and to be retained in the NIH extramural workforce 1-4 years after award.
Similarly, even though the LRPs have a clear retention effect on physician doctorates, K awardee Physician Doctorates were more likely to apply for and receive subsequent funding, and to be retained in the NIH extramural workforce 1-4 years after award.
Conclusions and Recommendations
These findings suggest that the LRP is attaining its goals and may be a model program for recruiting and retaining early career scientists who otherwise would have a high tendency to leave the biomedical research workforce after earning a doctoral degree.
The LRP appears to be effective in recruiting and retaining its target population, physician doctorates, but is not effective in retaining its largest applicant pool, women PhDs. It would be appropriate to examine program design and retention in more detail to determine how the LRP can better serve women PhDs.
The LRP is attracting early-career researchers, who appear to be in an earlier stage of their career maturation than K awardees. The NIH may consider helping to prepare LRP awardees for
subsequent grant submissions, for example, to the K-awards process, to improve retention in the NIH extramural workforce.
This evaluation focused on researchers 2-5 years after their receipt of the LRP award. While this provides an early indication of whether the program is meeting its goals, it will be important to reassess LRP awardee research productivity in subsequent studies.
HISTORY OF THE NIH EXTRAMURAL LRP
The National Institutes of Health (NIH) Extramural Loan Repayment Program (LRP) is a set of programs that have a mandate to attract andretain early career health professionals in biomedical and behavioral research careers. A barrier to entering these careers, particularly for physicians, is believed to be the high educational debt burden from student loans. The LRP encourages qualified applicants an
opportunity pursue research careers b y repaying their eligible educational debt in exchange for a 2-year commitment to conduct qualified research.1 Awardees may apply for additional one- or two-year renewal contracts.
NIH administers several intramural and extramural LRPs. The intramural LRPs have been offered since fiscal year 1989 and are available to NIH intramural researchers only. The extramural Clinical and Pediatric Loan Repayment Programs (LRP) were established by Congress in 2000.2 The extramural Clinical Research LRP for Individuals from Disadvantaged Background and the LRP for Health
Disparities Research were established under the Minority Health and Health Disparities Research and Education Act of 2000 (Public Law 106-525).3 The extramural Loan Repayment Program for
Contraception and Infertility Researchers awards are made pursuant to the NIH Revitalization Act of 1993 (Pub. L. 103-43), adding section 487B of the Public HealthService (PHS) Act, Loan Repayment Program for Research with Respect to Contraception and Infertility, 42 U.S.C. 288-2.4The Lenfant Committee set NIH policy and procedures for the extramural program.5
1
The LRP provides for the repayment of up to $35,000 of the principal and interest of the extant educational loans of such health professionals for each year of obligated service. Loan repayment benefits represent taxable income. Payments equal to 39 percent of total loan repayments are issued to the Internal Revenue Service on behalf of program participants to offset Federal tax liabilities incurred.
2
The Loan Repayment Program for Clinical Researchers was authorized under the Clinical Research Enhancement Act of the Public Health Improvement Act of 2000 (PL 106-505). The NIH define clinical research as “patient-oriented research that is conducted with human subjects..., or ...involving material of human origin for which an investigator or colleague directly interacts with human subjects...or epidemiologic or behavioral studies, outcomes research or health services research…”. The Loan Repayment Program for Pediatric Research was established under the Children's Health Act (PL 106-310). The Act defines Pediatric Research as research that is “directly related to diseases, disorders, and other conditions in children”.
3 OD-08-089.html; http://grants.nih.gov/grants/guide/notice-files/NOT-OD-08-086.html 4 http://grants.nih.gov/grants/guide/notice-files/NOT-OD-08-087.html 5
See, e.g., http://www.nih.gov/icd/od/foia/icdirminutes/icdir013102.htm; http://deainfo.nci.nih.gov/ADVISORY/ncab/122_0602/mins11Jun02.pdf.
The extramural LRPs are administered by the NIH Office of Extramural Research (OER), Office of Extramural Programs, Division of Loan Repayment (DLR). Twenty-four NIH Institutes and Centers participate in the LRP; their program funding level was set by NIH in FY2003 using a formula basis related to the size of their clinical research portfolio. The five extramural programs are:
(1) The Clinical Research LRP supports individuals who are conducting patient-oriented research with human subjects or research on the causes and consequences of disease in human populations involving material of human origin (such as tissue specimens and cognitive
phenomena) for which an investigator or colleague that requires direct interaction with human subjects in an outpatient or inpatient setting;
(2) The Pediatric Research LRP supports individuals who are conducting studies of diseases, disorders, and other conditions that affect children;
(3) The Health Disparities Research LRP aims to recruit and retain highly qualified health professionals to research careers in basic research, clinical research, or behavioral research directly related to health disparity populations and the medically underserved;
(4) The Clinical Research LRP for Individuals from Disadvantaged Backgrounds offers an
opportunity in clinical research to individuals from a family with an annual income below low-income thresholds published by the U.S. Bureau of the Census;
(5) Finally, the objective of the Contraception and Infertility Research LRP is two-fold: to evaluate, treat or improve conditions which result in the failure of couples to either conceive or bear young, and to provide new or improved methods of preventing pregnancy.
To qualify, LRP applicants must be US citizens or permanent residents, their educational debt must be greater than 20 percent of their annual salary and compensation, they must have a qualifying doctoral degree (except for CIR), and they must be in a position to commit at least 50 percent time (at least 20 hours per week) to research in a qualifying area. An applicant’s research must be funded by a domestic nonprofit or U.S. Government (federal, state, or local) entity, and the institution at which the applicant is engaged in research must provide assurance of research support through the end of the two-year contract. The actual loan repayment amount is determined by a formula that includes the awardee’s educational debt level and annual income.
There is only one application receipt date per year, in early December. Applications are assigned to and reviewed by each participating NIH Institute or Center (IC). Each IC conducts peer review of the
applications using a panel composed of extramural scientists. Review criteria emphasize the potential to become a contributing scientist in the area of the LRP. Standard NIH scoring (100 – 500) is used.
However, this score is only one part of the funding priority.
The extramural Loan Repayment Program has made approximately 7,500 awards from over $347 million in loan repayment funds from FY2001 through FY2007. To determine whether the extramural programs are meeting their programmatic goals, in FY 2008 DLR carried out a quantitative program evaluation of new extramural LRP applicants that submitted an application to the LRP during the FY2003 through FY2007 cycles.
EVALUATION OBJECTIVES
The overall objective of the LRP program evaluation is to determine whether LRP awards are effective in their broad purpose of recruiting and retaining early-career health professionals in biomedical and behavioral research careers. The evaluation addressed the following questions:
1. Who is applying to the extramural Loan Repayment Programs? Is the program attracting the target applicant pool of early-career researchers with high educational debt?
a. How are applications distributed between the five programs?
b. What is the racial, ethnic, and gender distribution of the applicant pool?
c. What is the educational degree distribution of the applicant pool? How soon after earning their qualifying degree are researchers applying to the LRP?
d. What is the educational debt level of LRP applicants?
e. What proportion of LRP awardees are submitting renewal applications?
2. Does participation in the extramural Loan Repayment Program lead to increased retention in the extramural NIH-funded workforce?
a. Are LRP award recipients more likely, less likely, or equally likely than matched non-recipients to apply for and receive subsequent NIH awards? To participate as a non-PI on a NIH research grant?
b. Are there differences in retention by gender or degree?
c. Are LRP award recipients more likely, less likely, or equally likely than non-recipients to publish research articles? How do the citation rates of the two groups compare?
3. How does the LRP compare to other NIH mentored career-development programs for early-career investigators?
a. Are the applicant pools similar?
b. Are retention and publication rates similar between NIH awards programs? Is there an effect of gender or degree on retention?
RESEARCH DESIGN
Scope.The extramural LRP initiated in fiscal year 2001 with the Health Disparities and Clinical Research LRP for Individuals from Disadvantaged Backgrounds LRPs. Then in 2002, NIH received the first
applications for the Clinical and Pediatric LRPs. In FY 2003, NIH started to receive and fund renewal LRP applications. Between 2003 and 2007, the extramural program received 9,820 new applications, of which 4,565 were awarded. 4,092 renewal applications were also submitted, of which 2,937 were awarded.6 The evaluation focused on those years after the renewal program had been established.
6
Note that this evaluation collected application counts as of 3/31 and awards as of 10/1. This differs in some years from the LRP Data Book, which collected application counts on 1/31/2003, 12/31/2003, 3/23/2004, 12/1/2005, 3/31/2006, and 3/31/2007.
Data Sources.The LRP Online Application System (OAS) database was the primary data source used for LRP applicant information. OAS contains records of personal, demographical, institutional, educational, funding, loan, and research project information for all LRP applicants. This information is submitted by applicants and their colleagues via a web interface during the LRP application process. Other activities related to the submission, including eligibility verification, financial vetting, peer-review, and funding decisions are also recorded in this database. Data can be aggregated into fiscal years/cohorts, is independent of prior years, and represents a snapshot of the applications following funding decisions, after which no more activities are recorded/updated.
We used the NIH grants database, IMPAC II, to obtain data on current and subsequent NIH grant applications for LRP and career development awardees. We gathered information on publications from the National Library of Medicine MEDLINE database and information on citations from the Thomson-Reuters ISI Web of Science.
Statistics.We used a Chi-square 2x2 contingency table to assess difference between groups. The p-value was calculated using a Fischer’s exact test.
Applicant Pool.To understand who is applying to the extramural LRP we used data from OAS to analyze the following parameters for new LRP applicants from FY2003 to FY2007: (i) total applications by year; (ii) applications by LRP; (iii) applications by funding NIH Institute or Center (IC); (iv) gender; (v) race and ethnicity (vi) degree type; (vii) years since qualifying degree; (viii) prior research support; and (ix) educational debt level.
Impact of Participation.We used applicant data from OAS and priority score data from IMPAC II to develop matched cohorts of funded and not funded applicants. The cohort for this analysis was defined as unique new LRP applicants from FY2003 to FY2007. Using novel methodology (detailed in Appendix 3), we identified applicants and awardees on the “funding bubble” – the part of the distribution where applicants have an equal chance of being funded or not funded. We used a regression discontinuity design to examine the impact of receiving an LRP on subsequent involvement in the extramural NIH-funded workforce for NIH-funded and not NIH-funded LRP applicants. We used grant data from IMPAC II and Key Personnel data from the IMPAC II Enumeration table to determine subsequent Research Project Grant (RPG) and Fellowship and Training Grant application and awards for all applicants in the bubble. We determined if outcomes for participants varied by gender or degree. We also used a manually-verified automated process to match publications to applicant publications to determine whether productivity differed between the funded and not funded applicants.
Comparison with Other NIH Mentored Career Awards. We used LRP applicant data from OAS and grant data from IMPAC II to select the top 10% of awardees by priority score for LRP as well as the top 10% of mentored K awards, namely K01, K08, and K23 awards. We then performed the same grant outcome and publication productivity analyses as was conducted for the funding bubble group.
QUESTION 1 : WHO IS APPLYING?
1.1 Goals
Investigate the characteristics of the extramural applicant pool to understand who is applying to the program and whether the programs are attracting their target audience of early-career clinical researchers.
1.2 Methods
We defined a set of nine parameters to evaluate the applicant and awardee pool of the program. The parameters examined were: (i) total applications by year; (ii) applications by LRP; (iii) applications by funding NIH Institute or Center (IC); (iv) gender; (v) race and ethnicity (vi) degree type; (vii) years since qualifying degree; (viii) prior research support; and (ix) educational debt level. Single parameter analysis provided valuable information regarding the applicant pool, for example, the number of male and female applicants over the five-year evaluation period. However, this analysis was limited in its ability to evaluate conditional dependencies, for example, the number of male and female applicants with a certain degree type. Thus, to better understand parameter co-dependencies, we performed cross-parameter analyses.
1.3 New Applicants
1.3.1 New applications and awards, by program and IC
From FY2003 to FY2007, LRP received a total of 9,820 new applications and made 4,565 new awards, a success rate of 46%. The Clinical Research LRP received the majority of new applications (57%).
Additionally, 26% were submitted to the Pediatric Research LRP, 13% to the Health Disparities Research LRP, and 2% each to the Clinical Research LRP for Individuals from Disadvantaged Backgrounds LRP and to the Contraception and Infertility Research LRP (Figure 1). A similar distribution was observed for new awards made by each LRP. These data and the success rates for each LRP are presented in Table 1.
Figure 1. Distribution of new LRP applications, FY03-FY07.
Pediatric Research (26%) Clinical Research (57%) Health Disparities Research (13%) Contraception and Infertility Research (2%) Clinical Research for Individuals from Disadvantaged Backgrounds (2%)
The Clinical and Pediatric Research LRPs account for the majority of new applications.
Table 1. Number of new LRP applications and awards, FY03-FY07. LRP New Applications Percent of New Applications
New Awards Percent of
New Awards Success Rate
Clinical Research 5,646 57% 2,631 58% 47% Pediatric Research 2,515 26% 1,102 24% 44% Health Disparities Research 1,314 13% 674 15% 51% Clinical Research for Individuals from Disadvantaged Backgrounds 171 2% 83 2% 49% Contraception and Infertility Research 174 2% 75 2% 43% Total 9,820 4,565 46%
The National Center on Minority Health and Health Disparities (NCMHD) receives all applications submitted to the Health Disparities Research LRP and the Clinical Research LRP for Individuals from Disadvantaged Backgrounds. All applications submitted to the Contraception and Infertility Research LRP are sent to the National Institute of Child Health and Human Development (NICHD). With the exception of NCMHD, the Clinical Research LRP and the Pediatric Research LRP are supported by all participating NIH ICs (Table 2).
Table 2. Supporting ICs for each LRP.
Of the total applications received between FY2003-FY2007, 15% of new applications were referred to NCMHD for review. The National Cancer Institute (NCI) received 13%, the National Heart, Lung, and Blood Institute (NHLBI) and the National Institute of Mental Health (NIMH) each received 11%, and NICHD received 10% of new applications. The complete distribution of new applications and awards for each IC is presented in Appendix 1.
LRP Supporting IC
Clinical Research ICs except NCMHD
Pediatric Research ICs except NCMHD
Health Disparities Research NCMHD
Clinical Research for Individuals
from Disadvantaged Backgrounds NCMHD
Contraception and Infertility
1.3.2. New applications and awards, by gender
The National Science Foundation reports that in recent years, men received 52.5% of biological sciences Ph.D. degrees while women received 47.5%.7 The American Association of Medical Colleges reports that 55.8% of M.D. degrees were earned by men and 44.2% by women.8 Among biomedical postdoctoral researchers, 60.8% were male and 39.2% were female.9
To analyze gender distribution in the loan repayment program, we determined the number of men and women who applied for a new LRP award from FY2003 to FY2007. In contrast to what one may expect based on the potential pool of applicants among recent Ph.D. and M.D. graduates and postdoctorates, more new applications were submitted by women (53%) than men (44%).10 This distribution and success rate is shown in Figure 2. The higher proportion of women LRP applicants is observed throughout the reporting period. The success rates for men and women are not significantly different.
Figure 2. Gender distribution of new male and female LRP applicants, and success rates in each fiscal year, FY03-FY07.
7
National Science Foundation (2008). Women, Minorities, and Persons with Disabilities in Science and Engineering, Table F-11. National Science Foundation: Arlington, VA. http://www.nsf.gov/statistics/wmpd/figf-1.htm. We chose the 2001-2005 timeframe to calculate gender distribution as most PhDs apply for the LRP within one year of degree.
8 Association for American Medical Colleges (2008). AAMC Data Book: Medical Schools and Teaching Hospitals by the Numbers, Table B10. AAMC: Washington DC. We chose the 1997-2001 timeframe as most MDs apply for the LRP 4-6 years after degree.
9 National Science Foundation (2008). Women, Minorities, and Persons with Disabilities in Science and Engineering, Table G-2. National Science Foundation: Arlington, VA. http://www.nsf.gov/statistics/wmpd/postdoc.htm. We calculated the average gender distribution from 2001-2005.
10
3% of applicants did not specify gender.
0% 10% 20% 30% 40% 50% 60% 70% 0% 10% 20% 30% 40% 50% 60% 70%
FY03
FY04
FY05
FY06
FY07
Su
cc
ess
Ra
te
P
e
rce
n
t
o
f
N
e
w
L
R
P
A
p
p
lica
ti
o
n
s
Female Applicants Male Applicants
Success Rate (Female) Success Rate (Male)
More new applications were submitted by women. Success rates between genders were not significantly different.
1.3.3. New applications and awards, by race and ethnicity
Race and ethnicity data are self-reported on the LRP application form. The 1997 Office of Management and Budget (OMB) Directive 15 classifies race and ethnicity separately. This standard includes collecting and reporting data on two ethnic categories (Hispanic or Latino11, and Not Hispanic or Latino) and five racial categories (American Indian or Alaska Native12, Asian13, Black or African American14, Native Hawaiian or Other Pacific Islander15, and White16). Until FY 2008, the application form did not separate the ethnicity designation from the race designation; however applicants were allowed to select one or more, thus allowing them to select ethnicity and race. Analysis of race and ethnicity for this report is in accordance with OMB Directive 15, as described below.
The National Science Foundation reports that Hispanics received 4.5% of biological sciences Ph.D. degrees, Blacks 3.2%, Asians 12.7%, Native Americans 0.3%, and Whites 76%.17 The American
Association of Medical Colleges reports that 6.4% of M.D. degrees were earned by Hispanics, 7.1% by Blacks, 19.8% by Asians, 0.8% by Native Americans, and 64.1% by Whites.18 Detailed data on the race/ethnicity of postdoctoral researchers are not readily available.
1.3.3.1 Distribution of ethnicity
From FY2003-FY2007, the number of new LRP applicants who self-identified as Hispanic or Latino during each fiscal year is shown in Figure 3. Between 5-7% of new LRP applicants identified themselves as belonging to this ethnic category; similar proportions were observed for new awardees as well (5-8%). The success rate is not significantly different from the overall applicant pool.
11
Hispanic or Latino: A person of Cuban, Mexican, Puerto Rican, South or Central American, or other Spanish culture or origin, regardless of race.
12 American Indian or Alaska Native: A person having origins in any of the original peoples of North, Central, or South America, and who maintains tribal affiliations or community attachment.
13
Asian: A person having origins in any of the original peoples of the Far East, Southeast Asia, or the Indian subcontinent including, for example, Cambodia, China, India, Japan, Korea, Malaysia, Pakistan, the Philippine Islands, Thailand, and Vietnam.
14
Black or African American: A person having origins in any of the black racial groups of Africa.
15 Native Hawaiian or Other Pacific Islander: A person having origins in any of the original peoples of Hawaii, Guam, Samoa, or other Pacific Islands.
16
White: A person having origins in any of the original peoples of Europe, the Middle East, or North Africa. 17 National Science Foundation (2008). Women, Minorities, and Persons with Disabilities in Science and Engineering, Table F-11. National Science Foundation: Arlington, VA.
http://www.nsf.gov/statistics/wmpd/figf-1.htm. We chose the 2001-2005 timeframe to calculate gender distribution as most PhDs apply for the LRP within
one year of degree. 18
Association for American Medical Colleges (2008). AAMC Data Book: Medical Schools and Teaching Hospitals by the Numbers, Table B8. AAMC: Washington DC. We chose the 1997-2001 timeframe as most MDs apply for the LRP 4-6 years after degree.
Figure 3. Percent of new extramural Hispanic or Latino LRP applicants and awardees in each fiscal year between FY03-FY07. Also shown is the success rate for the Hispanic or Latino and the Not Hispanic or Latino ethnic groups
1.3.3.2 Distribution of race
Data on race were analyzed by placing an applicant in one category only. Applicants who self-identified themselves in more than one category were assigned to a distinct multi-racial category. Those applicants who declined to respond to the question were classified in another distinct category, “Other/No
Response”. The distribution of race of applicants is shown in Figure 4. 0% 10% 20% 30% 40% 50% 60% 70% 0% 2% 4% 6% 8% 10% 12% 14%
FY03
FY04
FY05
FY06
FY07
Su
cce
ss
R
at
e
P
e
rce
n
t
o
f
N
e
w
L
R
P
A
p
p
lica
ti
o
n
s
an
d
A
w
ar
d
s
Applicants AwardeesSuccess Rate (Hispanic or Latino) Success Rate (Not Hispanic or Latino)
Success rate for Hispanic or Latino applicants is not different from theoverall
Figure 4. Percent of new extramural LRP applicants in the shown racial categories in each fiscal year from FY03-FY07.19
Asians represented ~10% of new applicants in each fiscal year between FY2003-FY2007, proportionately less than in recent PhD and MD classes. Blacks or African Americans represented between 9-12% of the new applicant pool during this reporting period, more than in recent MD and PhD classes. American Indians or Native Alaskans represented <1% of the new LRP applicants, as did Native Hawaiians or Other Pacific Islanders (<1%). Over the reporting period, Whites constituted an average of 64% of the new applicant pool, while multi-racial applicants comprised ~2% of applicants. On average, 9% of applicants declined to self-identify at the time of application to the LRP. The success rate for each racial category, shown in Figure 5, did not differ from each other or from the average overall success rate.
19
To avoid compression on the y-axis because of the difference between the proportion of White applicants and the other racial categories, this racial category is not represented in Figure 4. The distribution of Whites for each fiscal year is: 67% (FY03), 66% (FY04), 63% (FY05), 62% (FY06), and 63% (FY07).
0% 2% 4% 6% 8% 10% 12% 14%
FY03
FY04
FY05
FY06
FY07
P
e
rce
n
t
o
f
N
e
w
L
R
P
A
p
p
lica
n
ts
American Indian or Alaska Native Asian
Black or African American
Native Hawaiian or Other Pacific Islander More Than One Race
Asians represented proportionally fewer new applicants than in
recent PhD and MD classes, whereas Blacks and African Americans represented more of the
Figure 5. Success rates of new LRP applicants in the listed racial categories in each fiscal year, FY03-FY07. Due to the small sample size of the American Indian or Alaska Natives and the Native Hawaiian or Other Pacific Islanders, the success rate for these racial groups is not shown.
1.3.3.3 Distribution of ethnicity / race and gender
Figure 6 shows the distribution of ethnicity and race of new male and female applicants between FY2003-FY2007. For most categories, significantly more women applied than men.20
20
We were not able to measure significance for Hawaiian and Pacific Islanders due to small sample size. 0% 10% 20% 30% 40% 50% 60% 70% 80%
FY03
FY04
FY05
FY06
FY07
Su
cce
ss
R
at
e
,
N
e
w
L
R
P
A
p
p
lica
n
ts
Asian Black or African American
White More than One Race
There was no significant difference in success rates among racial categories or in
comparison to the average success rate of 46%.
Figure 6. Gender distribution of ethnicity and race of new LRP applicants from FY03-FY07.
1.3.3.4 Distribution of ethnicity / race by IC
Figure 7 shows the distribution of ethnicity and race of new applicants by IC between FY2003-FY2007. The NCMHD LRPs account for the majority of applications by Blacks and Hispanics.
Figure 7. IC distribution of ethnicity and race of new LRP applicants from FY03-FY07.
0% 10% 20% 30% 40% 50% 60% 70% A m e ri ca n In d ia n o r A la sk a N ati ve A si an B la ck o r A fr ic an A m e ri ca n H isp an ic o r La ti n o N ati ve H aw ai ia n o r Oth e r P ac if ic … W h ite Mo re Th an On e R ac e
P
e
rce
n
t
o
f
N
e
w
L
R
P
A
p
p
lica
ti
o
n
s
All IC All IC except NCMHD NCMHD only
Across races and ethnicities, significantly more women applied to LRPs than men. The majority of applications by Blacks and Hispanics
were made to the NCMHD LRPs.
1.3.4. New applications and awards, by degree type
To determine how successful the LRP has been in attracting early career health professionals in clinical research careers, we examined degree type and how long after earning a doctoral degree a person applied to the program.21 Details about degree classification, including degree abbreviations, are included in Appendix 2.
1.3.4.1 Distribution of degree types
Table 3 shows the distribution of degree types for new applicants and awardees between FY2003-FY2007. Applicants with physician doctorates and with academic doctorates are represented at similar proportions (47% and 42%, respectively), with 6% of applicants having a dual physician
doctorate/academic doctorate. Five percent of applicants had a professional clinical degree, while <1% were allied health professionals.
Table 3. Degree distribution of new LRP applicants and awardees, FY03-FY07.
Degree Type New LRP
Applications % New LRP Applications New LRP Awards % New LRP
Awards Success Rate
Physician Doctorate 4,663 47% 2,134 47% 46% Professional Clinical Doctorate 442 5% 135 3% 31% Academic Doctorate 4,130 42% 1,915 42% 46% Physician Doctorate / Academic Doctorate 551 6% 368 8% 67% Allied Health Professional 34 <1% 13 <1% 38% Total 9,820 4,565
1.3.4.2 Distribution of degree types and gender
We examined the differences in the number of men and women applicants by gender and by degree. This cross-parameter analysis revealed gender differences, shown in Figure 8.
21
While a doctoral-level degree is a prerequisite for submitting an LRP application, the Contraception and Infertility Research LRP accepts applications from non-doctoral-level allied health professional degree holders, defined as those individuals with a bachelor’s and/or master’s degree in a relevant discipline.
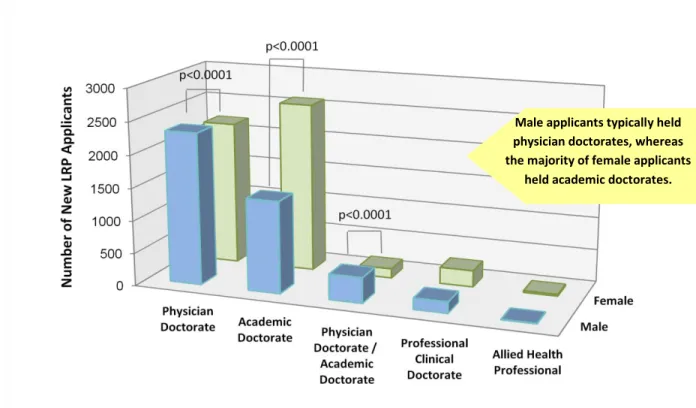
Figure 8. Gender distribution of new LRP applicants, by degree type, FY03-FY07
1.3.4.2.1 Degree by gender: Of all new male applicants (blue bars, Figure 8), a majority (54%) were physician doctorates and 33% were academic doctorates. In comparison, of all new women applicants (green bars, Figure 8), 42% were physician doctorates and 50% were academic doctorates.
1.3.4.2.2 Gender by degree: When comparing the distribution of men and women applicants across degree categories (i.e., comparing blue to green bars in Figure 8), there are significant gender
differences in the proportion of applications from physician doctorates, academic doctorates, and dual physician doctorate/academic doctorates.
1.3.4.3 Distribution of degree types by IC
Another way to examine whether the LRP is reaching its intended audience is to test whether the applicant pool matches IC funding preferences. Of the 24 funding ICs, five have a publicly-stated preference for the type of doctoral degree an LRP applicant holds: the National Institute of Allergy and Infectious Diseases (NIAID), the National Institute of Biomedical Imaging and Bioengineering (NIBIB), NICHD, the National Institute of General Medical Sciences (NIGMS), and the National Institute of Neurological Disorders and Stroke (NINDS).22 Table 4 shows the distribution of degree types of the awardees at these ICs.
22
Based on the preference statements provided by each IC, posted on the LRP Web site at www.lrp.nih.gov. Male applicants typically held physician doctorates, whereas the majority of female applicants
Table 4. Proportion of new extramural LRP awards to physician researchers at ICs that state a funding preference for physician researchers, FY03-FY07.
IC
Percent of new LRP awards to physician doctorates, FY03-FY07 NIAID 77% NIBIB 44% NICHD 53% NIGMS 79% NINDS 72%
The other 19 participating ICs did not state a preference for applicant degree type. Details about the degrees of LRP recipients by IC are presented in Appendix 1.
1.3.5. New applications and awards, by LRP
1.3.5.1 Distribution of IC and LRP
The Clinical Research LRP and the Pediatric Research LRP were supported by all ICs except NCMHD, which does not participate in either program. Details about the participation of various ICs in the different LRPs are presented in Appendix 1.
1.3.5.2 Distribution of gender and LRP
To determine if there were any differences in the number of LRP applicants based on gender, a cross-parameter analysis was done of men and women applicants in each of the five LRPs, shown in Figure 9.
Figure 9. Gender distribution of new extramural applicants by LRP, FY03-FY07.
A greater proportion of women applied to the Health Disparities Research
1.3.5.2.1 LRP by gender: Of all new male applicants, (blue bars, Figure 9), a majority (64%) applied to the Clinical Research LRP and 24% applied to the Pediatric Research LRP. This distribution was also seen among women applicants (green bars, Figure 9): a majority (51%) applied to the Clinical Research LRP and 27% applied to the Pediatric Research LRP. It is interesting to note that a greater proportion of women applications (17%, green bar) applied to the Health Disparities Research LRP than male applicants (9%, blue bar).
1.3.5.2.2 Gender by program: When comparing the distribution of men and women applicants in each of the five degree type categories (i.e., comparing blue vs. green bars in Figure 9), for all programs, there was a significant gender difference in the proportion of men and women applying. Proportionately more men applied to the Clinical Research program, and more women applied to the other four LRPs.
1.3.5.3 Distribution of degree types and LRP
We performed a cross-analysis of degree and LRP to determine what proportion of degree types submitted applications to each of the LRPs. As expected by the preferences of each IC and the
differential representation of IC per LRP, the five degree types are not equally represented in each of the LRPs (Figure 10). This parameter set interrelates with the differential gender representation in the various programs: one would expect and we in fact did see more women in programs that have more academic doctorates. Health Disparities Research was the only LRP that attracted many more academic doctorates than physician doctorates: 74% of new applicants to this LRP were academic doctorates.
Figure 10. Distribution of degree type of new LRP applicants in each of the five LRPs, FY03-FY07.
0% 10% 20% 30% 40% 50% 60% 70% 80% 90% 100% Clinical Research Pediatric Research Health Disparities Research Clinical Research for Individuals from Disadvantaged Backgrounds Contraception and Infertility Research
P
e
rce
n
t
o
f
N
e
w
L
R
P
A
p
p
lica
n
ts
Allied Health Professional Degree Physician Doctorate / Academic Doctorate Academic Doctorate
Professional Clinical Doctorate Physician Doctorate
Physician doctorates represented a majority of applicants for most of the LRPs except Health Disparities
Research, which had a majority of academic
1.3.6. New applications and awards, by years since degree
1.3.6.1 Distribution of years since degree and degree type
To determine if the program is attracting early career researchers, we analyzed years since qualifying degree for new applicants for the entire reporting period (FY2003-FY2007). Time since degree is dependent on a number of factors, including postdoctoral training, medical residency and internship, and available research support and resources. Figure 11 shows the distribution of number of
applications and awards plotted against the years since receiving a qualifying degree. Seventy-two percent of new applicants apply within six years of receiving their degree. Ninety percent of new applicants apply within nine years of receiving their degree. Of those applicants who applied after 10 years of receiving their qualifying degree 58% were Physician Doctorates, 19% were Academic
Doctorates, 18% were dual Physician Doctorates/Academic Doctorates, 56% were men, and 41% were women—a very different distribution than that of the overall applicant pool.
Figure 11. Distribution of years since degree of new LRP applicants, FY03-FY07.
The peaks observed at one and five years since degree suggest a bimodal distribution. To determine the underlying basis for this distribution, we performed a cross-parameter analysis with applicant degree type. As illustrated in Figure 12A, physician doctorates and academic doctorates apply to LRP at different times following their degree. A majority of academic doctorates (67%) apply within three years of receiving their qualifying degree, while only 9% of physician doctorates and 8% of dual degree physician doctorates/academic doctorates apply in the same time period. Conversely, 53% of physician doctorates (and 34% of dual doctorates) apply between four to six years of receiving their qualifying degree, and only 21% of academic doctorates submit applications at this time of their career (Figure 12B). 0 200 400 600 800 1000 1200 1400 1600 <1 1 2 3 4 5 6 7 8 9 10 11 12 13 14 15 15+
N
u
m
b
e
r
o
f
N
e
w
L
R
P
A
p
p
lican
ts
an
d
A
w
ar
d
ee
s
Years Since Degree
Applicants Awardees
The peaks of applications and awards at 1 and 5 years following degree
conferralsuggest two distinct applicant groups.
Figure 12. Years since degree distribution of new LRP applicants, FY03-FY07. A (top), Distribution of different degree types. B (bottom), Proportion of degree types with respect to time interval categories. 0 200 400 600 800 1000 1200 1400 <1 1 2 3 4 5 6 7 8 9 10 11 12 13 14 15 15+
N
u
m
b
e
r
o
f
N
e
w
L
R
P
A
p
p
lica
n
ts
Years Since Degree
Physician Doctorate Professional Clinical Doctorate Academic Doctorate Physician Doctorate / Academic Doctorate 0% 10% 20% 30% 40% 50% 60% 70% 80% 90% 100% Physician Doctorate Professional Clinical Doctorate Academic Doctorate Physician Doctorate / Academic Doctorate Allied Health Professional Degree
Up to 3 Years 4 - 6 Years 7 - 9 Years 10+ Years
Most new LRP applications are filed within 3 years of
degree conferral by academic doctorates and within 4-6 years by physician
Based on this distribution, for cross-correlation analysis we defined four time intervals: (i) Up to 3 years; (ii) 4-6 years; (iii) 7-9 years; and (iv) 10+ years. Our analysis shows that a majority of new LRP applicants are in early stages of their career: 72% of applicants completed their qualifying degree within the six years prior to applying to the LRP, and 90% of new applicants completed their degree within nine years of applying to the program (Figure 13).
Figure 13. Interval distribution of years since degree of new LRP applicants, FY03-FY07.
1.3.6.2 Distribution of years since degree and gender
To determine if men and women applied to LRP at different times after completing their qualifying degree, we analyzed gender distribution in the four intervals defined above. More women (62%) apply for a new LRP award within three years of receiving their qualifying degree than men (35%) (Figure 14); this finding flows with the association between gender and degree. The proportion of new men and women applicants in other time intervals is relatively similar.
Figure 14. Gender by years since degree of new LRP applicants, FY03-FY07.
4-6 Years (37%) Up to 3 Years (35%) 7-9 Years (18%) 10+ Years (10%) 0 500 1000 1500 2000 2500 Up to 3 Years4-6 Years 7-9 Years 10+ Years
N
u
m
b
e
r
o
f
N
e
w
L
R
P
A
p
p
lica
n
ts
Years Since Degree
Male Female
More women than men apply to LRPs within 3 years of receiving their degree
1.3.7. New applications and awards, by prior research support
For the new applicant and awardee pools, we analyzed the distribution of prior research support from three sources: the NIH alone, both NIH and non-profit organizations, and non-profit organizations alone. While a near-equal proportion of new applicants had prior research support from each of these three sources, 15% more awardees had prior research support from the NIH alone than from non-profit organizations alone (39% vs. 24%) (Figure 15). This observation extends to each fiscal year in the reporting period; individuals with prior research support from the NIH alone had a greater success rate than individuals with prior research support from non-profit organizations alone (Figure 16).
Figure 15. Prior research support of new extramural LRP applicants and awardees, FY03-FY07. The overall success rate of each group is shown (encircled numbers).
Figure 16. Percent of new extramural LRP awardees FY03-FY07 by prior support source. 3560 (36%) 3135 (32%) 3125 (32%) 1791 (39%) 1665 (36%) 1109 (24%) 0 500 1000 1500 2000 2500 3000 3500 4000
NIH Only NIH and Non-Profit Non-Profit Only
N
u
m
b
e
r
o
f
N
e
w
L
R
P
A
p
p
lica
ti
o
n
s
an
d
A
w
ar
d
s
Applications Awards 0% 5% 10% 15% 20% 25% 30% 35% 40% 45%FY03
FY04
FY05
FY06
FY07
P
er
ce
n
t
o
f
N
ew
E
xtr
amur
al
LR
P
A
w
ar
d
s
NIH Only NIH and Non-Profit Non-Profit Only
Although a comparable number had prior research support from either the NIH
or non-profit organizations alone, new applicants with NIH funding were more likely
1.3.8. New applications and awards, by educational debt level
The goal of the loan repayment programs is to attract healthcare professionals into research careers by offering qualified researchers an opportunity to pay down educational debt. The programs make payments on all qualified educational debt, provided that the educational debt is at least 20% of the applicant’s annual base salary. New LRP applicants are required to report their current educational debt level as part of their application to the program. Prior to awards being made, the Division of Loan Repayment verifies the legitimacy of the loans and the current balances.
We compared reported debt for LRP applicants to that reported by NSF for the pool recent graduates. Among biological sciences academic doctorates, 50% reported no educational debt at the time of graduation. Of those with debt, 41% reported cumulative debt under $50,000. The average debt was about $20,000.23 Among medical school graduates, 17.2% reported no debt, 14.2% reported debt under $50,000, and 28.8% reported debt under $100,000. The average debt upon graduation was $97,000.24
1.3.8.1 Distribution of educational debt level
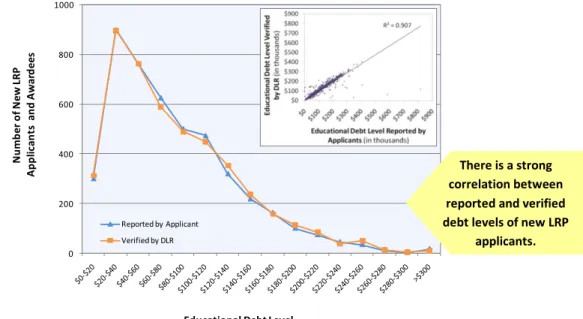
Debt levels of a majority of non-awardees are usually not verified.We determined the correlation between reported and verified debt levels by comparing these amounts for a subset of applicants for which both sets of amounts were known, namely, the 4,565 new LRP awardees. As shown in Figure 17, these amounts correlate strongly, with an R2 = 0.907 (inset, Figure 17). We therefore used applicant reported (but unverified) debt level for subsequent analysis.
Figure 17. Correlation between applicant reported and DLR verified educational debt level of new LRP applicants, FY03-FY07.
23
National Science Foundation (2008). Science and Engineering Indicators, Appx. Table 2-12. NSF: Arlington, VA. Note that educational debt for psychology PhDs, who make up over 40% of the LRP applicants, is higher. 70% of psychology PhDs graduate with some debt (vs. 50% for biology), and 29% have < $50K in debt (vs. 8% for biology). 24
Association of American Medical Colleges (2008). AAMC Data Book: Medical Schools and Teaching Hospitals by the Numbers, Table E4. AAMC: Washington, DC. We used student-reported responses from 2001.
0 200 400 600 800 1000 N u mb er o f N ew L RP A p p lic an ts a n d A w ar d ee s
Educational Debt Level (In thousands) Reported by Applicant
Verified by DLR
There is a strong correlation between reported and verified debt levels of new LRP
We next analyzed the distribution of educational debt level of all 9,820 new LRP applicants (Figure 18). Sixty three percent reported an educational debt level up to $100,000; 31% reported an educational debt level between $100,000 and $200,000, and 6% reported an educational debt level greater than $200,000.
Figure 18. Reported educational debt level of new extramural LRP applicants, FY03-FY07.
1.3.8.2 Distribution of educational debt level and degree type
The distribution of debt level between applicants with different degree types shows striking differences (Figure 19). The proportion of academic doctorates in a debt range decreases with greater educational debt, with a corresponding increase in the proportion of physician doctorates. Seventy-nine percent of applicants with an educational debt less than $20,000 have academic doctoral degrees, while only 13% have physician doctorates. Similarly, of applicants with between $20,000 and $40,000 of educational debt, 66% have academic doctorates compared to 24% with physician doctorates. At higher educational debt levels ($180,000-$200,000), the difference is reversed and is even more striking: 83% of applicants with high debt have a physician doctorate while only 9% have an academic doctorate. The average debt reported by academic doctorates was $62,165 and by physician doctorates was $114,042, both
substantially higher than the average debt of recent graduates (see above), an indicator that LRPs are attracting researchers with high debt.
0 200 400 600 800 1000 1200 1400 1600 1800
N
u
m
b
e
r
o
f
N
e
w
L
R
P
A
p
p
lica
n
ts
Educational Debt Level
(reported by applicants, in thousands)The majority of new LRP applicants reported
an educational debt of up to $100,000.
Figure 19. Distribution of reported educational debt level of new extramural LRP applicants with different degree types, FY03-FY07.
0 200 400 600 800 1000 1200
N
u
m
b
e
r
o
f
N
e
w
L
R
P
A
p
p
lica
n
ts
Educational Debt Level
(reported by applicants, in thousands)
Physician Doctorate Academic Doctorate Physician Doctorate / Academic Doctorate Professional Clinical Doctorate Allied Health Professional Average Debt for Academic Doctorates:$61,165 Physician Doctorate Academic Doctorate Physician Doctorate / Academic Doctorate Professional Clinical Doctorate Allied Health Professional Average Debt for Physician Doctorates: $114,042
The LRP attracts researchers with higher than average