Journal of Hospitality Financial Management
The Professional Refereed Journal of the Association of Hospitality Financial
Management Educators
Volume 25 | Issue 1 Article 2
7-13-2017
The Effects of Insider Ownership and Board
Composition on Firm Performance in the
Restaurant Industry
Jinyoung Im
aDivision of Engineering, Business, and Computing, Penn State Berks, Reading, PA
Yeasun Chung
School of Hotel and Restaurant Administration, Oklahoma State University, Stillwater, OK
Follow this and additional works at:https://scholarworks.umass.edu/jhfm
This Refereed Article is brought to you for free and open access by ScholarWorks@UMass Amherst. It has been accepted for inclusion in Journal of Hospitality Financial Management by an authorized editor of ScholarWorks@UMass Amherst. For more information, please contact
Recommended Citation
Im, Jinyoung and Chung, Yeasun (2017) "The Effects of Insider Ownership and Board Composition on Firm Performance in the Restaurant Industry,"Journal of Hospitality Financial Management: Vol. 25 : Iss. 1 , Article 2.
DOI: http://dx.doi.org/10.1080/10913211.2017.1313604 Available at:https://scholarworks.umass.edu/jhfm/vol25/iss1/2
Full Terms & Conditions of access and use can be found at
http://www.tandfonline.com/action/journalInformation?journalCode=uhfm20
Download by: [University of Massachusetts, Amherst] Date: 29 December 2017, At: 15:01
The Journal of Hospitality Financial Management
ISSN: 1091-3211 (Print) 2152-2790 (Online) Journal homepage: http://www.tandfonline.com/loi/uhfm20
The Effects of Insider Ownership and Board
Composition on Firm Performance in the
Restaurant Industry
Jinyoung Im & Yeasun Chung
To cite this article: Jinyoung Im & Yeasun Chung (2017) The Effects of Insider Ownership and Board Composition on Firm Performance in the Restaurant Industry, The Journal of Hospitality Financial Management, 25:1, 4-16, DOI: 10.1080/10913211.2017.1313604
To link to this article: https://doi.org/10.1080/10913211.2017.1313604
Published online: 13 Jul 2017.
Submit your article to this journal
Article views: 44
View related articles
The Effects of Insider Ownership and Board Composition on Firm Performance in
the Restaurant Industry
Jinyoung Imaand Yeasun Chungb
aDivision of Engineering, Business, and Computing, Penn State Berks, Reading, PA;bSchool of Hotel and Restaurant Administration,
Oklahoma State University, Stillwater, OK
ABSTRACT
This study aimed to investigate the relations among insider ownership, board composition, and firm performance in U.S. restaurant firms. The authors divided insider ownership into three categories: the equity ownership held per insider owners, the equity ownership held by non-executive (outside) directors, and the equity ownership shared by non-executive officers. Board composition was represented by board independence, board size, and chief executive officer duality. For data analysis, the authors conducted 319 observations from 31 firms. The authors found that 3 categories of insider ownership and board composition variables differently influence short-term operational profitability and long-term value. Managerial ownership negatively influ-ences short-term profitability, whereas long-term value is affected not only by managerial own-ership but also by a balanced dispersion of shares to each owner. Dual chief executive officers do not affect short-term profitability but negatively influence long-term value. The study findings provide more comprehensive understanding of the effect of the corporate governance system on firm performance in the restaurant industry.
Introduction
The effect of the corporate governance mechanism on a firm’s strategic choices and performance has been widely discussed in the mainstream of finance and strategic management literature since the 1970s (e.g., Jensen & Meckling,1976; Kesner & Dalton, 1985). However, the characteristics of the hospitality industry, such as higher levels of agency problems (Oak & Iyengar, 2009) and high sensi-tivity to changes in environments (Guillet & Mattila,2010), demand a more effective corporate governance system, leading to increased attention to corporate governance in the hospitality industry (e.g., Altin, Kizildag, & Ozdemir,2016; Chen, Hou, & Lee, 2012; Kwansa, Song, Sharma, & Gong, 2014). In particular, ownership structure is a core component of corporate governance mechanisms (Jensen & Meckling, 1976). Providing a firm’s stake to its executive officers and directors has been one of the solutions to mitigate a conflict of interest between ownership and management con-trol (Himmelberg, Hubbard, & Palia,1999).
Previous studies have discussed insider ownership in terms of shares held by directors and executive officers as a whole (Chen et al., 2012). Although treating insider ownership as a whole has provided insights by capturing the behavior of all decision makers (Oswald & Jahera, 1991), it is based on the assumption that all inside shareholders have com-mon interests and goals (Demsets & Villalogna, 2001). A board consists of directors from inside and outside the firm (Ellstrand, Tihanyi, & Johnson, 2002). Outside directors with equity ownership are more likely to be strict in monitoring top manage-ment (Beatty & Zajac,1994), whereas inside directors may conduct weaker monitoring functions and sup-port chief executive officers (CEOs) for the sake of their own career (Ellstrand et al.,2002). Therefore, it is critical to recognize that each stakeholder in a single broader category may have different interests and stakes (Gu & Kim,2001).
Board composition is a critical determinant of corporate governance effectiveness (Mizruchi, 1983). Previous studies often did not account for CONTACTYeasun Chung [email protected] School of Hotel and Restaurant Administration, Oklahoma State University, 365 Human Sciences, Stillwater, OK 74078, USA.
THE JOURNAL OF HOSPITALITY FINANCIAL MANAGEMENT 2017, VOL. 25, NO. 1, 4–16
http://dx.doi.org/10.1080/10913211.2017.1313604
© 2017 International Association of Hospitality Financial Management Education
interdependence of control mechanisms in the governance (Agrawal & Knoeber, 1996). While previous studies mostly addressed ownership structure (Chen et al., 2012; Gu & Kim, 2001; Gu & Qian,1999; Park & Jang, 2011), the effect of the board of directors started gaining attention of researchers in the hospitality industry (Moon & Sharma, 2014). However, examining the effect of the single control mechanism on a firm perfor-mance or strategic choice may lead to misunder-standing of the role of corporate governance (Agrawal & Knoeber, 1996). Only a couple of variables regarding board composition, such as board size, gender of board members (Yeh & Trejos, 2015), CEO duality (Guillet, Seo, Kucukusta, & Lee, 2013; Yeh, 2013), and board independence, (Ozdemir & Upneja, 2012) have been examined separately or along with ownership structure. Therefore, considering multiple control mechanisms simultaneously helps to provide a more comprehensive understanding of corporate governance.
This study investigated the relation between insider ownership, board composition, and firm performance with U.S. restaurant firms. In this study, insider ownership was investigated by dividing it into three categories: equity owner-ship held per insider owner, equity ownerowner-ship shared by nonexecutive (outside) directors, and equity ownership shared by executive officers. Board composition was represented by board independence, board size, and CEO duality. Firm performance was investigated with the return on asset (ROA) and Tobin’s Q as indica-tors of short-term profitability and long-term value, respectively.
Literature review
Insider ownership and firm performance
Ownership structure has two dimensions to con-sider: the degree of ownership concentration and the nature of the owners (Iannotta, Nocera, & Sironi, 2007). Firms may differ from each other depending not only on whether their ownership is more dispersed but also on whether one entity holds more significant shares than others do, given that the firms have the same degree of
equity ownership concentration (Iannotta et al., 2007). However, previous studies have over-looked the nature of owners among insiders given that they have investigated the effect of the degree of ownership concentration on perfor-mance by taking the percentage of shares held by directors and managers as a whole (Agrawal & Knoeber, 1996; Chen et al., 2012; Park & Jang, 2010).
There are two opposite arguments to view the effect of inside ownership and firm performance— the convergence-of-interest hypothesis and the entrenchment hypothesis (Jensen & Meckling, 1976). The former hypothesis posits that when executive officers have larger stock holdings, they tend to pursue the same goals with shareholders that ultimately lead to better firm performance (Gu & Kim, 2001). Alternatively, the entrenchment hypothesis argues that the higher level of insider ownership may hinder a firm’s better performance because it prevents inside shareholders from effec-tive control of management given that they use their voting right for their own interests (Morck, Shleifer, & Vishny,1988).
Previous studies have demonstrated inconclu-sive findings in the hospitality field. Some studies have found the positive effect of insider ownership concentration on firm performance (Gu & Kim, 2001), whereas others have found a curvilinear relationship (Chen et al., 2012; Park & Jang, 2010). The curvilinear relationship implies the coexistence of convergence-of-interest hypothesis and entrenchment hypothesis. Firm performance increases as the degree of insider ownership increases at a certain point, and after that, the firm performance decreases even though the degree of insider ownership increases. Furthermore, Chen and colleagues (2012) investi-gated insider ownership by dividing it into man-agers’ shareholding and director’s shareholding. They found that manager’s shareholdings had no significant effect on hotel firm performance, whereas insiders’(as a group) and directors’ share-holdings were significantly related to firm performance.
The effect of ownership structure on firm per-formance is often explained in relation to a firm’s risk-taking behavior (e.g., Bethel & Liebeskind, 1993; Wright, Ferris, Sarin, & Awasthi, 1996).
Shareholders prefer high-risk high-return strate-gies, such as innovation or research and develop-ment; however, those strategies are less attractive to managers who want to avoid consequences of failure (Hill & Snell, 1988). Managers are utility maximizers who tend to work on their own power, security, and personal wealth (Hill & Snell,1988). Similarly, inside directors are more likely to be in favor of less risk-taking strategies to secure their jobs, enhance their rewards, and support their CEOs because of close ties with the CEOs (Ellstrand et al., 2002).
Outside directors who hold the equity of a firm are expected to be more active in their monitoring roles, ultimately leading to better firm perfor-mance (Morck et al., 1988). Agency theory (Jensen & Meckling, 1976) and resource depen-dence theory (Pfeffer & Salancik, 1978) support the positive effect of outside directors on firm performance as a result of the effective control of management and diverse resources from an exter-nal environment brought in by outside directors (Peng,2004). Therefore, we established the follow-ing hypotheses:
Hypothesis 1a: A firm’s short-term profitability increases as the percentage of equity ownership held by each owner increases.
Hypothesis 1b: A firm’s long-term value increases as the percentage of equity ownership held by each owner increases.
Hypothesis 2a: A firm’s short-term profitability increases as the percentage of equity ownership held by outside directors increases.
Hypothesis 2b: A firm’s long-term value increases as the percentage of equity ownership held by outside directors increases.
Hypothesis 3a: A firm’s short-term profitability decreases as the percentage of equity ownership held by executive officers increases.
Hypothesis 3b: A firm’s long-term value decreases as the percentage of equity ownership held by execu-tive officers increases.
Board composition and firm performance
A firm can enhance its efficiency in monitoring top management by designing the board composition
(Beatty & Zajac, 1994). The effects of a board of directors on performance are supported by agency theory (Jensen & Meckling, 1976) and resource dependence theory (Pfeffer & Salancik, 1978). The agency theory emphasizes the responsibilities of the board of directors in monitoring management. An increased effectiveness in the monitoring of manage-ment leads to reduced agency cost, which ultimately results in better firm performance (Hillman & Dalziel, 2003). In addition, the resource dependence theory focuses on resources that a board brings to a firm. A board of directors plays a significant role in resource provision, including their own experience, expertise, and reputation, and in networks with other firms (Hillman & Dalziel, 2003).
Previous studies discussed the characteristics of board composition including age, directorship, and board independence (Ozdemire & Upneja, 2012); gender and board size (Yeh & Trejos, 2015); and CEO duality (Yermack, 1996, Guillet et al., 2013). The present study investigated the effects of board characteristics on firm perfor-mance by using board size, board independence, and CEO duality.
Board size
Board size is the number of directors on the board (Yeh & Trejos, 2015). The board size significantly affects a board’s decision-making capabilities and efficiency. The resource dependency theory (Pfeffer & Salancik, 1978) argues that a larger board pro-vides more links to the external environment, brings more resources in dealing with the dynamic environment, and results in the better performance of a firm. In addition, a larger board can facilitate the full range of board roles including inside direc-tors, affiliated direcdirec-tors, and outside directors (Dalton, Johnson, & Ellstrand, 1999).
In contrast, some studies show that a larger board may hinder the effectiveness of executing its duty in monitoring and controlling the CEO and executive officers (Dalton et al.,1999) because of the difficulties in coordinating different opi-nions (Cahan, Chua, & Nyamori, 2005; Lipton & Lorsch,1992). A few researchers have suggested an optimal number of board size. Lipton and Lorsch (1992) recommended having fewer than 10, whereas Jensen (1993) proposed that fewer than 7 or 8 works best.
6 J. IM AND Y. CHUNG
Previous studies found the negative association between board size and firm performance (Eisenberg, Sundgren, & Wells, 1998; Yermack, 1996). Yermack (1996) found that board size is negatively associated with market evaluation, return on assets (ROA), and return on sales (ROS). Yeh and Trejos (2013) also found the negative influence of board size on the firm performance in the tour-ism context. The authors provided an alternative explanation on the basis of the social loafing theory. The theory posits that a smaller board enhances a firm’s performance because it increases efficiency in timely decision making and communication among board members.
Board independence
The proportion of outside directors on the board is a critical issue in board composition (Barnhart & Rosenstein,1998). A large number of outside direc-tors enables the board to be more independent and provide a higher level of corporate governance to shareholders by integrating and coordinating the internal and external interests of various share-holders (Ellstrand et al.,2002; Johnson, Hoskisson, & Hitt, 1993). As suggested in the resource depen-dency theory, diverse backgrounds of board mem-bers bring better resources and knowledge in interacting with an external environment to a firm (Pfeffer & Salancik, 1978). In contrast, there is criticism about the role of outside directors. Outside directors may not be valuable in decision making that generally requires an in-depth under-standing of a firm given that they may lack time, access to information, and company-specific knowl-edge beyond financial performance (Baysinger & Hoskisson, 1990; Hart, 1995). However, previous studies have supported the positive effect of board independence on firm performance and a firm’s restructuring decision (Johnson et al., 1993; Luan & Tang,2007; Yeh,2013).
CEO duality
CEO duality is another important component of the corporate governance mechanism as a board leadership structure (Baliga, Moyer, & Rao, 1996; Elsayed, 2007). It indicates that a CEO plays the role of the chairman of the board (Rechner & Dalton, 1991). Agency theory, stewardship theory, and resource dependence theory provide conflicting
views on the relation between CEO duality and firm performance (Elsayed, 2007; Guillet et al., 2013; Krause, Semadeni, & Cannella, 2014). Agency the-ory posits that a nondual CEO can enhance the monitoring effectiveness of the board of directors by separating the power between the CEO and the chairman of the board (Elsayed, 2007). Along with agency theory, resource dependence theory also emphasizes the advantages of different resources brought by the chairman of the board from the outside (Boyd, 1995)
In contrast, stewardship theory argues that a CEO tends to pursue the same goal the share-holders have by being “a good steward” of a firm (Donaldson & Davis,1991, p. 51). Dual CEOs can provide the unitary and effective leadership of the company, build credibility in management, mitigate the asymmetry of information between top man-agers and the board of directors, and reduce the costs of firms including agency cost and informa-tion cost (Baliga et al.,1996; Finkelstein & D’Aveni, 1994). A nondual CEO may generate the rivalry between the chairman of the board and the CEO given that having two spokesmen may cause con-fusion in communication with various stakeholders from outside the firm and hinder a firm’s innova-tion or new strategy initiated by the CEO if the board does not trust the CEO (Baliga et al., 1996).
Previous studies have shown inconsistent results regarding the influence of the dual CEOs on firm performance. Some studies have found positive effect of dual CEOs on performance (Rechner & Dalton, 1991), whereas others have found a non-significant relation (Baliga et al., 1996). Elsayed (2007) emphasized that the effect of dual CEOs on firm performance varies across the industry context and in corporate performance itself.
In the hospitality industry, the positive effect of dual CEOs on firm performance was observed in previous studies (Guillet et al.,2013; Yeh,2013). In Guillet and colleagues’ (2013) study, dual CEOs have a positive effect on a firm’s performance, which was measured by ROA and Tobin’s Q. The authors discussed that the role of dual CEOs is more significant in the restaurant industry where management teams face a high degree of short-term decisions suggested by Reich (1993). On the basis of the aforementioned discussion, the follow-ing hypotheses were established.
Hypothesis 4a: The smaller the board, the better a firm performs in short-term profitability.
Hypothesis 4b: The smaller the board, the better a firm performs in long-term value.
Hypothesis 5a: The higher degree of board indepen-dence, the better a firm performs in short-term profitability.
Hypothesis 5b: The higher degree of board indepen-dence, the better a firm performs in long-term value. Hypothesis 6a: Having dual CEOs has a positive effect on short-term profitability.
Hypothesis 6b: Having dual CEOs has a positive effect on long-term value.
Method
Data
To test the proposed hypotheses, we chose the U.S. restaurant industry. The restaurant industry is appropriate to test the role of corporate governance on firm performance because of its high ratio of short-term decision to long-term decision (Reich, 1994) and sensitivity to economic conditions (Guillet et al., 2013) that requires to having an effective corporate governance system in decision making to respond to challenges in the market.
Thus, this study selected publicly traded restau-rant firms in the United States as a sample. We identified the lists of firms using the standard indus-trial classification (SIC) code (“eating places”= 5812) and the North American industry classification sys-tem code (NAICS,“full service”= 722110; “limited service”= 722211). We retrieved the data related to insider ownership and board characteristics from the forms of definitive proxy statement (DEA 14F), and we collected financial data from a firm’s annual reports (10-K) for the period of 1998–2013. We chose the 1998–2013 period for this study for two reasons. First, there are few available observations to validate the results of regression analysis because of the insufficient number of publicly traded restaurant firms. Second, some of the restaurants’ ownership related data were not available before 1998. Therefore, this study collected data for the time period of 1998–2013.
We obtained monthly stock prices ined from Yahoo Finance. We calculated annual stock prices
using a mean of monthly prices for each year. After we eliminated missing values related to stock prices and 17 outliers, we had 319 observa-tions from 31 firms for final data analysis includ-ing 202 observations from 20 full-service restaurant firms and 117 observations from 11 limited-service restaurant firms.
Measurement
Dependent variables
We used two dependent variables to measure a firm’s performance: ROA and Tobin’s Q. We used ROA as an indicator for a firm’s short-term opera-tional profitability, indicating a firm’s efficiency in generating profits with its asset during a specific year (Kang, Lee, & Huh, 2010). Therefore, we cal-culated it by dividing the net income by the asset (Chen et al., 2012). We used Tobin’s Q for an indicator of long-term value potential because it reflects the expected future value (Guillet et al., 2013; Lee & Park,2009). We estimated the approxi-mated Q as the sum of market value of common equity, market value of preferred stock, and book value of the total liabilities divided by the book value of total asset (Park & Jang, 2010).
Independent variables
In this study, we used six independent variables, three of which are related to insider ownership: the percentage of insider ownership held per owner (IPO), the percentage of insider ownership held by nonexecutive directors (PO), and the percentage of insider ownership held by executive officers (PE). We calculated IPO by dividing the percentage of insider ownership by the number of insiders in a group (Warfield, Wild, & Wild, 1995). We esti-mated PO as the percentage of equity sharehold-ings held by nonexecutive directors (Agrawal & Knoeber, 1996). Last, we assessed PE with the percentage of equity shareholdings held by execu-tive officers (Mehran,1995).
The other three of the six independent variables involved board characteristics: board size (BS), board independence (BI), and CEO duality (CEO DUAL). We measured BS as the number of board members (Yermack,1996). We estimated BI as the percentage of nonexecutive directors among the entire number of board numbers (Ozdemir & 8 J. IM AND Y. CHUNG
Upneja, 2012). Last, we used a binary variable for CEO DUAL: dual CEO = 1 and nondual CEO = 0 (Rechner & Dalton, 1991).
Along with the independent variables, the study also used three control variables: leverage (LEV), firm size (FS), and market condition (MC). We calculated LEV by dividing liabilities by asset (Guillet & Mattila,2010). We estimated FS by the total asset of a firm (Tsai & Gu, 2007). Last, we entered MC into the regression model to control for general market condition for a specific year (Kang et al., 2010). We calculated it by market return minus risk free rate. We used S&P 500 stock prices to calculate the market return and 10-year treasury rate q was used for the risk-free rate (Kang et al., 2010). For all variables, we applied a fixed-effect transformation to eliminate a firm-constant unobserved effect.
Model
We conducted firm-fixed, panel-data, and hierarch-ical regression analysis to examine the hypotheses. The regression models were established as follows.
ROAt¼αþFSβ1tþLEVβ2tþMCβ3t
þIPOβ4tþPOβ5tþPEβ6t
þBSβ7tþBIβ8tþCEO DUALβ9t
Tobin0s Qt ¼αþFSβ1tþLEVβ2tþMCβ3t þIPOβ4tþPOβ5tþPEβ6t
þBSβ7tþBIβ8tþCEO DUALβ9t
whereROA= return on asset,Tobin’s Q= approx-imation of Tobin’s Q,IPO= percentage of insider equity ownership shared by entire insider group per owner, PO = percentage of equity ownership
shared by nonexecutive directors,PE= percentage of equity ownership shared by executive officers,
BS = board size, BI = board independence, CEO DUAL = CEO duality, FS = firm size, LEV = leverage, and MC = market condition.
Results
Descriptive statistics
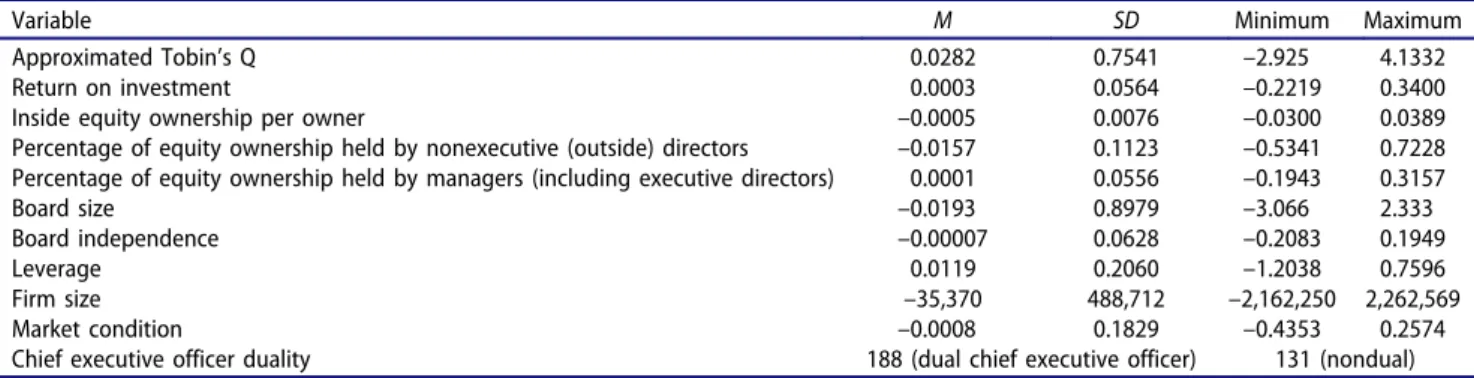
Table 1 summarizes the descriptive statistics of the sampled restaurant firms. We performed descriptive statistics with the values, which has the fix-effect reflected. The mean Q was 0.0282, with a range from–2.925 to 4.1332. The mean ROA was 0.0003, with a range from–0.221 to 0.340. The mean IPO was
–0.0005, with a range from–0.030 to 0.038. The mean PO was–0.0157, with a range from–0.5341 to 0.7228. The mean PE was 0.0001, with a range from–1.943 to 3.157. The mean BS was–0.0193, with a range from– 3.066 to 2.333. The maximum and minimum of BI were–0.2083 and 0.1949, respectively. For the results of frequency analysis with CEO DUAL, 188 firms had dual CEOs, whereas 131 firms did not. The control variable LEV’s mean was 0.0119, with a range from– 1.203 to 0.759. The mean FS was –35,370, with a range from –2,162,250 to 2,262,569. The mean MC was–0.0008, with a range from–0.4353 and 0.2574.
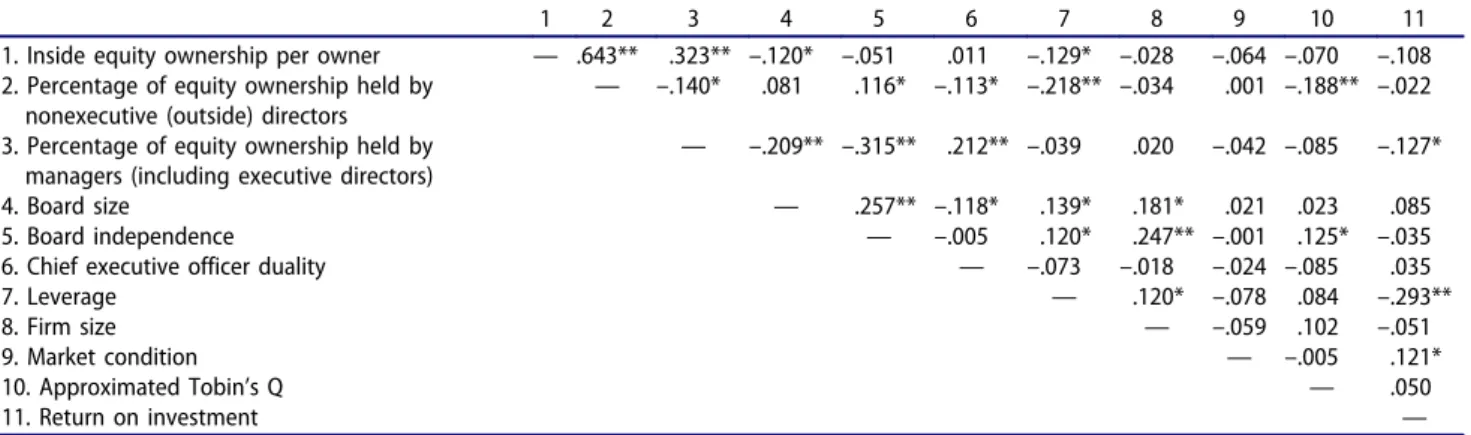
As Table 2 shows, PO showed significant but negative correlation with Q (r=–.188) whereas BI positively correlated with Q (r= .125). In addition, PE negatively correlated with ROA (r=–.127). For control variables, LEV (r = –.293) had a negative correlation with ROA, whereas MC (r = .121) had a positive correlation with ROA. However, none of the control variables was significantly correlated with Q. Multicollinearity was checked with the
Table 1.Summary of Descriptive Statistics (N= 319).
Variable M SD Minimum Maximum
Approximated Tobin’s Q 0.0282 0.7541 –2.925 4.1332
Return on investment 0.0003 0.0564 –0.2219 0.3400
Inside equity ownership per owner –0.0005 0.0076 –0.0300 0.0389 Percentage of equity ownership held by nonexecutive (outside) directors –0.0157 0.1123 –0.5341 0.7228 Percentage of equity ownership held by managers (including executive directors) 0.0001 0.0556 –0.1943 0.3157
Board size –0.0193 0.8979 –3.066 2.333
Board independence –0.00007 0.0628 –0.2083 0.1949
Leverage 0.0119 0.2060 –1.2038 0.7596
Firm size –35,370 488,712 –2,162,250 2,262,569
Market condition –0.0008 0.1829 –0.4353 0.2574
Chief executive officer duality 188 (dual chief executive officer) 131 (nondual)
values of variance inflation factor, and tolerance and was not an issue in the data because the values of the variance inflation factor and tolerance were less than 5 and greater than 0.10, respectively.
Main analysis
To test the first model, we conducted a three-stage hierarchical regression analysis with ROA as a dependent variable (see Table 3). In Step 1 of the model, we entered all three control variables. The model was statistically significant, F(3, 315) = 11.125, p < .001, and explained 8.7% of variance in ROA (adjustedR2= .087). LEV (t=–5.258,p <
.001, β = –.284) and MC (t = 1.819, p < .1, β = .098) were significant predictors of ROA, whereas FS (t = –0.202,p = .840, β = –.011) was not.
In Step 2, we added three independent vari-ables related to insider ownership. The model revealed statistically significant, F(6, 312) = 7.542, p < .001, and resulted in an increase of 3.1% in explained variance (ΔR2= 0.031). LEV (t
=–6.699,p< .01,β=–.313) and PE (t=–1.997,p
< .05, β = –.128) were significantly related to ROA, whereas MC (t = 1.628, p = .104, β = .087), firm size (t = –0.178, p = .858, β =
–.010), IPO (t = –.663, p = .508, β = –.055), and PO (t = –0.905, p = .366, β= –.073) were not.
Table 2.Summary of Pearson’s Correlations (N= 319).
1 2 3 4 5 6 7 8 9 10 11
1. Inside equity ownership per owner — .643** .323** –.120* –.051 .011 –.129* –.028 –.064 –.070 –.108 2. Percentage of equity ownership held by
nonexecutive (outside) directors
— –.140* .081 .116* –.113* –.218** –.034 .001 –.188** –.022 3. Percentage of equity ownership held by
managers (including executive directors)
— –.209** –.315** .212** –.039 .020 –.042 –.085 –.127*
4. Board size — .257** –.118* .139* .181* .021 .023 .085
5. Board independence — –.005 .120* .247** –.001 .125* –.035 6. Chief executive officer duality — –.073 –.018 –.024 –.085 .035
7. Leverage — .120* –.078 .084 –.293**
8. Firm size — –.059 .102 –.051
9. Market condition — –.005 .121*
10. Approximated Tobin’s Q — .050
11. Return on investment —
Table 3.Results of the Hierarchical Regression, With Return on Investment as the Dependent Variable (N= 319).
B SEB β t F AdjustedR2 ΔR2 Model 1 Constant 0.001 0.003 0.397 11.125*** .087 — LEV –0.082 0.016 –.284 –5.258*** FS 0 0.000 –.011 –0.202 MC 0.032 0.018 .098 1.819* Model 2 Constant 0.001 0.003 0.177 7.542*** .110 .031** LEV –0.091 0.016 –.313 –5.699*** FS 0 0.000 –.010 –0.178 MC 0.028 0.017 .087 1.628 IPO –0.426 0.643 –.055 –0.663 PO –0.039 0.043 –.073 –0.095 PE –0.137 0.069 –.128 –1.997** Model 3 Constant –0.003 0.005 –0.555 5.720*** .118 .016 LEV –0.093 0.016 –.321 –5.755*** FS 0 0.000 –.015 –0.276 MC 0.028 0.017 .086 1.611 IPO –0.211 0.647 –.027 –0.327 PO –0.049 0.043 –.092 –1.132 PE –0.153 0.072 –.143 –2.121** BS 0.008 0.004 .126 2.219** BI –0.057 0.056 –.060 –1.016 CEO 0.006 0.007 .048 0.882
Note. BS = board size, BI = board independence, CEO = CEO duality, FS = firm size, IPO = insider equity ownership per owner, LEV = leverage, MC = market condition, PE = percentage of equity ownership held by managers (including executive directors), PO = percentage of equity ownership held by nonexecutive (outside) directors, and Q = approximated Tobin’s Q.
*p< 0.1. **p< .05. ***p< .01. 10 J. IM AND Y. CHUNG
Last, we entered in the model the rest of the independent variables related to board structure. The final model was statistically significant, F(9, 309) = 5.720, p < .001. However, there was no significant change in the explained of variance (ΔR2 = 0.016, p = .123). LEV (t = –.5.755, p < .001, β = –.321), and PE (t = –2.121, p < .05, β = –.143) were negatively related to ROA, whereas BS (t = 2.219, p < .05, β = .126) had a positive relation to ROA. However, the rest of the variables, including MC (t = 1.611, p = .108,
β = .086), FS (t = –0.276, p = .783, β = –.015), IPO (t = –0.327, p = .744, β = –.027), PO (t = – 1.132, p = .259, β = –.092), BI (t = –1.016, p = .310, β= –.060), and CEO DUAL (t = 0.882, p = .378, β = .048), were not statistically significant in the model.
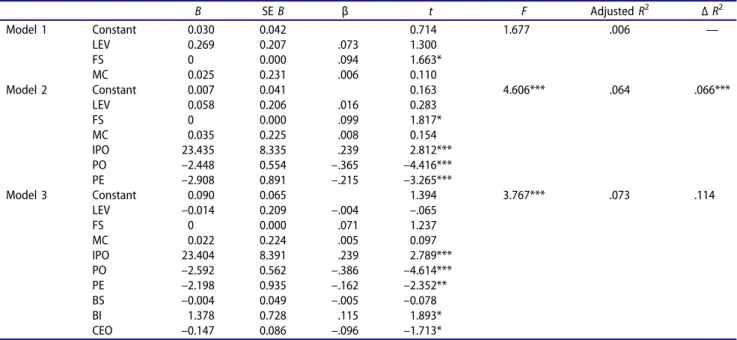
Next, we conducted another three-stage hierarch-ical regression analysis with Tobin’s Q as a depen-dent variable (seeTable 4). We entered in the model control variables and independent variables related to insider ownership and board composition, follow-ing the same sequence of the first model. In Step 1, the model was statistically nonsignificant,F(3, 315) = 1.677,p = .172. However, the model explained only 0.6% of variance in Tobin’s Q (adjustedR2= .006). None of the control variables was significantly
related to Tobin’s Q: FS (t = 1.663, p = .097, β = .094), LEV (t= 1.300,p= .194,β= .073), and MC (t= 0.110,p= .913,β= .006).
In Step 2, after adding three independent variables related to insider ownership, the model became sta-tistically significant, F(6, 312) = 4.606, p < .001. There was a significant change in explained variance, which is 6.6% (ΔR2= .066). FS (t= 1.817,p< .1,β= .099) and IPO (t = 2.812, p < .01, β = .239) were positively related to Tobin’s Q, whereas PO (t = – 4.416,p< .001,β=–.365) and PE (t=–3.265,p< .01,
β=–.215) were negatively related. LEV (t= 0.283,p
= .777,β= .016) and MC (t = 0.154,p = .877,β= .008) were not statistically significant.
In Step 3, the model remained statistically signifi-cant, F(9, 309) = 3.767, p < .001. However, there was no significant change in explained variance (ΔR2 = .017). In the final model, IPO, PO, PE, BI, and CEO DUAL were found to be significant predic-tors of Tobin’s Q. To be specific, IPO (t= 2.789,p< .01, β = .239) was positively related to Tobin’s Q, whereas PO (t=–4.614,p< .001,β=–.386) and PE (t = –2.352, p < .05, β = –.162) were negatively correlated with Tobin’s Q. In addition, BI (t= 1.893,
p < .1,β= .115) was positively related to Tobin’s Q, whereas CEO DUAL (t =–1.713,p < .1, β= –.096) was negatively correlated. However, FS (t= 1.237,p=
Table 4.Results of the Hierarchical Regression, With Tobin’s Q as the Dependent Variable (N= 319).
B SEB β t F AdjustedR2 ΔR2 Model 1 Constant 0.030 0.042 0.714 1.677 .006 — LEV 0.269 0.207 .073 1.300 FS 0 0.000 .094 1.663* MC 0.025 0.231 .006 0.110 Model 2 Constant 0.007 0.041 0.163 4.606*** .064 .066*** LEV 0.058 0.206 .016 0.283 FS 0 0.000 .099 1.817* MC 0.035 0.225 .008 0.154 IPO 23.435 8.335 .239 2.812*** PO –2.448 0.554 –.365 –4.416*** PE –2.908 0.891 –.215 –3.265*** Model 3 Constant 0.090 0.065 1.394 3.767*** .073 .114 LEV –0.014 0.209 –.004 –.065 FS 0 0.000 .071 1.237 MC 0.022 0.224 .005 0.097 IPO 23.404 8.391 .239 2.789*** PO –2.592 0.562 –.386 –4.614*** PE –2.198 0.935 –.162 –2.352** BS –0.004 0.049 –.005 –0.078 BI 1.378 0.728 .115 1.893* CEO –0.147 0.086 –.096 –1.713*
Note. BS = board size, BI = board independence, CEO = CEO duality, FS = firm size, IPO = insider equity ownership per owner, LEV = leverage, MC = market condition, PE = percentage of equity ownership held by managers (including executive directors), PO = percentage of equity ownership held by nonexecutive (outside) directors, and Q = approximated Tobin’s Q.
*p< 0.1. **p< .05. ***p< .01.
.217,β= .071), LEV (t=–.065,p= .948,β=–.004), MC (t= .097,p= .923,β= .005), and BS (t=–.078,p= .938,β=–.005) had no statistically significant relation with Tobin’s Q.
Ancillary analyses
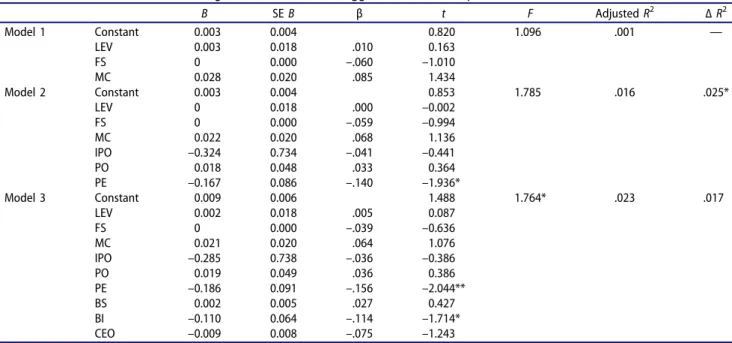
We conducted additional analyses with 1-year lagged performance measures because of the endo-genous relation between corporate governance variables and performance (Park & Jang, 2010; Yeh, 2013) and because the effect of decisions made by current board of directors may later be reflected in the firm performance. We established the regression models as follows, and we con-ducted three-stage hierarchical regressions follow-ing the same sequence of enterfollow-ing variables with the previous analysis in the study.
ROAt ¼αþFSβ1t1þLEVβ2t1þMCβ3t1
þIPOβ4t1þPOβ5t1þPEβ6t1
þBSβ7t1þBIβ8t1þCEO DUALβ9t1
Tobin0s Qt¼ αþFSβ1t1þLEVβ2t1
þMCβ3t1þIPOβ4t1þPOβ5t1
þPEβ6t1þBSβ7t1þBIβ8t1
þCEO DUALβ9t1
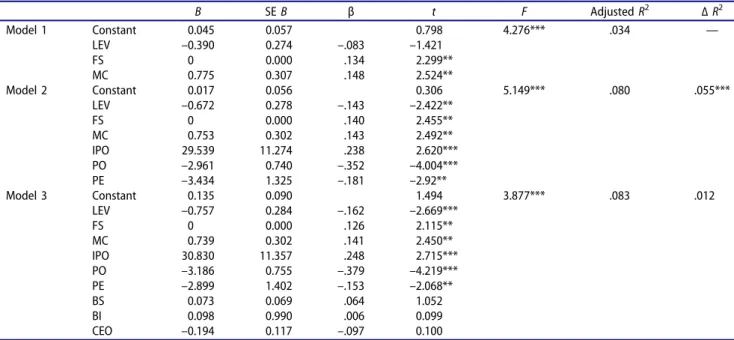
The results of the analysis indicated the same directions of the relation between ownership struc-ture related variables and performance measures as shown in Tables 5and 6.
Discussion
We aimed to assess the effect of insider ownership and board composition on firm performance in the restaurant industry. We classified insider own-ership into three categories (inside equity owner-ship per owner, inside equity ownerowner-ship held by outside directors, and that held by executive offi-cers) to better understand the different stakes and interests of each stakeholder in the same category. In addition, we addressed the interdependence of the corporate governance mechanism by incorpor-ating board composition variables. We considered firm performance in terms of short-term profit-ability and long-term value.
We found that the effect of the corporate gov-ernance system on firm performance varied upon the performance measures. The results indicated that an increase in managerial ownership lowers short-term profitability, which is inconsistent with the findings of Chen and colleagues’(2012) study. The negative effect can be supported by the
Table 5.Results of the Hierarchical Regression, With 1-Year Lagged ROA as the Dependent Variable (N= 288).
B SEB β t F AdjustedR2 ΔR2 Model 1 Constant 0.003 0.004 0.820 1.096 .001 — LEV 0.003 0.018 .010 0.163 FS 0 0.000 –.060 –1.010 MC 0.028 0.020 .085 1.434 Model 2 Constant 0.003 0.004 0.853 1.785 .016 .025* LEV 0 0.018 .000 –0.002 FS 0 0.000 –.059 –0.994 MC 0.022 0.020 .068 1.136 IPO –0.324 0.734 –.041 –0.441 PO 0.018 0.048 .033 0.364 PE –0.167 0.086 –.140 –1.936* Model 3 Constant 0.009 0.006 1.488 1.764* .023 .017 LEV 0.002 0.018 .005 0.087 FS 0 0.000 –.039 –0.636 MC 0.021 0.020 .064 1.076 IPO –0.285 0.738 –.036 –0.386 PO 0.019 0.049 .036 0.386 PE –0.186 0.091 –.156 –2.044** BS 0.002 0.005 .027 0.427 BI –0.110 0.064 –.114 –1.714* CEO –0.009 0.008 –.075 –1.243
Note. BS = board size, BI = board independence, CEO = CEO duality, FS = firm size, IPO = insider equity ownership per owner, LEV = leverage, MC = market condition, PE = percentage of equity ownership held by managers (including executive directors), PO = percentage of equity ownership held by nonexecutive (outside) directors, and Q = approximated Tobin’s Q.
*p< 0.1. **p< .05. ***p< .01. 12 J. IM AND Y. CHUNG
entrenchment hypothesis (Jensen & Meckling, 1976), which proposes that a higher degree of shareholdings held by executive officers hinders effective external control on top management. The negative effect of managerial ownership seems to outweigh its positive effect in restaurant firms.
The results showed that a larger board positively affects a firm’s short-term profitability. This is opposed to the results of previous studies, which show that a firm with a smaller board performs better by increasing the efficiency in the commu-nication and decision-making process, as sug-gested by the social loafing theory (e.g., Yeh & Trejos,2015). The positive effect of board size on profitability is supported by the resource depen-dence theory, indicating that a larger board is capable of bringing in more resources—such as experience, expertise, and networks—to a firm. This makes sense in the restaurant industry in particular, where firms are very vulnerable to changes in environments and make decisions that are oriented toward the short term (Reich,1993).
However, IPO, PO, BI, and CEO DUAL do not have statistically significant relations with ROA. IPO and PO may not be large enough to capture the effect on a firm’s short-term profitability in the
restaurant industry. Among restaurant firms whose market shares account for 80% of the entire market in terms of market capitalization, the aver-age percentaver-age of inside equity ownership as a whole is less than 10%, which also indicates that the average percentage of inside equity ownership per owner ranges between 0.1% and 1%. Moreover, the average percentage of outside direc-tors’ shareholding ranges between 0.2% and 15%. These percentages may indicate that a firm’s deci-sion making is largely affected by institutional ownership and other individual block holders. Therefore, the findings imply that giving stock options solely may not work well as a solution to reduce agency cost in the restaurant industry. Board independence and CEO duality have both benefits and challenges in the corporate govern-ance mechanism, and the benefits could be offset by challenges. For example, an independent board with many outside directors provides more objec-tive views on a company’s operational directions, but the views may be ineffective because of a lack of understanding of business information within a short time.
Unlike short-term operational profitability, the long-term value measured by Tobin’s Q was sig-nificantly changed by the ownership per inside
Table 6.Results of the Hierarchical Regression, With 1-Year Lagged Tobin’s Q as the Dependent Variable (N= 288).
B SEB β t F AdjustedR2 ΔR2 Model 1 Constant 0.045 0.057 0.798 4.276*** .034 — LEV –0.390 0.274 –.083 –1.421 FS 0 0.000 .134 2.299** MC 0.775 0.307 .148 2.524** Model 2 Constant 0.017 0.056 0.306 5.149*** .080 .055*** LEV –0.672 0.278 –.143 –2.422** FS 0 0.000 .140 2.455** MC 0.753 0.302 .143 2.492** IPO 29.539 11.274 .238 2.620*** PO –2.961 0.740 –.352 –4.004*** PE –3.434 1.325 –.181 –2.92** Model 3 Constant 0.135 0.090 1.494 3.877*** .083 .012 LEV –0.757 0.284 –.162 –2.669*** FS 0 0.000 .126 2.115** MC 0.739 0.302 .141 2.450** IPO 30.830 11.357 .248 2.715*** PO –3.186 0.755 –.379 –4.219*** PE –2.899 1.402 –.153 –2.068** BS 0.073 0.069 .064 1.052 BI 0.098 0.990 .006 0.099 CEO –0.194 0.117 –.097 0.100
Note. BS = board size, BI = board independence, CEO = CEO duality, FS = firm size, IPO = insider equity ownership per owner, LEV = leverage, MC = market condition, PE = percentage of equity ownership held by managers (including executive directors), PO = percentage of equity ownership held by nonexecutive (outside) directors, and Q = approximated Tobin’s Q.
*p< 0.1. **p< .05. ***p< .01.
owner, nonexecutive ownership, managerial own-ership, board independence, and CEO duality. The positive relation between IPO and Tobin’s Q implies that not only is a higher level of insider equity ownership critical, but so is the balanced dispersion of shares to each owner to effectively cause managers and directors to have common goals and interests with shareholders.
Unlike the nonsignificant relation of BI and CEO DUAL with short-term profitability, BI had a posi-tive relation with the long-term value measure. The result is consistent with that of previous studies (e.g., Luan & Tang,2007; Yeh,2013). This indicates that outside directors play a significant role in monitoring and controlling the top management in the restaurant industry for long-term perfor-mance as the agency theory claims (Jensen & Meckling,1976). However, CEO duality has a nega-tive relation with Q, implying that the costly man-ifestations of agency problems cannot be mitigated enough by CEO duality. This is inconsistent with the results of previous studies (Guillet et al.,2013). Giving unitary strong leadership to the CEO may not work well in the restaurant industry because of the significant agency problem (Oak & Ivengar, 2009) that hinders coalignment of the top manage-ment’s interests with that of shareholders. In addi-tion, board size has no significant effect on Q, and the result is different from those of previous studies (Yeh & Trejos, 2015). In addition, BS was not significantly related to Q, as it was with ROA.
The results of ancillary analyses with one-year lagged firm performance revealed the same direction of each variable toward ROA and Tobin’s Q with the results of cross-sectional data although the signifi-cance levels became different. These results provide a strong support for the findings of the main analyses by securing the issues from the endogenous problems and reflecting the time effect of decisions made by shareholders and board of directors.
We have provided a more comprehensive under-standing of the effect of the corporate governance system on firm performance by embracing the nat-ure of interdependence of two major corporate gov-ernance mechanisms. In particular, we found the significance of breadth of distribution of equity ownership to investigate the inside ownership con-centration. We used inside equity ownership held by per owner as a measure of inside ownership, and the
results revealed that IPO has no significant relation with ROA but is positively related to Tobin’s Q. The results also indicate that equally highly dispersed equity will motivate owners to pursue their goal matched with shareholder’s wealth.
In addition, the different relations of each board composition variable with each performance measure imply a unique role of board composition variables upon different performance measures. A larger board works in short-term profitability, whereas board independence and dual CEOs work in long-term value. On the basis of the results, restaurant firms may evaluate the effectiveness of their corporate gov-ernance mechanisms with performance with different measures. The results of the study indicate that res-taurant firms need to consider redesigning a com-pensation program to improve an effective corporate system, given that we found that several important features of the system were not related to firm per-formance, as suggested by major theories discussed in the study. In contrast, this may indicate the demand for further studies related to institutional ownership that accounts for the large portion of equity owner-ship of restaurant firms.
This study is not free of limitations, and future research can be carried out beyond those limitations. The findings should be generalized with caution given that in this study we used publicly traded res-taurant firms in the United States. In addition, we classified insider ownership into two categories in terms of the nature of owners: outside directors and executive officers. This classification may overlook potential conflicts of interest for affiliated directors who are not full-time but have some personal or business relationships with a firm (Peng, 2004). Researchers can consider different classifications and examine other types of ownership including individual block holders for future research. Moreover, there are other possible influencing factors (e.g., industry and firm characteristics) on the relation between corporate governance and firm perfor-mance. For example, the restaurant type (e.g., quick service and full service) may be an influence because of the differences in terms of operational complexity and labor intensity (Guillet et al.,2013). A full-service restaurant tends to involve a more complex operation and more intensive labor than does a quick-service restaurant does because a full-service restaurant focuses more on differentiation than on 14 J. IM AND Y. CHUNG
standardization, whereas a quick service restaurant standardizes and simplifies each stage of production for efficiency (Harrington,2001; Tse & Olsen,1988). The restaurant industry heavily relies on franchising that could help reduce monitoring costs and share business risks. In the franchising system, changes in product line, materials, or services require collabora-tion between a franchisor and franchisees. Moreover, a strategic plan asking franchisees to invest in would meet strong resistance from franchisees. As the suc-cess of implementing a strategy formulated by insi-ders (i.e., franchisor) often depends on the relation between franchisor and franchisees. Thus, the pro-portion of franchised establishments would help bet-ter understand the corporate governance–firm performance relation. Last, using different perfor-mance measures such as cash flow would be mean-ingful for future studies to provide a more comprehensive understanding of the effect of corpo-rate mechanism on firm performance.
Notes on contributors
Dr. Jinyoung Im is an assistant professor in the Division of Engineering, Business, and Computing at Penn State Berks. Dr. Yeasun Chung is an assistant professor in the School of Hotel and Restaurant Administration at Oklahoma State University.
References
Agrawal, A., & Knoeber, C. R. (1996). Firm performance and mechanisms to control agency problems between
man-agers and shareholders. Journal of Financial and
Quantitative Analysis,31(3), 377–397.
Altin, M., Kizildag, M., & Ozdemir, O. (2016). Corporate govern-ance, ownership structure, and credit ratings of hospitality firms. The Journal of Hospitality Financial Management, 24
(1), 5–19.
Baliga, B., Moyer, R. C., & Rao, R. S. (1996). CEO duality and firm performance: What’s the fuss?Strategic Management Journal,17(1), 41–53.
Barnhart, S. W., & Rosenstein, S. (1998). Board composition, managerial ownership, and firm performance: An empiri-cal analysis.Financial Review,33(4), 1–16.
Baysinger, B., & Hoskisson, R. E. (1990). The composition of boards of directors and strategic control: Effects on corpo-rate stcorpo-rategy.Academy of Management Review,15(1), 72–87. Beatty, R. P., & Zajac, E. J. (1994). Managerial incentives, monitoring, and risk bearing: A study of executive com-pensation, ownership, and board structure in initial public offerings.Administrative Science Quarterly,39(2), 313–335.
Bethel, J. E., & Liebeskind, J. (1993). The effects of ownership
structure on corporate restructuring. Strategic
Management Journal,14(S1), 15–31.
Boyd, B. K. (1995). CEO duality and firm performance: A contingency model. Strategic Management Journal, 16(4), 301–312.
Cahan, S. F., Chua, F., & Nyamori, R. O. (2005). Board structure and executive compensation in the public sector: New Zealand evidence. Financial Accountability & Management,21(4), 437–465.
Chen, M. H., Hou, C. L., & Lee, S. (2012). The impact of insider managerial ownership on corporate performance of Taiwanese tourist hotels. International Journal of Hospitality Management,31(2), 338–349.
Dalton, D. R., Daily, C. M., Johnson, J. L., & Ellstrand, A. E. (1999). Number of directors and financial performance: A meta-analysis. Academy of Management Journal, 42(6), 674–686.
Demsetz, H., & Villalonga, B. (2001). Ownership structure and corporate performance.Journal of Corporate Finance,
7(3), 209–233.
Donaldson, L., & Davis, J. H. (1991). Stewardship theory or agency theory: CEO governance and shareholder returns.
Australian Journal of Management,16(1), 49–64.
Eisenberg, T., Sundgren, S., & Wells, M. T. (1998). Larger board size and decreasing firm value in small firms.
Journal of Financial Economics,48(1), 35–54.
Ellstrand, A. E., Tihanyi, L., & Johnson, J. L. (2002). Board structure and international political risk. Academy of Management Journal,45(4), 769–777.
Elsayed, K. (2007). Does CEO duality really affect corporate performance? Corporate Governance: An International Review,15(6), 1203–1214.
Finkelstein, S., & D’aveni, R. A. (1994). CEO duality as a double-edged sword: How boards of directors balance
entrenchment avoidance and unity of command.
Academy of Management Journal,37(5), 1079–1108. Gu, Z., & Kim, Y. K. (2001). Managerial stock holdings and
firm performance: Empirical evidence from the restaurant industry.International Journal of Hospitality and Tourism Administration,2(1), 49–65.
Gu, Z. & Qian, Y. (1999). Hotel managerial ownership and firm performance: An empirical investigation.Tourism & Hospitality Research,1(2), 145–154.
Guillet, B. D., & Mattila, A. S. (2010). A descriptive examination of corporate governance in the hospitality industry.International Journal of Hospitality Management,29(4), 677–684.
Guillet, B. D., Seo, K., Kucukusta, D., & Lee, S. (2013). CEO duality and firm performance in the US restaurant indus-try: Moderating role of restaurant type. International Journal of Hospitality Management,33, 339–346.
Harrington, R. (2001). Environmental uncertainty within the hospitality industry: Exploring the measure of dynamism and complexity between restaurant segments. Journal of Hospitality & Tourism Research,25(4), 386–398.
Hart, O. (1995). Corporate governance: some theory and implications.The Economic Journal, 678–689.
Hill, C. W., & Snell, S. A. (1988). External control, corporate strategy, and firm performance in research-intensive industries.Strategic Management Journal,9(6), 577–590. Himmelberg, C. P., Hubbard, R. G., & Palia, D. (1999).
Understanding the determinants of managerial ownership and the link between ownership and performance.Journal of Financial Economics,53(3), 353–384.
Iannotta, G., Nocera, G., & Sironi, A. (2007). Ownership structure, risk and performance in the European banking industry.Journal of Banking & Finance,31(7), 2127–2149. Jensen, M. C. (1993). The modern industrial revolution, exit, and the failure of internal control systems. Journal of Finance,48(3), 831–880.
Jensen, M., & Meckling, W. (1976). Theory of the firm: Managerial behavior, agency costs and ownership struc-ture.Journal of Financial Economics,3, 305–360.
Johnson, R. A., Hoskisson, R. E., & Hitt, M. A. (1993). Board of director involvement in restructuring: The effects of board versus managerial controls and characteristics.
Strategic Management Journal,14(S1), 33–50.
Kang, K. H., Lee, S., & Huh, C. (2010). Impacts of positive and negative corporate social responsibility activities on com-pany performance in the hospitality industry.International Journal of Hospitality Management,29(1), 72–82.
Kesner, I. F., & Dalton, D. R. (1985). The effect of board composition on CEO succession and organizational per-formance. Quarterly Journal of Business and Economics,
24(2), 3–20.
Krause, R., Semadeni, M., & Cannella, A. (2014). CEO duality: A review and research agenda. Journal of Management, 40(1), 256–286.
Kwansa, F. A., Song, Y., Sharma, A., & Gong, Y. (2014). Link between executive stock ownership and corporate financial performance. The Journal of Hospitality Financial Management,22(2), 111–122.
Lee, S., & Park, S. Y. (2009). Do socially responsible activities help hotels and casinos achieve their financial goals?International Journal of Hospitality Management,28(1), 105–112.
Lipton, M., & Lorsch, J. W. (1992). A modest proposal for improved corporate governance.The Business Lawyer, 59–77. Luan, C. J., & Tang, M. J. (2007). Where is independent director efficacy?Corporate Governance: An International Review,15(4), 636–643.
Mehran, H. (1995). Executive compensation structure, own-ership, and firm performance. Journal of Financial Economics,38(2), 163–184.
Mizruchi, M. S. (1983). Who controls whom? An examina-tion of the relaexamina-tion between management and boards of directors in large American corporations. Academy of Management Review,8(3), 426–435.
Moon, J., & Sharma, A. (2014). The effect of board classifica-tion in the restaurant industry.The Journal of Hospitality Financial Management,22(1), 32–40.
Morck, R., Shleifer, A., & Vishny, R. W. (1988). Management ownership and market valuation: An
empirical analysis. Journal of Financial Economics, 20, 293–315.
Oak, S., & Iyengar, R. (2009). Investigating the differences in corporate governance between hospitality and nonhospi-tality firms. In J. Chen (Ed.),Advances in hospitality and leisure (Vol. 5). Bingley, England: Emerald Group Publishing Limited.
Oswald, S. L., & Jahera, J. S. (1991). The influence of owner-ship on performance: An empirical study. Strategic Management Journal,12(4), 321–326.
Ozdemir, O., & Upneja, A. (2012). Board structure and CEO compensation: Evidence from US lodging industry.
International Journal of Hospitality Management, 31(3), 856–863.
Park, K., & Jang, S. S. (2010). Insider ownership and firm
performance: An examination of restaurant firms.
International Journal of Hospitality Management, 29(3), 448–458.
Peng, M. W. (2004). Outside directors and firm performance during institutional transitions. Strategic Management Journal,25(5), 453–471.
Pfeffer, J. S., & Salancik, G. (1978). The external control of organizations: A resource dependence perspective. New York, NY: Harper & Row.
Rechner, P. L., & Dalton, D. R. (1991). CEO duality and organizational performance: A longitudinal analysis.
Strategic Management Journal,12(2), 155–160.
Reich, A. Z. (1993). Applied economics of hospitality produc-tion: Reducing costs and improving the quality of deci-sions through economic analysis. International Journal of Hospitality Management,12(4), 337–352.
Tsai, H., & Gu, Z. (2007). Institutional ownership and firm performance: empirical evidence from US-based publicly traded restaurant firms.Journal of Hospitality & Tourism Research,31(1), 19–38.
Tse, E. C. Y., & Olsen, M. D. (1988). The impact of strategy and structure on the organizational performance of restau-rant firms. Journal of Hospitality & Tourism Research, 12
(2), 265–276.
Warfield, T. D., Wild, J. J., & Wild, K. L. (1995). Managerial ownership, accounting choices, and informativeness of earn-ings.Journal of Accounting and Economics,20(1), 61–91. Wright, P., Ferris, S. P., Sarin, A., & Awasthi, V. (1996).
Impact of corporate insider, blockholder, and institutional
equity ownership on firm risk taking. Academy of
Management Journal,39(2), 441–458.
Yeh, C. (2013). Board governance and tourism firms’ perfor-mance: The case of Taiwan.Journal of Quality Assurance in Hospitality & Tourism,14(2), 123–141.
Yeh, C., & Trejos, B. (2015). The influence of governance on tourism firm performance. Current Issues in Tourism, 18
(4), 299–314.
Yermack, D. (1996). Higher market valuation of companies with a small board of directors. Journal of Financial Economics,40(2), 185–211.
16 J. IM AND Y. CHUNG