1
Information Management and Business Review Vol. 6, No. 1, pp. 1-7, Feb 2014 (ISSN 2220-3796)Fraud Risk Factors of Fraud Triangle and the Likelihood of Fraud Occurrence: Evidence from
Malaysia
Shabnam Fazli Aghghaleh*, Takiah Mohd. Iskandar, Zakiah Muhammaddun Mohamed Universiti Kebangsaan Malaysia, Malaysia
*Sh.fazli64@yahoo.com
Abstract: The current research studies the usefulness of Cressey’s fraud risk factor framework adopted from SAS No. 99 to prevent fraud from occurring. In accordance with Cressey’s theory, pressure, opportunity and rationalization are existing when fraud occurs. The study suggests variables as proxy measures for pressure and opportunity, and test these variables using publicly available information relating to a set of fraud firms and a sample of no-fraud firms. Two pressure proxies and two opportunity proxies are identified and suggested to be significantly related to financial statement fraud. We find that leverage and sale to account receivable are positively related to the likelihood of fraud. Audit committee size and board of directors’ size are also linked to decrease the level of financial statement fraud. A binary logistic model based on examples of fraud risk factors of fraud triangle model measures the likelihood of financial statement fraud and can assist experts.
Keywords: Risk Factors, Financial Statement Fraud, Fraud Triangle, SAS 99, Fraud Occurrence 1. Introduction
Increasing the number of financial frauds such as Enron and WorldCom rise public concern regarding the reliability of financial statements. Fraud is a discussion that receives high level of attention from regulators, auditors, and the public due to the increment in corporate failures. According to prior studies, organizations commonly try to investigate on detecting frauds rather than prevention. For instance, Libby & Tan (1994), Bonner & Lewis’s (1990), Mui (2009), Alleyne et al. (2010), Hassink et al. (2009) examined factors that may have a direct impact on detecting fraud. Although there are numbers of studies on fraud, the Association of Certified Fraud Examiners (ACFE 2012) reported a high percentage of fraud occurrence worldwide. The report analyzed 1388 fraud cases globally and categorized fraud into three groups of asset misappropriation, corruption and financial statement fraud. The findings indicated that asset misappropriation has the most frequency with more than 86 percent of cases but caused the lowest range of loss at US$ 120000. In contrast, financial statement fraud involved less than 8 percent of the cases, but the majority of losses were related to this category with US$ 1 million.
In reaction to the weaknesses of the fraud detection process, the Statement of Auditing Standards (SAS) No. 99 was established by the American Institute of Certified Public Accountants (AICPA) in October 2002. The objective of SAS No. 99 was improving the efficiency and productivity of auditors in fraud detection by assessing the fraud risk factors in organizations. Before the establishment of SAS No.99, AICPA (1988) issued SAS 53 to explain the auditors’ roles in identifying errors and material misstatements that lead to financial statement. However, Moyes & Hasan (1996) believed that the concentration on auditors’ qualification in fraud detection is insufficient. Therefore, SAS No. 82 was established in 1997 to help auditors in detecting the fraud of financial statements practically. This standard provides more comprehensive instructions about fraud detection by observing high-risk areas and divisions compared to SAS 53. Additionally, due to the high rate of business failures, new auditing standards (SAS No. 99) concentrate on the requirements of regulators and auditors for preventing and detecting fraud. According to Ramos (2003), the objective of SAS 99 is increasing the auditors’ role to fully incorporating fraud in the audit process. The fraud risk factors of SAS 99 are based on the fraud triangle model developed by Cressey (1953). Based on this model, the fraud risk factors categorized into three groups of pressure/motivation, opportunity and rationalization. The prior studies indicated that evaluation of this information about fraud may enhance the level of risk assessment and detection, but the literature on the relationship between Cressey’s theory and financial statement fraud is
2
limited. The majority of researchers in detecting fraud utilized data from developed countries, particularly USA.
The current study extends the issue to Malaysian organizations, because according to PwC’s global economic crime survey (2011) 44% of respondents in Malaysia were victims to one or more frauds in 2011. The current study also use proxy variables rating pressure/ motivation and opportunity, in accordance with prior studies. In addition, this study tests two legs of fraud triangle model to assess likelihood of financial statement fraud occurrence, which can be beneficial for auditors, insiders, shareholders and legislators. The sample of this study were selected from Security Commission Malaysia (SC), Bursa Malaysia and prior studies. The list of fraud firms were collected from Security Commission Malaysia (SC) during 2002-2012. The list recognized by (Kwan & Kwan, 2011) for fraudulent financial statement cases was also used in this study. The data were collected from DataStream database and annual reports of companies. Using 40 fraud firms and 100 non-fraud firms, this study examines whether the proxy variables for fraud risk factors are correlated to likelihood of financial statement fraud. The findings suggest that all the pressure proxy variables (Sales to Accounts receivables and leverage) are positively correlated to the level of financial statement fraud occurrence. It is also found that firms with more audit committee and board members, as opportunity proxies, experience low level of financial statement fraud. This study is organized as follows. The following section discusses the prior research and development of hypotheses, continued by research design and sample. In subsequent section empirical findings are reported and discussed. Finally, the conclusion is presented.
2. Literature Review
Prior Research and Development of Hypotheses: Recently, the involvements of researchers in fraud area have grown rapidly to examine potential fraud risk factors to assess, predict and detect fraud (Persons, 1995; Beasley, 1996; Kaminski et al. 2004). For instance, Albrecht & Romney (1986) examined usefulness of red flags in fraud prediction. Later, by establishing SAS 53 (1988), a large number of studies have focused on assessing risk of financial statements to find out the possible risk factors (Loebbecke, Eining, & Willingham, 1989). The other studies extended Loebbecke et al. (1989) model to take in a non-fraud sample and also find the best model for assessing risk and detecting fraud ( Nieschwietz et al., 2000; Wilks & Zimbelman, 2004). The questionnaire were utilized by a number of studies to find out the significance of fraud risk factors determined through SAS 53 or SAS 82 in fraud prevention and detection. As an example, Albrecht and Romney (1986) employed 87 red flags and Bell and Carcello (2000) utilized 47 factors to estimate the likelihood of financial statement fraud occurrence. Asare and Wright (2004) compared the auditors utilized the factors determined in SAS 82 with auditors who don’t use the checklist and found that the diagnoses are less effective amongst the first group. Smith et al. (2005) investigated the most significant factors that were noticed by auditors to find out how auditors’ demographic factors influence the significance of fraud risk factors for fraud prevention in Malaysia. The findings suggested that operational and financial permanence factors have the highest effect on fraud prevention, continuing with management attributions and finally affected by industry characteristics.
Using publicly existing information, Calderon and Green (1994) evaluated fraud risk factors significance in predicting financial reporting fraud. Later, various analytical procedures, including financial and operational data were used to predict and detect fraud (Blocher & Cooper, 1988; Blocher, 1992). Leverage, capital turnover, asset composition and firm size found as the most substantial factors for fraud detection by Persons (1995). In contrast, some studies discussed about the limited ability of financial ratios in fraud detection (Kaminski et al. 2004; Apostolou et al., 2001). Hence, American Institute of Certified Public Accountant (AICPA 2002) issued different standards to prove the negative impression of fraud on the accounting and auditing functions and also to enhance the level of fraud detection by introducing numbers of fraud risk factors (SAS 53, SAS 82 and SAS 99) (Heiman-Hoffman et al., 1996; Wilks & Zimbelman, 2004). Among different standards, SAS 99 is the only standard adopted from the fraud triangle model which will be discussed throughout this study. Cressey’s fraud theory, which is defined as the fraud triangle theory was utilized in different studies and also in issuing standards, as an instrument, to assess the significance of fraud risks factors in fraud detection. The Commission of the Treadway Committee (1987) examined the causes of fraud occurrence and confirmed Cressey’s results. The findings indicated that financial statement fraud
3
happens because of several reasons including environmental, institutional, or individual forces and opportunities. These forces and opportunities increase the level of pressures which in turn support employees and companies to involve in fraudulent activities. Moreover, the existence of explosive mixture of forces and opportunities increase the prevalence of financial reporting fraud. SAS No. 99 (2002) supported Cressey’s fraud model by stating that: “Three elements are existing when fraud happens. First, individuals have a pressure, which is a reason to commit fraud. Second, settings exist. Third, those involved are able to rationalize committing a fraudulent act. According to SAS No.99, auditors are required to detect the fraudulent behaviors through evaluating the existence of each condition of pressure, opportunity and rationalization.
Wilks and Zimbelman (2004) tested whether evaluating the attitude, opportunity and incentive factors separately increase or decrease the level of fraud assessment by auditors. The questionnaire included 40 factors, adopted from SAS 99, distributed amongst auditors. The findings indicated that when the perception of management’s attitude regarding risk of fraud is low, the level of sensitivity of auditors to opportunity and incentive is higher when they assess separately compared to assessing overall fraud risk. Skousen and Wright (2006) constructed a model consists of risk factors limited to pressures and opportunities to estimate the level of fraud occurrence. The findings indicated positive relationship between pressure and high level of fraud occurrence, and also suggested that high opportunity amongst the individuals increase the level of fraud incidence in companies. To improve the previous study, Skousen and Wright (2008) developed some proxies to measure the elements of fraud triangle and find the impact of these factors on predicting and detecting fraud in financial statement. The study included five proxies for pressure and two proxies for opportunity which were found to have significant impact on financial statement fraud. Lister (2007) suggested that pressure is a significant factor in committing fraud as “the foundation of heat for the fire”. He determined three types of pressure including personal, employment stress, and external pressure. Lister defined opportunity as “the fuel that keeps the fire going”. It was mentioned that even if individuals are motivated to perform the fraud, they cannot carry out the crime unless they have sufficient opportunity. As the third element of the fraud triangle model, rationalization identified as “the oxygen that keeps the fire burning”. Lister selected the corporate culture as a proxy to evaluate rationalization instead of individually measurement. Vona (2008) examined personal and corporate pressures as motivations’ proxies for fraud commitment. The findings suggested direct relationship between opportunity and capability to hide the fraudulent behavior. Hence, identifying the opportunities that increase the incidence of fraud, increase the ability of auditors to find out the fraud committed by individuals. The current study intends to suggest a logical model for assessing fraud risk instead of long red flags lists, and provide a useful tool for experts.
Fraud risk factors proxies for pressure: In Cressey’s model (1953), first element represents financial requirements due to different problems. A number of studies examined different perspectives of pressure. For instance, Albrecht et al. (2008, 2010) divided pressure/motive into financial or non-financial. Murdock (2008) separated pressure into financial, non-financial, political and social categories. Rae and Subramaniam (2008) studied employees’ motivation and financial pressure dimensions. Chen and Elder (2007) identified six basic categories for pressure including transgression of obligations, problems originated from individual problems, corporate inversion, position achievement and relationship between employees. Albrecht et al. (2008) categorized pressure in four groups including economic, vice, job-related and other pressures. The findings suggested that the majority of fraud originate from financial or vice-related pressure. Chen and Elder (2007) used three proxies including analysts forecast error, negative cash flow from operations, and directors’ shareholdings pledged for loans and credits ratio to measure the pressure based on TSAS 43. According to TSAS 43, management pressure increase because of their profitability. In addition, managers focus on thresholds for earnings to affect the insights of financial statement users who are interested in organizations’ performance. One of the thresholds is analyst earnings forecast which can show the information about the earnings’ consistency (Barth & Hutton, 2004). Moreover, TSAS 43 proposed that profitability and productivity can be influenced by financial and operational conditions of the company. It is suggested that the financial situation of management or board of directors is endangered by financial performance of the organization. Chen and Elder (2007) used the stock pledge percentage which is measured by the percentage of directors’ and supervisors’ shareholdings pledged for loans and credits as a proxy for individuals’ financial pressure. Hence, the following hypotheses will be developed as follows:
4
Fraud Risk Factor Proxies for Opportunity: In accordance with Cressey model, pressure alone will not cause fraud commitment. The financial problems are motivations for individuals to commit fraud but the fraud perpetrator should find out whether he has the occasion to perform fraud without being caught. Chen and Elder (2007) used three proxies based on TSAS 43 to measure opportunity including related party transactions, CEO duality and difference between control and cash flow rights. Moyes et al. (2005) surveyed amongst 77 internal auditors and found that the presence of related party transactions has the second rank amongst various opportunity risk factors. Wilks and Zimbelman (2004) investigated 52 audit managers and suggested that related party transactions had third place amongst six factors. Ming and Wong (2003) also used this proxy to measure the opportunity. Another proxy determined by prior studies is ineffective monitoring that is caused by CEO duality. CEO duality increases the CEO entrenchment which decreases the shareholders interest. Vance (1983) suggested that CEO domination decrease the effectiveness of board to provide accurate control over management activities. Another proxy is organizational structure. Claessens et al. (2000) proposed that family owned business is a significant type of business amongst Taiwanese listed companies that influence the fraud occurrence. In accordance with prior discussions, the second hypothesis will be distributed as follows:
H2: The level of opportunity is positively related to financial statement fraud occurrence.
3. Methodology
Regression Models: This study uses a logistic regression model to examine the relationship between pressure and opportunity factors and the level of fraud occurrence.
Fraud= β0+ β1 SALAR + β2 LEV + β3 AUDCSIZE + β4 BRDSIZE+ ε
Where:
FRAUD = Coded 1 if the firm experienced fraud previously and 0 otherwise. SALAR= Sales to Accounts receivables
LEV= Total debt to Total assets
AUCSIZE= Number of audit committee members BRDSIZE= Number of board of directors members
The FRAUD as the dependent variable is a dummy variable representing whether the firm has experienced fraud. Hypothesis 1 predicts that financial statement fraud is more likely to occur when the pressure is high. This study assumes that the coefficients on sales to accounts receivables ratio and leverage are positively associated with the fraud occurrence in organizations. Hypothesis 2 expects that organizations experience high level of fraud when there is more opportunity for fraud commitment. We expect that the numbers of audit committee and board of directors’ members are negatively associated with the likelihood of financial statement fraud occurrence. To examine our hypotheses, the regression model utilized to test the relationship between defined proxies and the probability of financial statement fraud occurrence.
Sample selection: The sample of this research is divided into two groups of fraud and non-fraud companies. The list of fraud companies is originated from a study in Malaysia which investigated the governance and company value (Kwan & Kwan, 2011). Another source for updating fraud companies list is Security Commission Malaysia (SC) website. Data on leverage, total sale and account receivable is collected through DATASTREAM database. Another source of collecting these data is companies’ annual reports getting from Bursa Malaysia website. Overall, the sample includes 40 fraud companies and 100 non-fraud companies for the period of 2002 to 2012 for this study.
4. Findings
Table 1 presents the descriptive statistics for 40 fraud firms and 100 non-fraud firms with univariate tests. For pressure proxies, sale to account receivable (SALAR), on average, are 16.65 (4.54) for fraud (non-fraud) firms. The difference in SALAR between fraud and non-fraud companies is significant at 0.01 level, which indicate positive relationship between higher sales to account receivable and fraud occurrence. Leverage, on average, is 0.62 (0.22) percent of fraud (non-fraud) firms for the examined sample. The difference in leverage between fraud and non-fraud companies suggested to be significant at 0.01 level which shows that companies with fraud are more probable to indicate negative leverage from operations than non-fraud companies. The mean of audit committee size is 3.07 (3.46) for fraud (non-fraud) companies. The results indicate that the
5
difference in audit committee size between fraud and non-fraud companies is also significant at 1% level, which indicate that companies with fewer audit committee members experience more fraud. Additionally, the difference in number of board of directors’ members between fraud and non-fraud companies is significant at 1 percent level.
Table 1: Sample Statistics
Risk Factors Non-fraud firms (N=100) Mean Std. Dev Fraud firms (N=40) Mean Std. Dev Z value Wilcoxon Test Pressure SALAR 4.54 3.481 16.654 11.668 -6.510** LEV 0.2238 0.2010 0.620 0.622 -1.762* Opportunity AUDCSIZE 3.46 0.596 3.07 0.258 -6.610** BRDSIZE 7.71 1.692 6.00 1.069 -6.530**
Table 2 demonstrates the Pearson correlation matrix for the variables of the study. Sale to Account receivable (SALAR) and Leverage (LEV) found to have positive relationship with fraud occurrence and are significant at 0.01 level. In contrast, audit committee and board size are negatively correlated with likelihood of fraudulent financial statement and both are significant at 0.05 and 0.01 levels, which is consistent with the related hypothesis.
Table 2: Correlation matrix for the variables (n=140) Correlations
SALAR leverage ACsize BSize FRAUD
SALAR 1
leverage .145 1
ACsize -.211 -.094 1
BSize -.315* -.136 .210 1
FRAUD .653** .444** -.320* -.444** 1
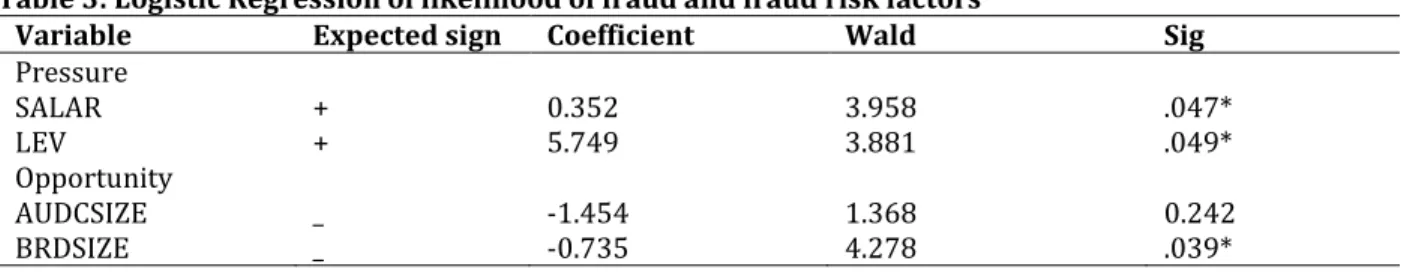
The binary logistic regression analysis is utilized to test the hypotheses of this study. Binary logistic regression refers to the cases that have only two possible types of outcomes. In this study, the dependent variable has two types of fraud and non-fraud companies so binary logistic regression method will be used. Table 3 provides the hypothesis testing results. Hypothesis 1 suggests that companies with high pressure experience more levels of fraud occurrence. Hypothesis 2 predicts positive relationship between opportunity factors and probability of fraud incidence. The developed model regress the likelihood of financial statement fraud (FRAUD) based on fraud risk factor proxies (pressure and opportunity). The results indicate that the coefficients on sale to account receivable (B= 0.352) and leverage (B= 5.749) are significantly positive at 0.05 level, suggesting that firms with high pressure are more likely to experience fraud. In addition, audit committee and board size as proxies of opportunity and financial statement fraud found to have negative relationship, suggesting that firms with more number of audit committee and board members increase the level of internal control and in turn decrease the percentage of fraud occurrence in companies (B= -1.454 for AUDCSIZE; B= -0.735 for BRDSIZE). The findings also suggested that the effect of audit committee size is not significant but board size influence fraud significantly at 0.05 levels.
Table 3: Logistic Regression of likelihood of fraud and fraud risk factors
Variable Expected sign Coefficient Wald Sig
Pressure SALAR + 0.352 3.958 .047* LEV + 5.749 3.881 .049* Opportunity AUDCSIZE _ -1.454 1.368 0.242 BRDSIZE _ -0.735 4.278 .039*
6
5. ConclusionThe current study examines two fraud risk factors adopted from the fraud triangle model which is the basis of different standards to evaluate the probability of fraud occurrence. 40 fraud and 100 non-fraud companies are selected to study and examine a logistic regression model that assess the possibility of fraud occurrence. Proxy variables examined in this study include sale to account receivable (SALAR) and Leverage (LEV) for pressure and number of audit committee members (AUDCSIZE) and number of board members (BRDSIZE) for opportunity. Results indicate that likelihood of fraud occurrence is positively related to more sale to account receivable percentage and more leverage. It is suggested that the correlation between audit committee and board size are negative consistent to prior studies. The limitation of this study is the inability to identify the appropriate proxy for rationalization as SAS no.99 also noted about the difficulty associated with isolating characteristics used as indicators of rationalization.
Reference
Albrecht, W. S., Albrecht, C. & Albrecht, C. C. (2008). Current trends in fraud and its detection. Information Security Journal: A global perspective, 17(1), 1-32.
Albrecht, W. S. & Romney, M. B. (1986). Red-Flagging Management Fraud: A Validation. Advances in Accounting, 3, 323-334.
Albrecht, C., Turnbull, C., Zhang, Y. & Skousen, C. J. (2010). The relationship between South Korean chaebols and fraud. Managerial Auditing Journal, 33(3), 1-25.
Alleyne, P., Persaud, N., Alleyne, P., Greenidge, D. & Sealy, P. (2010). Perceived effectiveness of fraud detection audit procedures in a stock and warehousing cycle, Additional evidence from Barbados. Managerial Auditing Journal, 25 (6), 553-568.
American Institute of Certified Public Accountants (AICPA). (1984). Audit Risk and Materiality in Conducting an Audit. Statement on Auditing Standards No. 47. New York, NY: AICPA.
American Institute of Certified Public Accountants (AICPA). (2002). Consideration of fraud in a financial statement audit. Statement on Auditing Standards No. 99. New York, NY: AICPA.
Apostolou, B., Hassell, J., Webber, S. & Sumners, G. (2001). The Relative Importance of Management Fraud Risk Factors. Behavioral Research in Accounting, 13, 1-24.
Asare, S. K. & Wright, A. M. (2004). Audit: The effectiveness of alternative risk assessment and program planning tools in a fraud setting. Contemporary Accounting Research, 21(2), 325–352.
Association of Certified Fraud Examiners (ACFE).0 (2012). Report to the Nations on Occupational Fraud and Abuse, 2012 Global Fraud Survey.
Auditing Standards Board. (2002). Statement on Auditing Standards No.99: Consideration of Fraud in a Financial Statement Audit.
Barth, M. & Hutton, A. (2004). Analyst Earnings Forecast Revisions and the Pricing of Accruals, Review of Accounting Studies, 91, 59-96.
Beasley, M. (1996). An empirical analysis of the relation between the board of director composition and financial statement fraud. The Accounting Review, 71(4), 443-465.
Bell, T. B. & Carcello, J. V. (2000). A decision aid for assessing the likelihood of fraudulent financial reporting. Auditing: A Journal of Practice and Theory, 19(1), 169-184.
Blocher, E. & Cooper, J. C. (1988). A Study of Auditors Analytical Review Performance. Auditing: A Journal of Practice and Theory, 7(2), 1-28.
Blocher, E. (1992). The Role of Analytical Procedures in Detecting Management Fraud. Institute of Management Accountants, Montvale, NJ.
Bonner, S. E. & Lewis, B. L. (1990). Determinants of auditor expertise, Journal of Accounting Research, 3, 1-20. Calderon, T. G. & Green, B. P. (1994). Analysts’ Forecasts as an Exogenous Risk Indicator in Analytical
Auditing. Advances in Accounting, 12, 281-300.
Chen, K. Y. & Elder, R. J. (2007). Fraud Risk Factors and the Likelihood of Fraudulent Financial Reporting: Evidence from Statement on Auditing Standards No. 43 in Taiwan, Working paper.
Claessens, S., Djankov, L. & Lang, L. (2000). The separation of ownership and control in East Asian Corporations. Journal of Financial Economics, 58, 81-112.
7
Hassink, H., Bollen, L. H., Meuwissen, R. H. G. &Vries, M. J. (2009). Corporate fraud and the audit expectations gap: A study among business managers. Journal of International Accounting, Auditing and Taxation, 18, 85-100.
Heiman-Hoffman, V. B., Morgan, K. P. J. & Patton, M. (1996). The Warning Signs of Fraudulent Financial Reporting. Journal of Accountancy, 182(4), 75-81.
International Auditing Standards Board. (2009). International Standard on Auditing No.240: the Auditor’s responsibilities relating to fraud in an audit of financial statements.
Kaminski, K., Wetzel, T. & L. Guan. (2004). Can financial ratios detect fraudulent financial reporting? Managerial Auditing Journal, 19 (1), 15-28.
Kwan, J. H. & Kwan, S. S. (2011). Violation of listing requirements and company value: Evidence from Bursa Malaysia. International Review of Business Research Papers, 7(2), 257-268.
Loebbecke, J., Eining, M. & Willingham, J. (1989). Auditors’ Experience with Material Irregularities: Frequency, Nature, and Detectability, Auditing. A Journal of Practice & Theory, 9(1), 1-28.
Libby, R. & Tan, H. T. (1994). Modeling the determinants of audit expertise. Accounting, Organizations and Society, 19(8), 701-716.
Lister, L. M. (2007). A practical approach to fraud risk. Internal Auditor, 1-30.
Ming, J. J. & T. J. Wong. (2003). Earnings management and tunneling through related party transactions: Evidence from Chinese corporate groups. EFA 2003 Annual Conference, Paper No.549.
Moyes, G. D. & Hasan, I. (1996). An empirical analysis of fraud detection likelihood. Managerial Auditing Journal, 11(3), 41-46.
Moyes G., Lin, P. & Landry-Jr, R. (2005). Raise the red flag. Internal Auditor, October: 47-51.
Mui, G. Y. (2009). Defining auditor expert performance in fraud detection. Accounting and Finance Association of Australia and New Zealand (AFAANZ)
Murdock, H. (2008). The three dimensions of fraud. Internal Auditor, 1-14.
Nieschwietz, R., Schultz-Jr, J. & Zimbelman, M. (2000). Empirical research on external auditors’ detection of financial statement fraud. Journal of Accounting Literature, 19, 190-246.
Persons, O. (1995). Using financial statement data to identify factors associated with fraudulent financial reporting. Journal of Applied Business Research, 11(3), 38-46.
Rae, K. & Subramaniam, N. (2008). Quality of internal control procedures: Antecedents and moderating effect on organizational justice and employee fraud. Managerial Auditing Journal, 23(2), 1-43.
Ramos, M. (2003). Auditors Responsibility for Fraud Detection. Journal of Accountancy, 195(1), 28-36.
Skousen, C. & Wright, C. (2006). Contemporary risk factors and the prediction of financial statement fraud. Working Paper. University of Texas at Arlington and Oklahoma State University.
Skousen, C. & Wright, C. (2008). Contemporaneous risk factors and the prediction of financial statement fraud. Journal of Forensic Accounting, 6, 37-62.
Smith, M., Omar, N. H., Syad Idris, S. I. Z. & Baharuddin, I. (2005). Auditors’ perception on fraud risk indicators: Malaysian evidence. Managerial Auditing Journal, 20(1), 73-85.
Vance, S. (1983). Corporate leadership: Boards, directors and strategy. New York: McGraw-Hill.
Vona, L. W. (2008). Fraud risk assessment: Building a fraud audit program. Hoboken New Jersey: John Wiley and Sons.
Wilks, T. J. & Zimbelman, M. F. (2004). Decomposition of Fraud-Risk Assessments and Auditors’ Sensitivity to Fraud Cues. Contemporary Accounting Research, 21(3), 719-745.