Policy Research Working Paper
5367
How Can Public Spending Help You Grow?
An Empirical Analysis for Developing Countries
Nihal Bayraktar
Blanca Moreno-Dodson
The World Bank
Poverty Reduction and Economic Management Network
Office of the Vice President
July 2010
WPS5367
Public Disclosure Authorized
Public Disclosure Authorized
Public Disclosure Authorized
Produced by the Research Support Team
Abstract
The Policy Research Working Paper Series disseminates the findings of work in progress to encourage the exchange of ideas about development issues. An objective of the series is to get the findings out quickly, even if the presentations are less than fully polished. The papers carry the names of the authors and should be cited accordingly. The findings, interpretations, and conclusions expressed in this paper are entirely those of the authors. They do not necessarily represent the views of the International Bank for Reconstruction and Development/World Bank and its affiliated organizations, or those of the Executive Directors of the World Bank or the governments they represent.
Policy Research Working Paper 5367
Although many studies indicate that both the level and composition of public spending are significant for economic growth, the results in the empirical literature are still mixed. This paper studies the importance of country sample selection and expenditure classification in explaining these conflicting results. It investigates a set of fast-growing countries versus a mix of countries with different growth patterns. The regression specifications include different components of public expenditure and total fiscal revenues, always considering the overall government budget constraint.
Total public spending is first disaggregated using a definition that classifies public spending as productive
versus unproductive components, an a priori criterion
that is based on the expected impact of public spending items on the private sector production function. After
This paper—a product of the Office of the Vice Prsident, Poverty Reduction and Economic Management Network —is part of a larger effort in the department to draw policy lessons for developing countries on “fiscal policy for growth and development”. Policy Research Working Papers are also posted on the Web at http://econ.worldbank.org. The author may be contacted at [email protected].
empirically confirming the validity of this definition in the panel analysis, the authors suggest and test an alternative definition of “core” public spending that may be more appropriate for developing countries. The empirical analysis shows that the link between growth and public spending, especially the productive and “core” components, is strong only for the fast-growing group. In addition, macroeconomic stability, openness, and private sector investment are significant in the fast-growing group, which points to the existence of an economic policy environment more conducive to growth in the first group of countries. The authors conclude that public spending can be a significant determinant of growth for countries that are capable of using funds for productive purposes.
How Can Public Spending Help You Grow?
An Empirical Analysis for Developing Countries
1Nihal Bayraktar
Penn State University and World Bank and
Blanca Moreno-Dodson World Bank
JEL codes: H50, O11, O23
Key words: Public spending, productive expenditure, core spending, government budget, economic growth
1
The authors would like to thank Pierre Richard Agénor, Professor at the University of Manchester and Center for Growth and Business Cycles Research; Vito Tanzi, former IMF Fiscal Affairs Department Director; and Gilles Nancy, Professor at the University of Aix-Marseille II, for their helpful comments. This version also reflects the comments received when the paper was presented at the ECLAC Fiscal Policy Seminar for Latin America held in Chile in January 2010.
2
EXECUTIVE SUMMARY
Even though, in many studies, it has been shown that total public spending and some of its components are significant for economic growth, the empirical literature results are still mixed. We try to understand the importance of country sample selection and expenditure classification to explain these conflicting results. We conclude that public spending can be a significant determinant of growth for countries that are capable of
using expenditures for productive purposes. As a follow up to a previous study2, this
paper empirically investigates how the impact of public spending on growth varies when countries are classified according to their overall growth performances. The analysis compares fast-growing versus a mix of countries with different growth patterns. Seven countries are included in each group and the dataset covers the period of 1970-2005. In the regression specifications we include different components of public expenditure and
fiscal revenues, always considering the overall government budget constraint. A priori,
while the size of the government does not appear to be much different (on average) in
these two groups, the composition of public expenditures varies significantly. A
posteriori, the empirical analysis based on OLS and dynamic GMM techniques for panel data shows that the link between public spending, especially both its productive and “core” components, and growth, after controlling for other macroeconomic and private sector variables, and taking into account country initial conditions, is both economically and statistically strong only for the fast-growing group. When all countries are combined in the same regression analysis, the link between government spending and growth gets much weaker on average and even turns negative in some cases. However, when group effects in the combined set are controlled for, through interactive dummies, the stronger link between public spending and growth in the fast-growing group is clearly confirmed. A possible nonlinear relationship between growth and public spending is also investigated, but no statistical significance is found for it. Macroeconomic stability, openness, and private sector investment are confirmed to be significant in the fast-growing country group, which point out to the existence of a policy environment more
conducive to growth in that group of countries.A final implication of the analysis is that
differences in empirical findings of the previous literature linking public spending and economic growth may be explained by the selection of countries included.
2
Moreno-Dodson (2008) shows that the volume of total public spending as well as its composition are relevant in explaining economic growth for a set of fast-growing developing countries during 1970-2004.
3
I. INTRODUCTION
The importance of public spending and its components in economic growth has been extensively studied in the literature. Within an endogenous growth framework, Barro (1990) first introduced public sector components in the production function. Many empirical studies have followed this seminal paper to investigate the possible link between various components of government spending and growth, using many different econometric techniques, empirical settings, and samples of countries. Results presented in the literature are mixed. Even though most studies support the substantial positive link between some components of public spending and growth, there is still no agreement on which categories of spending promote growth. The introduction of advanced econometric techniques and new variables in the empirical specifications has not solved the problem entirely.
One possible explanation for the mixed results in the literature is sample selection. What we expect is that public spending can improve growth performance of countries only if they are able to use these expenditures productively. In light of this expectation, we raise the following questions:
(1) Are there any obvious differences, in terms of the level of public spending, its components, and their link to growth, between fast-growing developing countries and other developing countries where growth records are less impressive or volatile?
(2) What is the role of the composition of public spending with respect to the growth performance of countries?
Given that many governments in developing countries have been increasing public spending to provide a short-term economic stimulus since the start of the 2009 global economic crisis, we believe that the questions above are more relevant than ever. Indeed, they may have important implications for changes in the composition of public expenditure, to the extent that different allocations may involve dynamic tradeoffs in their short- and medium-term impacts on growth.
While most empirical analyses linking public spending and growth combine many different countries in their samples, this paper groups countries into two: a homogeneous sample of developing countries in terms of their growth performances and a more heterogeneous sample. The analysis presented is applied to a sample of seven
fast-growing developing countries (the same group considered in Moreno-Dodson, 2008)3 and
seven other developing countries whose growth patterns have been somehow less stable and more volatile during the period of analysis. The first set contains Korea, Singapore,
3
Moreno-Dodson (2008) empirically investigates the impact of public spending and its components on economic growth, focusing on a sample of seven fast-growing developing countries. She finds that some components of public expenditure, particularly those considered “productive,” can significantly explain economic growth. Despite the fact that there are some differences at the country level, the results are consistent across different econometric techniques used to estimate the statistical significance of public spending items.
4
Malaysia, Thailand, Indonesia, Botswana, and Mauritius, which were among the top performers in the world in terms of GDP per capita growth during the period between
1960 and 2005.4 The second set includes Chile, Costa Rica, Mexico, the Philippines,
Turkey, Uruguay and Venezuela, and is taken as a comparison group to enhance and validate the previous econometric estimates and to further examine the influence of
public expenditures on growth in a larger group of developing countries.5
Two alternative classifications of public spending are introduced in the paper. Total public spending is first disaggregated using a definition based on Bleaney, Kneller, and Gemmell (2001), and Kneller, Bleaney and Gemmell (1998), which classifies public
spending as productive versus unproductive components, an a priori criteria which is
based on the expected impact of public spending items on the private sector production function. After empirically confirming the validity of this definition in our cross-country
analysis, we suggest and test an alternative definition of “core” public spending which,
we think, can be more appropriate for developing countries.
In the specifications we include fiscal revenues, always considering the overall government budget constraint. Introducing the government budget constraint has been essential to separate the possible positive effect of public spending on growth while taking into account its sources of financing and their possible negative implications for growth. When looking at the coefficients of public spending together with fiscal revenue and balance, the net effect of public spending on growth can be clearer. In the empirical specifications, total public spending and its components are lagged one period. The rationale is that it takes time for executed public spending to influence growth.
The paper presents a comparative analysis and panel regressions using OLS and dynamic GMM techniques. Since we use annual data, the focus of the OLS results is on the short-run analysis, while the GMM results refer to a dynamic, multi-year framework. For robustness check it is important to confirm the results using different econometric techniques. The GMM technique also controls for endogeneity among regressors.
In addition to the linear relationship between public spending and growth, a possible nonlinear link must also be analyzed. The nonlinear analysis is essential to understand the shape of the function linking growth to public spending and can have different policy
implications.6 For example, if the link between public spending and growth is positive
and concave, higher and higher public spending may have less and less impact on growth. On the other hand, if the link is positive and convex, we expect higher public spending to
4
All the countries selected in the sample have sustained GDP per capita growth rates of at least 3% (by decade average) during 1960-2005.
5
It should be noted that the availability of data for the period of analysis is the main decision factor in selecting these countries.
6
Another type of nonlinearities associated with the effect of government spending on growth relates to threshold effects. In particular, there is increasing evidence that spending on infrastructure may be subject to “critical mass” or “network” effects, which imply that its impact on growth becomes significant (or is magnified) beyond a certain level; see for instance Pushak, Tiongson, and Varoudakis (2007) and Kellenberg (2009). However, this type of nonlinearities is mostly associated with the stock of public assets, rather than spending flows, which are the focus of this paper.
5
lead to a relatively even larger effect on growth. When compared with previous papers, the main difference of our nonlinear analysis is that we consider a dynamic setting where the overall budget constraint is also taken into account.
The paper is structured as follows. Section II presents the literature review. Section III presents the data and provides relevant facts and information about the two groups of countries during the period of analysis. Section IV describes the empirical methodology, function specification, and variables selected. Section V is dedicated to panel regression analysis. Finally, Section VI draws policy implications and concludes.
II. LITERATURE REVIEW
Despite the fact that the link between public expenditure and economic growth has been investigated extensively in the literature, robust conclusions have been difficult to
establish.7 Even though, in recent studies, there is some convergence in terms of the
significance of public spending on growth, the results still change from country to country, or from sample to sample, and appear to be a function of many different factors. Conflicting results start from the earlier years of the literature. In his influential theoretical paper, Barro (1990) extends the endogenous growth framework including tax-financed government services. He concludes that government expenditure is positively linked to economic growth when the share of government expenditure (and consequently the tax rate) is low, but then turns negative due to increasing inefficiencies as the share of expenditure increases (related to the disincentive effect of higher tax rates on private capital accumulation), indicating a nonlinear relationship between government expenditure and growth. But, in his follow-up paper (Barro, 1991), the theoretically expected link between public spending and growth could not be empirically proved. Using cross-country analysis and including 98 developing countries for the period of 1960-1985, the study finds that public consumption is negatively correlated with growth, while public investment does not have a significant impact on economic development.
There are also other early empirical studies indicating the opposite.8 Grossman (1990),
using a sample consisting of 48 developed and developing countries, shows that government spending has both positive and negative impacts on growth; the positive one works through higher productivity and the negative one is caused by inefficient provision and distortionary effects of public taxation. However, he concludes that the positive influence dominates. Similarly, Levine and Renelt (1992) show that taking into account the components of government spending can make a difference. In their paper, they separate government spending in two broad categories, consumption expenditure and
7
See Slemrod (1995) for the literature review on the link between government expenditure, taxes, and growth.
8
An empirical study of Easterly and Rebelo (1993), using a sample similar to the one used by Barro (1991), finds that public investment in communication and transportation as well as general government investment promotes economic growth. Glomm and Ravikumar (1997) review some of the papers studying the influence of productive government expenditures on long-run growth and conclude that government expenditures on health, education and infrastructure have large impacts on growth.
6
investment outlays. For 119 developed and developing countries during the period of 1974 to 1989, they find a negative relationship between government consumption and growth, but a clear positive link between public investment and growth.
When we focus on most recent studies, conflicting results still continue to be found. One of the recent papers by Schaltegger and Torgler (2006) suggests that large public expenditure lowers growth for high-income countries. Folster and Henrekson (2001) suggest that the more the econometric problems that are addressed, the more robust the link between government size and economic growth gets, while Agell, Ohlsson, and Thoursie (2006) object to this finding, indicating that there is no robust relationship between growth and the share of government expenditure. In his paper, Park (2006) tests whether the combination of productive public investment and lower taxes increases growth and whether current government consumption and higher taxes lower it. He cannot find any robust empirical results using a set of countries combining both developed and developing countries. Gupta, Clements, Baldacci, and Mulas-Granados (2005) show that government expenditure, especially its capital component, has a positive impact on growth for low-income countries when it is combined with a lower budget deficit. Baldacci, Clements, Gupta, and Cui (2008) indicate that, with explicit control for governance, and incorporation of nonlinearity, both education and health spending support higher growth in developing countries. Segura-Ubiergo, Simone, Gupta, and Cui (2009) present a positive impact of fiscal adjustment on growth in transition economies. Wahab (2004) and Colombier (2009), focusing on OECD countries, and Ang (2009), studying the case of Malaysia, all support the significance of public capital expenditure for growth.
Even when the papers that use empirical specifications or estimation techniques similar to ours are investigated, conflicting empirical results continue. Kneller, Bleaney, and Gemmell (1999) and Bleaney, Gemmell, and Kneller (2001), including 22 developed countries, support Barro (1990): productive expenditure is good for growth, but distortionary taxes lower its impact. Bose, Haque, and Osborn (2007) introduce government financing variables (government budget surplus/deficit and tax revenue) in a study where they focus on a panel of 30 developing countries over the 1970s and 1980s. They find that while the capital component of government expenditure, especially education expenditure, is positively linked to growth, the current component does not have any significant impact on economic growth. Similarly, Ghosh and Gregoriou (2008) and Benos (2009) take account of the revenue side of the government budget constraint considering tax and non-tax revenues, and also the government budget balance. Both papers use a GMM technique for panel datasets. But, they find conflicting results. Benos (2009) show that a reallocation of the components of government spending, especially toward infrastructure and human capital, can enhance growth using 14 European Union countries, while Ghosh and Gregoriou (2008), for a group of 15 developing countries, show that the current component of spending has a positive impact on growth while the capital component influences it negatively.
While most empirical studies in the literature use a heterogeneous sample of countries to investigate the relationship between government spending and growth, Moreno-Dodson
7
(2008) includes only fast-growing developing countries and shows that the link between total public spending and growth is overall positive with some components of public spending being particularly significant in affecting growth. For this group of countries,
unproductive components of public expenditure are less significant9—or even have a
negative impact on growth—while the productive component of public spending is
statistically significantly.10
Our paper extends this initial empirical study in a way to answer the question of whether the findings presented in the literature are sensitive to country sample selection bias. We try to accomplish this goal by extending the initial data set and including a mix of countries with different growth performances.
III. DATA AND COMPARATIVE ANALYSIS
The section explains the data sample and summarizes comparative analysis.
III.1. Data
Two sets of countries are included in the analysis. The first group consists of the seven fast-growing developing countries. The second set includes countries with less consistent
and more volatile growth performance patterns.11 The regression period is 1970-2005.12
The main data source is the Government Financial Statistics (GFS) of the International
Monetary Fund (IMF).13
III.2. Comparative Analysis
This section investigates some country facts and findings, and compares different country characteristics on public expenditure and growth that may be helpful when interpreting the subsequent econometric results.
First, when the growth rates of GDP per capita are compared for these two groups of countries, it can be seen that, by definition, in the first set, countries have grown much faster on average between 1970 and 2005 (see Tables 1 and 2). While this group has almost 5 percent growth rate on average, the second group has a mean growth rate of 1.6 percent. As can be seen in Figure 1, the first group outperforms the second set of countries throughout the period of 1970 to 2005 except during the Asian financial crises of 1997-98, and the years 2004 and 2005 thanks to high growth performance of countries like Turkey, Uruguay, and Venezuela in the comparison set.
9
Defined a priori using the definition by Bleaney, Gemmell, and Kneller (2001); and Kneller, Bleaney and Gemmell (1998 and 1999).
10
Similarly, Rogers (2008) shows that the impact of public schooling expenditures on economic growth is significantly higher in countries that are using schooling productively.
11
The list of countries in the fast-growing set and the comparison set is given in the introduction section.
12
The time period may change slightly from one country to another depending on data availability at the country level.
13
Details on variables and data sources are presented in the Appendix to this paper as well as in Moreno-Dodson (2008).
8
A simple measure of productivity, real GDP per worker (i.e. ratio of GDP to labor force), is calculated to understand possible differences between the two groups of countries. Figure 2 compares the average productivity in the two groups between 1980 and 2005. While the productivity level of the second group of developing countries has been almost flat, the fast-growing countries exhibit increasing productivity levels and, as a result, the level of productivity for this group passes the one in the comparison group after 1990. The gap between the two groups continues to grow wider throughout the decades.
Together with increasing productivity in the fast-growing countries, we see that the share of industrial production has also increased over time. Figure 3 summarizes changes in the value added activities in the industrial sector for these two groups. While the share of industrial production is increasing and stays stable right above 40 percent of GDP for the first group, this share drops from 37 percent to around 30 percent of GDP after 1990 in the second group of countries.
The second column of Tables 1 and 2 gives information about the size of public spending as a share of GDP in the two groups of countries. While there are no sensible differences in the size of the government budget between the two groups, an upward trend is observed in the second group in recent years. For example it jumped to 33 percent in Turkey on average between 2000 and 2005 and 31 percent in Uruguay.
Other than these trends, with the exception of Botswana, all countries in our sample have managed to keep a relatively small size of total public spending, which is below 30
percent of GDP,14 with the exception of Botswana at 38 percent. On the other side,
Singapore in the first sample, and the Philippines and Mexico in the second, managed to keep the share of government expenditure in GDP relatively stable and at low levels throughout the period analyzed. While Singapore has 18 percent public spending in percent of GDP on average, Mexico and the Philippines have 17 and 16 percent respectively.
Regarding the budget deficit, we observe that it is slightly larger for the comparison group (-1.9 percent of GDP on average) than the one for the fast-growing countries (-1.3 percent).
When we compare, in Tables 1 and 2, the share of productive expenditure in total public
expenditure, a priori according to the definition of Bleany, Gemmell, and Kneller (2001),
we can see that the share is significantly higher for the first group of countries (64 percent), while it is only 50 percent for the second group throughout the period included
in the study.15 The other interesting observation is that this share tends to decline
significantly for the second group (see Figure 4) especially after 1980. Thus, the gap
14
The definition used here refers to the consolidated central government only, which includes the central government plus all government entities associated to it, and excludes all public spending at sub-national level since it was not feasible to construct a reliable database for the consolidated general government including all countries in the sample.
15
Productive expenditure is defined as the sum of general public services expenditure, defense expenditure, educational expenditure, health expenditure, housing expenditure, transportation and communication expenditure. See, for example, Bleaney, Kneller, and Gemmell (2001).
9
between the shares of productive expenditure in the two groups increases significantly as time goes on, despite the fact that they were relatively close during the mid to late 1970s. Tables 1 and 2 also compare the share of “core” public spending, which is introduced in this paper as an alternative definition. This classification may be more appropriate for some developing countries, as it includes public spending in energy and fuel which is often closely interlinked with other critical spending categories and can affect
significantly their overall impact on growth.16 The share of “core” spending in total
expenditures is somehow different in the two groups, but only 4 percentage points higher, on average, in the fast-growing set. In the tables, it can be also seen that the share of “core” items is close across some countries in each group with the exception of Uruguay in the comparison group and Korea in the fast-growing group which have relatively lower shares, and Botswana in the fast-growing group and Costa Rica in the comparison group which have higher shares.
The second panel of Figure 4 aggregates the share of “core” spending throughout the entire time period in the two sets of countries. In the figure, it can be observed that the share of “core” spending is significantly declining in the comparison group after 1985, while it is relatively stable in the fast-growing group. As a result, the gap between the two groups is getting larger overtime.
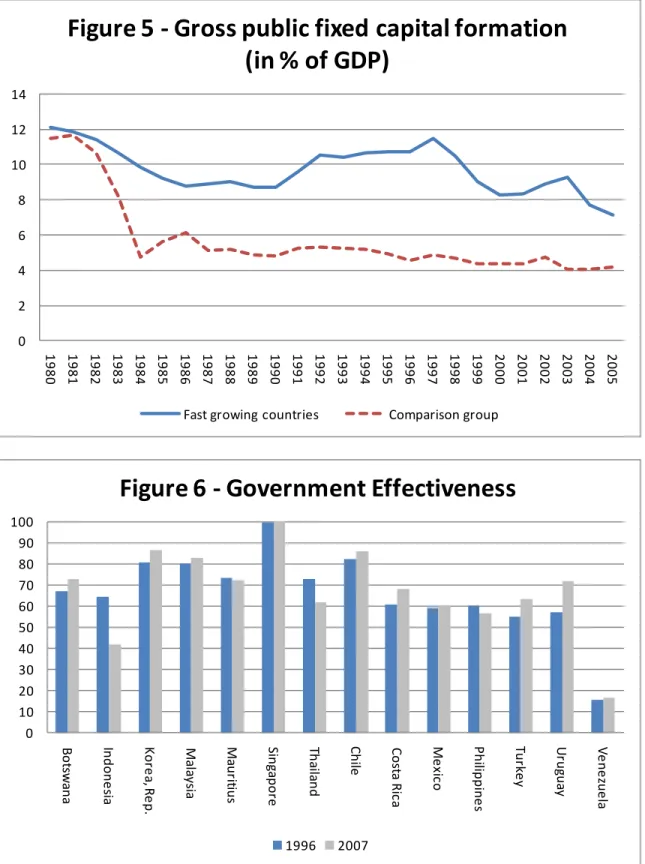
Another major difference that can help us explain, a priori, the gap between growth performances of the two groups of countries may be in the shares of public gross fixed capital formation as percent of GDP. Indeed, Figure 5 clearly shows that public investment is much larger in the fast-growing countries. The share of public investment in GDP is around 10 percent for the first group of countries, while it is only 5 percent for the second group. Given the significance of public investment, especially its infrastructure component, in economic growth, this difference between the two groups is striking.
Possible differences between the two groups may also be associated with government effectiveness and quality of governance. Figure 6 presents the percentiles for government
effectiveness.17 The figure shows that, in terms of government effectiveness, all countries
in the first group (with the exception of Indonesia) rank more favorably in comparison with the second group. When we investigate their position (last seven countries in Figure 6), we can see that the percentiles are much lower at around 60, with the exception of
Chile, which has a government effectiveness index above 80.18 In the whole sample of
16
The other difference between this definition and the previous one is that it excludes defense spending, a sector whose a priori impact on the private sector production function is less well known by economists. “Core” spending includes general public services expenditure, educational expenditure, health expenditure, housing expenditure, transportation and communication expenditure, and expenditure on fuel and energy.
17
According to the Kraay, Kauffman and Mastruzzi (KKM) indicators, government effectiveness measures the quality of public services, the quality of the civil service, the degree of its independence from political pressures, the quality of policy formulation and implementation, and the credibility of the government’s commitment to such policies.
18
KKM indicators using a (0-100) percentile rank, World Bank. It should be noted that 1996 is the earliest year in the database.
10
countries, Singapore enjoys the highest government effectiveness index. At the other extreme, Venezuela’s government effectiveness is in the bottom 16 percentile. Similarly, Figure 7 shows the differences in the bureaucracy quality between the two groups. The gap between the two groups is obvious although it has gotten smaller in recent years.
IV.EMPIRICAL SPECIFICATION AND ECONOMETRIC METHODS
The section introduces the empirical specification and the econometric techniques used to estimate the coefficients of the specifications.
IV.1. Basic Empirical Specification
The empirical specification used in the analysis is similar to the one presented in Moreno-Dodson (2008). We add new techniques to control for possible differences between the two groups of countries in order to better understand the impact of public expenditure and its components on growth. We also introduce nonlinearities in some specifications.
The basic panel regression equation is run separately for the fast-growing and the
comparison group as well as for the pooled dataset:19
CPIINF b FS b PE b FR b HC b p b y b yˆit 1ˆit1 2 it 3 i 4 it 5 it1 6 it 7 where:
i is the country index,
t is the year index,
yˆ is the rate of growth of GDP per capita,
p is the ratio of private investment to GDP,20
HC is the initial human capital index,
FR is the ratio of total fiscal revenues to GDP,
PE is the ratio of total public expenditures to GDP in period t-1,21
19
Detailed explanation of the logic behind the specification is presented in Moreno-Dodson (2008).
20
In some regressions, openness is used as a control variable instead of the private investment-to-GDP ratio.
21
Unlike other studies testing only the impact of public investment on growth while ignoring current spending, this analysis includes total public spending, capital and current, without specifically separating them. The rationale for this decision is based on the evidence that some categories of current spending items are indeed critical to ensure the profitability of investments. For example, operations and maintenance expenditures, which are considered as current spending items, are critical to ensure the
11
FS is the ratio of the fiscal balance (deficit or surplus) to GDP,
CPIINF is the inflation rate,
and b1, b2, b3, b4, b5, b6, and b7 are the coefficients assigned to the independent variables.
The government budget constraint is considered in the specification by including revenues, expenditures, and the fiscal balance. The empirical specification introduced in the paper includes the government budget constraint to avoid biases associated with incomplete specification ignoring financing options of governments and budget balance,
in line with other recent papers in the literature.22
Due to the inclusion of the budget constraint in the regressions, we excluded some expenditure items named as “other expenditures” (most of them non-classified or classified as “others”) to prevent any multicollinearity problem. We also include the lagged value of public spending since we believe there is a time lag between its execution and its impact on growth. In some specifications, total fiscal revenues are disaggregated into tax and non-tax revenues.
IV.2. Empirical Specification Capturing the Classification of Public Expenditure
Total public spending is disaggregated using a definition based on Bleaney, Kneller, and Glemmell (2001), and Kneller, Bleaney and Gemmell (1998), which classifies public
spending as productive versus unproductive components (a priori). As noted by these
authors, government spending items are classified according to whether or not they are
expected to be relevant for the private sector production function.23 They are classified as
productive if they are expected to impact the private sector’s production function.24 If not,
they are named as unproductive, meaning that government financing in those sectors is
expected to be less relevant for the decision-making of private investors:25
Productive expenditure: General public services; Defense; Education; Health; Housing; and Transportation and communication.
profitability of infrastructure investments since they can facilitate access and prevent accidents, permitting citizens to arrive safely to markets, schools, hospitals or any other destinations. Similarly, salaries of teachers, usually classified under the current spending rubric, are closely connected to the quality of education provided. In addition, it would not be realistic to try and isolate public investments completely since in many countries capital budgets include de facto, explicitly or implicitly, salaries and current spending items.
22
See Bose, Haque, and Osborn (2007), Ghosh and Gregoriou (2008) and Benos (2009).
23
See Barro and Sala-i-Martin (2003).
24
See Section V.3 for a slightly different classification that includes energy and excludes defense from productive spending.
25
It should be noted that all types of spending items classified as productive may not be fully productive. But, due to the lack of detailed, cross-country data on spending items, we need to execute this way of classification.
12
Unproductive expenditure: Social security and welfare; Recreation; Fuel and energy; Agriculture, forestry, fishing and hunting; Mining and mineral resources; Manufacturing and construction; and Other economic affairs and services.
In this case, the empirical specification becomes:26
; Pr
ˆ
ˆ b1y 1 b2p b3HC b4FR b5 oExp 1 b6UnproExp 1 b7FS b8CPIINF yit it it i it it it it
where ProExp is the productive expenditure in percent of GDP and UnproExp is the
unproductive expenditure in percent of GDP.27
IV.3. Empirical Specification Capturing Differences in the Two Groups of Countries
In an alternative empirical specification which is used with the pooled dataset which includes all countries in the study, interactive dummy variables are introduced to capture possible differences between fast-growing countries and the comparison group:
1 6 1 5 4 3 2 1 1ˆ * * ˆit b yit b pit b HCi b FRit b DFAST PEit b DCOMP PEit y CPIINF b FS b7 it 8 where:
DFAST is the dummy variable which is 1 for fast-growing countries and 0 otherwise,
DCOMP is the dummy variable which is 1 for the other countries and 0 otherwise.
The multiplication of these dummy variables with public expenditure produces the interactive variables that capture the possible impact of public expenditure on growth for the two separate groups.
IV.4. Nonlinear Empirical Specification
In a dynamic setting and using recent econometric techniques, we also try to estimate possible nonlinear effects of public expenditure on growth in fast-growing countries
versus the comparison group.28 The nonlinear empirical specification with and without
interactive dummy variables capturing group effects is:
; ˆ ˆ b1y 1 b2p b3HC b4FR b5PE 1 b6PE2 1 b7FS b8CPIINF yit it it i it it it it 26 See Footnote 22. 27
Alternatively, we also use “core” and “non-core” spending in the regressions for robustness check.
28
As specified by Barro (1990), and as discussed earlier, the nonlinearity in the impact of public expenditure on growth can be significant to understand the link between these two variables.
13 CPIINF b FS b PE DCOMP b PE DCOMP b PE DFAST b PE DFAST b FR b HC b p b y b y it it it it it it i it it it 10 9 1 2 8 1 7 1 2 6 1 5 4 3 2 1 1 * * * * ˆ ˆ
where the square terms of total, productive, or “core” components of government
expenditure capture the nonlinearity.29
IV.5. Econometric Methodology
Three alternative econometric methods for panel data are used (OLS, SURE, and GMM)
and their results are then compared.30 For each empirical specification, the first sets of
results are obtained using OLS and/or SURE methods. Then, a dynamic panel technique (GMM) is applied and the results are compared with those obtained with the static panel
regressions. In the empirical analysis, annual data are used, thus basically the focus is on
the short-term growth impact of government spending.31, 32
OLS and SURE methods are based on the assumption that the right-hand-side variables are exogenous. But it is quite likely that these variables may not be because they can be determined by each other, or by the growth rate, or by other variables that are not controlled for in the empirical specifications. The GMM dynamic panel method is used to allow for a more rigorous treatment of the endogeneity of public spending with respect to
growth in order to have more reliable and precise results.33 More specifically, we use a
two-step GMM methodology which requires taking the first differences of the variables. Since a set of instrumental variables is introduced with the GMM technique, it helps us control for possible endogeneity among regressors.
In the regressions, the set of instruments consists of lagged values of dependent and independent variables. The complete set of instrumental variables is:
the second and third lags of the growth rate of GDP per capita, initial human
capital (or initial life expectancy or initial GDP per capita),
29
The dummy variables (DFAST and DCOMP, as defined above) control for the group effects. Of course, there could also be nonlinearities related to other variables, most particularly private investment or differences in inflation; it could be, for instance, that countries in the fast-growing group also have higher rates of private investment and better macroeconomic policies. However, given the size of our sample, and the issue at hand, we limit ourselves to studying nonlinearities associated with government spending.
30
See Moreno-Dodson (2008) for a detailed description of the three methods.
31
The SURE methodology used in the paper is a type of OLS technique which can be estimated to account for various patterns of correlation among the residuals.In the paper, the variance structure introduced by the SURE methodology is cross-section specific heteroskedasticity. This methodology is used to check whether or not our results with ordinary least square change when we introduced cross-section specific heteroskedasticity, given that the countries in the data set are expected to have different characteristics.
32
For robustness check, we also run the empirical specifications with 3-year moving averages (medium-term impacts). Table A2 in Appendix reproduces Table 5 with 3-year moving averages instead of annual data. This table confirms the robustness of the initial regression results.
33
The dynamic general method of moments (GMM) was introduced by Arellano and Bond (1991). As indicated in the next section, OLS and SURE methodologies produce similar results, and GMM confirms most of them.
14
the first, second, and third lags of private investment in percent of GDP,
the second and third lags of tax revenue, total public expenditure or
productive expenditure, unproductive expenditure, all in percent of GDP,
the first, second, and third lags of other revenue and budget balance, all as a
share of GDP, and
the first and second lags of the inflation rate.
V. REGRESSION ANALYSIS
Each empirical specification introduced in the previous section is run in four different settings, using the three econometric methods defined in the previous section. The first set of empirical estimations presented in the first column of the tables is for fast-growing
countries.34 The second set of results (see the second column of the tables) is for the
comparison group. The third set of results, presented in the third column of the tables, is obtained by combining the two groups of countries in a panel data setting. Then the fourth set of results, as presented in the last column of the tables, is obtained again by not only combining all countries in a single dataset, but also introducing interactive dummy variables for public expenditure to control for possible group effects.
The overall results suggest that total public spending, especially its productive and “core” components, has indeed a statistically significant, positive impact on the GDP per capita growth rate for fast-growing countries, while a similar link cannot be established robustly for the comparison group.
V.1. Linear Regression Results
1.1Total Public Spending
The linear regression specifications involve public spending and its components as percent of GDP, ignoring any higher order variables. First we include total public spending in the regressions. One common finding is that the differences in the size of estimated coefficients for the fast-growing group versus the comparison group, as well as their level of statistical significance, are both large.
Table 3 presents the first set of results obtained with both OLS and SURE methodologies. For the fast-growing countries in our dataset (first two columns in Table 3), all the estimated coefficients of government budget components including public spending are statistically and economically significant determinants of economic growth at 1 percent significance level. Both OLS and SURE results produce the same results. However, we do not see similar results for the comparison group (columns 3 and 4 in Table 3). Only the budget surplus has the expected positive sign and is statistically significant at the 5 percent level. The impact of public spending on GDP per capita growth is positive, but
34
It should be noted that these first sets of results are the ones also presented in Moreno-Dodson (2008) since we use the same fast growing countries in our analyses.
15
the coefficient is not significant using neither OLS nor SURE methodologies. Similarly,
total fiscal revenue as a share of GDP does not have any significant impact on growth.35
When we compare the magnitudes of the coefficients, they are much larger for the first group, indicating the importance of budget components on economic development. For example, a 1-percentage increase in the public spending to GDP ratio leads to almost half a percent increase in GDP per capita growth rates for the fast-growing group, while the same increase in spending causes only a 0.04 percent increase in GDP per capita growth in the comparison group.
Although the focus of this paper is on the link between public spending and growth, it is also critical to acknowledge the contribution of private investment. As indicated in Table 3, the empirical results state that private investment is significant only for the fast-growing group.
Similarly, inflation, which is included to capture the impact of macroeconomic stability on growth, is a statistically significant determinant of growth (with a negative coefficient) only for the fast-growing group.
The other interesting result is that when we combine the two sets together, the economic and statistical significance of total public expenditure in determining growth drops substantially. Columns 5 and 6 of Table 3 show the results when two country groups are combined in one dataset. In this case, the coefficient of total public spending is significant only at 10 percent and only with the SURE methodology. The magnitude of the coefficients is much smaller compared to the ones produced only for fast-growing countries (columns 1 and 2 in Table 3). Other components of the budget – fiscal revenue
and budget surplus – are significant at 10 and 5 percent, respectively.36 Private
investment continues to have a statistically significant coefficient at the 1 percent level. These results lead us to interpret that when more heterogeneous countries (in terms of their growth performance) are all included in the dataset, the significance of public spending and other budget components drops. This may partially explain why some empirical studies in the literature mixing countries with very different growth patterns cannot find a statistically significant link between government spending and economic growth. In other words, in order to avoid parameter bias in cross-country regression results, distinguishing “clusters” by either specific growth characteristics and performance, or more formal pooling tests, can be critical.
As explained in the empirical specification section of the paper, the interactive dummy variables are introduced to capture the possible differences between the two groups in terms of the impact of public expenditure on growth when the two groups are combined in one set. The interactive dummy variable for the fast-growing countries (DFAST ×
35
The lack of significance or robustness of the initial human capital variable may be due to the fact that the indicator that we use does not capture quality differences well across countries and over time; see Rogers (2008) for a more detailed discussion.
36
16
public spending) has an economically and statistically significant coefficient at 5 percent with OLS, while the similar interactive dummy variable for the comparison group leads to a lower estimated coefficient and statistical significance (see columns 7 and 8 in Table 3).
The results in this setting clearly suggest that the impact of total public expenditures on growth is much more significant for fast-growing countries, after controlling for other variables and budget components.
The estimated coefficients using OLS and SURE methodology are confirmed also by a dynamic GMM methodology as presented in Table 4. Total fiscal spending is again a statistically and economically significant determinant of growth for the fast-growing group (see column 1). Inflation also has the expected sign and statistically significant coefficients at 1 percent level. Openness, which is included to capture possible effects of private sector transactions on growth through exports and imports (instead of private investment), and is expected to have a positive impact on growth, has indeed a
statistically significant coefficient at 1 percent level.37
None of the variables are statistically significant in the case of the comparison group, except inflation (see column 2). Total public spending even has an unexpected negative impact on growth, but it is not statistically significant. The insignificant coefficient of openness for the comparison group again shows that exports and imports are not successful in explaining growth in those countries.
When the two sets are combined, the significance of total public spending in determining growth disappears and the sign of the variable even turns negative. But when the group effects in the combined data setting are controlled with the interactive dummies of total fiscal spending, it can be seen that the fast-growing group has a statistically significant public spending impact on growth, while the influence of public spending on growth in the comparison group is negative (see column 4).
1.2. Expenditure Classifications: Productive versus Unproductive
The remaining question is how the impact of different components of public spending on growth varies in these two groups of countries. The first classification of public spending
considers productive versus unproductive public spending, a priori, as explained in the
previous section.
According to this definition, the productive component of public spending is expected to have a higher impact on growth when compared to the unproductive component. When we focus on fast-growing countries, the result is confirmed (column 1 in Table 5). In an empirical specification where we control for some macroeconomic variables and lagged value of growth, fiscal revenue and budget balance, productive public spending has a
37
In each GMM specification, we include openness instead of private investment since this variable produces better results.
17
higher impact on growth in the fast-growing group, while it has a negative but insignificant impact for the comparison group (compare columns 1 and 2 in Table 5). Column 3 of Table 5 shows that productive expenditure gets insignificant in explaining growth in the pooled sample, again illustrating the caveats of pooling a disparate group of developing countries. The estimation result with the interactive dummies for the two groups, as presented in column 4 of Table 5, also supports the previous findings: the coefficient of the interactive dummy variable for productive expenditure in the fast-growing group is statistically significant at 1 percent, while the one in the comparison group is not significant.
The estimation results based on the dynamic GMM technique are given in Table 6. Since they are similar to the previous results obtained with the panel OLS methodology (Table 5), we conclude that the findings are robust across different econometric methods. Again, for fast-growing countries, productive public spending has a positive and statistically
significant impact at 10 percent on growth.38 The sign of the non-productive component
for the fast-growing group becomes negative in the GMM specifications, but it does not
have any statistically significant influence on growth.39 Openness continues to have a
statistically significant impact on growth at the 10 percent level.
The comparison group, on the other hand, does not present any significant coefficient for any component of government spending. The unproductive component of government spending continues to produce statistically insignificant coefficients.
When we combine the two groups in one set, the sign of productive public expenditure is positive and its significance is close to 10 percent. The unproductive component turns out to have a statistically significant, negative sign in the GMM specification. When we separate the effects of two groups in the combined dataset with the interactive dummy variables (Column 4 in Table 6), it can be seen that the positive impact of productive public spending on growth in the combined set is confirmed only for the fast-growing country group, as it was the case with OLS.
V.2. Nonlinear Regression Results
As argued by Barro (1990, 1991), the link between public spending and growth is expected to be positive when the size of government is small, but it may become negative
as the size gets larger.40 To capture nonlinearity, an additional explanatory variable is
introduced in the specification: either the squared value of total public spending or the squared term of productive public spending. First the OLS panel regression methodology
38
This significance is lower than the one reported in Table 5.
39
It was positively significant at 10 percent in Table 5 which is based on the OLS technique.
40
There are many other papers focusing on a possible nonlinearity between government spending and growth. In addition to Barro (1990 and 1991), Grossman (1988) examines a nonlinear relationship between growth in the size of government and overall growth in the economy. When compared with previous studies, we focus on the nonlinear analysis, considering a dynamic setting where the overall budget constraint is also taken into account.
18
is used to test nonlinearity. Then we also use the dynamic GMM methodology to confirm the results.
Table 7 presents the coefficients estimated by the panel OLS methodology, where total public spending is considered. In none of the specifications, neither total public expenditure nor its squared term has a statistically significant effect on growth. This result is consistent across the two country groups as well as for the combined set. When we control for the group effects with the help of the interactive dummy variables in the combined set, not much difference is observed. These findings do not change with any alternative econometric technique. Table 8 shows the same specifications estimated this time with the GMM technique. The results are robust: total public expenditure and its squared term again are not significant in any column of Table 8.
As presented previously, the empirical results in the linear setting suggest that some components of public spending are more influential in determining the growth rate of GDP per capita. Thus, we expect that the inclusion of those components of public spending instead of total public spending can matter in the nonlinear setting as well. Table 9 shows the estimated coefficients with the level and the squared value of productive public expenditure, calculated using panel OLS estimation technique. As it was the case before, the productive component of government spending is a statistically significant determinant of the growth rate of GDP per capita only for fast-growing countries. The squared value of productive expenditures has a negative sign, but it is not statistically significant. Table 10, which uses the GMM estimation technique, confirms the results presented in Table 9. Similarly, the productive component is significant only for fast-growing countries, while the squared value of this variable is not statistically significant in any case.
Overall the results based on the nonlinear specifications do not identify any nonlinearity between either total public spending, or its productive component, and economic growth.
V.3. Robustness Check of the Classification of Public Spending
The inclusion of defense spending item in the a priori definition of productive public
spending raises some important questions in the context of developing countries. There is still a controversy in the literature on whether defense spending promotes economic growth. For example, Benoit (1973 and 1978) explains that defense expenditures can increase growth through providing education and health services to staff in the military, lowering unemployment, engaging in public works, and increasing scientific and technological innovations. It may also promote growth by providing a more secure environment for private investors. However, another group of papers, such as Biswas and Ram (1986) and Looney and Frederiksen (1986), argues that the relationship between defense spending and growth is not robust across different countries.
Since we, as economists, do not have any knowledge of the defense sector and in order to test the robustness of the empirical results to alternative classifications, we rerun our regressions using an alternative definition named as “core” spending which excludes
19
defense spending from the a priori definition of productive public spending and, instead,
includes public expenditures on fuel and energy, which are proven to be critical for growth in most developing countries, and often influence decision making by private investors.
“Non-core” spending includes social security and welfare; recreational, cultural and religious affairs; agriculture, forestry, fishing and hunting; mining and mineral resources, manufacturing and construction; and other economic affairs and services.
Defense spending is added to “other” public spending and therefore excluded from the regressions, given our lack of knowledge of the sector.
Table 11 shows the empirical results with this alternative definition of a priori “core”
public spending. When we compare the results in Table 11 with the ones in Table 5, we can see that the original results are robust. The “core” spending is again a statistically and economically significant determinant of growth only for the fast-growing group. It is not significant for the comparison group, or when we pool all countries together. Moreover,
this robustness test leads us to conclude a posteriori that “core” public spending is a
positive determinant of growth in the group of fast-growing countries.
Table 12 presents the estimated coefficients calculated, this time using the GMM methodology in the previous sections. The results are consistent with the ones presented in Table 11. The “core” component of public spending is significant only for the fast-growing group. Similarly, openness is statistically significant only in this group. The inflation rate consistently produces a negative and highly significant coefficient in each specification.
The nonlinear results presented in the previous section are also robust to the new definition of “core” spending (Table 13). Again, the nonlinear term, the squared term of “core” spending, does not have a statistically significant coefficient in any specification and the linear term of “core” spending is statistically significant only for the fast-growing countries. This indicates the absence of the nonlinear relationship between growth and public spending in our dataset.
VI. CONCLUSIONS
The main purpose of this paper is to empirically investigate the link between GDP per capita growth and public spending components with the help of a panel dataset where developing countries are classified in two groups according to their GDP per capita growth rates for over three decades: fast-growing countries and a comparison group including a mix of countries with different growth patterns (a lower growth rate on average and more volatile growth paths).
The main result of the study is that the influence of public spending on economic growth is clearly different between the two groups, even though the size of government,
20
explanation may be found in the composition of public expenditure. The fast-growing group has higher shares of productive and “core” public expenditure on average. They
also have higher productivity ratios and better governance indexes.41
A posteriori, for the fast-growing countries, both productive and “core” components of public spending consistently have a joint positive and statistically significant impact on economic growth, after controlling for macroeconomic and private sector variables, initial conditions of countries, and other budget components. This statistically significant effect cannot be established in a robust fashion for the comparison group. Our results are consistent with several other studies focusing on developed and developing countries,
such as Bose, Haque, and Osborn (2007), and Benos (2009).42
In addition to the differences that we observe in the response of growth to the composition of public spending between the two groups of countries, we also find differences in the impact of macroeconomic stability and the private sector on growth. Inflation is negatively correlated with growth mainly for the fast-growing group and the combined set, indicating that reducing inflation leads to faster growth for these countries and therefore growth is more responsive to improvements in macroeconomic stability. The two alternative control variables used to capture private sector influence, private investment and openness, tend to have higher significance in explaining growth for the fast-growing group, which points out to the existence of an economic policy environment
more conducive to growth and a strong contribution from the private sector.43
Based on these results, we can say that after taking into account the negative effects of taxation (which raises public funds needed for its financing), public spending has a positive impact on growth through its productive and “core” components, in a policy environment where private sector investment, openness and macroeconomic stability are also conducive to growth.
When we combine the two groups of countries in the regression analysis, the link between government spending and growth gets weaker or disappears. In these regressions, when we control the group effects by interactive dummy variables, it can be seen that only the fast-growing panel produces a positive and statistically significant link between both the productive and “core” components of public spending and growth.
41
Due to data limitations, we could not explicitly include governance variables in our regression, but some simple data analysis based on available data indicates that the quality of governance (as measured by government effectiveness and bureaucracy quality) is consistently higher for the fast-growing group. Thus, we believe that the group effects that are introduced in the empirical specification partially capture the quality of governance.
42
For dissenting results, however, see Ghosh and Gregoriou (2008).
43
As a possible research idea for future work, it would be interesting to explore the complementarity existing between public spending and public sector investments. Based on qualitative assessments, in the fast growing it is observed group that private sector investments played a critical role in determining and sustaining high growth rates and also in triggering an appropriate response from the public sector in order to adapt to and complement private investors.
21
Our overall conclusion therefore is that public spending can be a significant determinant of growth through its productive and “core” components, which are also likely to impact the production function of the private sector. Another outcome of the analysis is that inconsistent results in previous empirical analyses that linked public spending and economic growth may be explained by the selection of countries included.
These results have important implications for the current debate about the design of fiscal rules in a growth context. Many developing countries, under a “Golden Rule” approach, are trying to maintain a balance or surplus in their current spending budget while capital
spending is being financed increasingly by borrowing.44 In addition to the creative
accounting, negative incentives and budget fragmentation distortions that this can
trigger,45 this rule does not take into account possible interactions among sectoral
categories of public spending regardless of whether they correspond to capital or current items.
Our analysis indicates that, the bulk of public expenditures in productive and “core” sectors, which consist of a combination of current and capital spending on infrastructure, health, education, and other economic sectors that are critical for development, can have a significant joint impact on growth. For policy makers, this result implies that planning and executing public spending in those sectors in an integrated manner, taking into account inter-linkages among them and their current and capital components, should be conducive to growth.
It is important, however, to notice that, in order to be able to draw recommendations regarding the composition of public spending at the country level in connection with growth, the conclusions of this cross-country study should be followed by additional individual country empirical studies which should consider country specific characteristics affecting the public spending composition as well as other determinants of growth.
The definitions of productive and “core” spending suggested in this paper should be, therefore, tailored and adapted at the individual country level. For example, in a country where agriculture still represents a high percentage of total GDP, public spending in
irrigation, rural infrastructure, and rural energy should be considered a priori as “core”,
while in other countries heavily dependent on exports of mineral products and energy,
public funds allocated to that sector should be included a priori in the “core” spending
group.
44
More precisely, under the Blanchard-Giavazzi rule, governments should borrow in net terms on a continuous basis only to the extent that this net borrowing finances net public investment, that is, gross investment less capital depreciation (which counts as current spending). This rule therefore would allow gross borrowing for the purpose of refinancing maturing debt, thereby leaving net debt unaffected.
45
It is possible that some public investments, for example in hospitals or in schools, may be fully funded without the current expenses for staff, operations and maintenance. Given that these current expenses are essential to ensure the good functioning of capital goods, absence of such current expenditures complementing capital spending may result in a liability for the country in the end, with doubtful effects on growth.
22
REFERENCES
Agell, J., H. Ohlsson, and Skogmann Thoursie P., 2006, “Growth Effects of Government
Expenditure and Taxation in Rich Countries: A comment,” European Economic Review,
50, 211-18.
Agénor, Pierre-Richard, The Economics of Adjustment and Growth, Harvard University
Press (Cambridge, Mass.: 2004).
---, "Fiscal Policy and Endogenous Growth with Public Infrastructure," Oxford
Economic Papers, 60 (January 2008), 57-88.
Agénor, Pierre-Richard, and Blanca Moreno-Dodson, "Public Infrastructure and Growth: New Channels and Policy Implications," in Public Expenditure, ed. By Maura Francese, Daniele Franco, and Raffaela Giordano, Banca d'Italia (Rome: 2007); and WB Working Paper.
Agénor, Pierre-Richard, and Kyriakos Neanidis, "The Allocation of Public Expenditure and Economic Growth," Working Paper No. 69, Centre for Growth and Business Cycle Research, University of Manchester (March 2006).
Ang, James B., 2009, “Do public investment and FDI crowd in or crowd out private
domestic investment in Malaysia?” Applied Economics, 41, 913–919.
Arellano, M. and S. Bond, 1991, “Some Tests of Specification for Panel Data:
Montecarlo Evidence and Application to Employment Equations,” Review of Economic
Studies 58(2), 277-297.
Baldacci, Emanuele, Benedict Clements, Sanjeev Gupta, and Quing Cui, 2008, “Social
Spending, Human Capital, and Growth in Developing Countries,” World Development,
Vol. 36, No. 8, 1317–1341.
Barro, Robert J., "Government Spending in a Simple Model of Endogenous Growth,"
Journal of Political Economy, 98 (October 1990), s103-s25.
Barro, Robert J., "Economic Growth in a Cross Section of Countries,” Quarterly Journal
of Economics, vol. 106 (May 1991), 407-43.
Barro, Robert J., and Xavier Sala-i-Martin, Economic Growth, 2nd. ed., McGraw-Hill
(New York: 2003).
Benoit, E., 1973, Defense and Economic Growth in Developing Countries. Lexington:
23
Benoit, E., 1978, “Growth and defense in developing countries.” Economic Development
and Cultural Change 26(January): 271-280.
Benos, Nikos, 2009, “Fiscal Policy and Economic Growth: Empirical Evidence from EU Countries,” unpublished, University of Ioannina (September 2009).
Biswas, B. and R. Ram (1986) “Military expenditures and economic growth in less
developed countries: an augmented model and further evidence.” Economic Development
and Cultural Change 34(January): 361-372.
Bleaney, Michael, Norman Gemmell, and Richard Kneller, 2001, “Testing the Endogenous Growth Model: Public Expenditure, Taxation, and Growth over the Long
Run,” Canadian Journal of Economics, Vol. 34, pp.36-57.
Bose, N., Haque M.E., and Osborn, D. R., 2007, “Public Expenditure and Economic
Growth: A disaggregated analysis for developing countries,” The Manchester School, 75,
533-56.
Colombier, C., 2009, “Growth effects of fiscal policies: an application of robust modified
M-estimator,” Applied Economics, 41, 899–912.
Easterly, William and Sergio Rebelo, 1993, “Fiscal Policy and Economic Growth: An Emperical Investment,” Journal of Monetary Economics, vol. 32, no: 3, pp. 417-58.
Folster, Stefan and Magnus Henrekson, 2001, “Growth Effects of Government
Expenditure and Taxation in Rich Countries,” European Economic Review, vol. 45(8),
1501-20.
Ghosh, Sugata, and Andros Gregoriou, 2008, “The Composition of Government
Spending and Growth: Is Current or Capital Spending Better?,” Oxford Economic
Papers, 60 (June), 484-516.
Glomm, Gerhard and B. Ravikumar, 1997, “Productive Government Expendituers and
Long-run Growth,” Journal of Economic Dynamics and Control, vol. 21, No.1, 183-204.
Grossman, Philip J., 1990, “Government and Growth: Cross-sectional Evidenece,” Public
Choice Vol.65: 217-227.
Grossman, Philip J., 1988, “Government and economic growth: A nonlinear
relationship,” Public Choice vol. 56(2): 193-200.
Gupta, Sanjeev, Benedict Clements, Emanuele Baldacci, and Carlos Mulas-Granados, 2005, “Expenditure Compositio