INTERNATIONAL REAL ESTATE REVIEW
2009 Vol.12 No.3: pp. 221 – 251Inflation-hedging Behavior of a Securitized
Real Estate Market: Empirical Evidence
from Hong Kong
Wei-han Liu*
Department of Banking & Finance, Tamkang University, Tamsui Campus, 151 Ying-chuan Road, Tamsui, Taipei County, Taiwan 25137, Republic of China; Fax: 886-2-26214755; E-mail: weihanliu2002@yahoo.com
Zhefang Zhou
Department of Management Sciences, City University of Hong Kong
This paper examines the inflation-hedging behavior of the Hong Kong securitized real estate market between April 1986 and April 2007. The monthlyseriesoftheHangSengProperty Index(HSPI)is selected as the proxy of the Hong Kong securitized real estate market due to its comprehensive coverage and availability of rich data. We find that the vector autoregressive forecast error method, which is introduced by DenHaan(2000),outperforms the traditional linearvectorautoregressive model and vector error correction model techniques in depicting the comovement between the HSPI and inflation rate. The comovement estimates show a positive correlation between the HSPI and inflation rate in the short-term and a negative correlation in the long term which indicates that the Hong Kong securitized real estate market can serve as an inflation hedge in the short term, but becomes a perverse inflation hedge in the long run.This inflation-hedging pattern differs from those of its neighboring major East Asian markets. This study demonstrates that the inflation-hedging capability of securitized real estate is not a static issue, but rather, depends on the length of the forecast horizon.
Keywords
Inflation hedge; Comovement; Vector autoregressive; Model forecast; Error-based model; Securitized real estate
*
222 Liu and Zhou
1.
Introduction
Real estate has long been considered as an attractive investment product, partly due to its perceived inflation-hedging capability. Over the past decade, many pension funds have increased their real estate exposure to ensure that the returns,which are offered totheir members,rise with inflation(Hudson- Wilson et al. 2005). However, empirical studies on the relationship between the inflation rate and real estate returns have reported inconclusive results. It is commonly believed that real estate outperforms common stocks in terms of protection against inflation (Hoesli et al. 1997). Many studies agree that there is a long-term stable hedge relationship between property prices and inflation(Anari and Kolari 2002;Barkham and Ward 1996).Yet, this consensus holds only for cases that consist of non-securitized real estate(Bond and Seiler. 1998;Miles and Mahoney1997;Wurtzebach, Mueller, and Machi1991; Gyourko and Linneman 1988; Hartzell, Hekman, and Miles 1987;Sirmans and Sirmans1987;Brueggeman,Chen,andThibodeau1984);whensecuritized real estate is considered,mixed conclusions have been obtained for its inflation- hedgingcapability.Realestateinvestmenttrusts(REITs)usuallyserveasaproxy ofthesecuritizedrealestate.Ingeneral,theyarereportedtobehavelikecommon stocks and be insignificantly or negatively correlated with inflation (Ewing and Payne 2005;Lu and So 2004;LiuandHartzell 1997;Yobaccio,Ketcham, and Ketcham 1995;Park, Mullineaux,and Chew 1990; Titman and Warga 1989; Gyourko and Linneman 1988).Simpson,Ramchander,and Webb(2007),in contrast,document a positive relationship between REIT returns and the inflation rate.Asevident,even though the issue is fundamentally important to the real estate economy, the debate over inflation-hedging performance of securitized real estate remains unsettled.
In addition to thecontroversial resultsassociated with securitizedrealestate, we also find that previous studies are essentially constrained by two aspects in terms of their econometric techniques. First,it is difficult to believe that theco- movement between the inflation rate and real estate market willremain stable over time. Therefore, it is vital to differentiate between short-and long-run inflation-hedging performances when considering securitized real estate. However,of the numerous relevant studies in the literature,only that of Ganesan and Chiang(1998)addresses this issue.As for this study,the analytical framework can be improved insome aspects,which willbe discussed in the next section.Moreover,they use quarterly data for an 11-year period(1984-94); thus the data count may not be sufficient to reveal the steady patterns of inflation-hedging behavior. Secondly, the econometric techniques employed in most of the previousstudiesare primarilytimeseriesanalytical techniques, such as theunit root test,vector autoregressive model(VAR)approach,vector error-correctionmodel(VECM),and thelike.Thelimitationsof thesemodelsare often ignored,and thus theestimationoutcomesare not readilyaccessible to
interpretation.These methods and their respective limitations are discussed in Section 2 of this paper.
Ourstudyattemptstojointhedebateandprovidea comprehensive understand- ing of the capability of securitized real estate to hedge inflation.The Hong Kong market has been selected as the subject of study due to its special characteristics which are rarely seen worldwide. The relationship between the inflation rate and financial assets is less affected by monetary policies in Hong Kong than other countries.For example,the inflation rate has been independent of the exchange rate since 1983, when the Hong Kong Monetary Authority adopted the linked exchange rate system(at a fixed rate of HK$7.80=US$1.00) torestrict arbitrage,thus providing little freedom for the exchange rate to fluctuate.Accordingly,thelocalsecuritizedrealestatemarketislargelyimmune to exchange rate variations,and thus its inflation-hedging behavior will not be biased by the exchange rate.In addition,Hong Kong has alsoexperienced a number of major political and economic upheavals over the past decade,and both the lasting and transient shockwaves from these events have had short- and long-term effects on the real estate market.These features help to make the Hong Kong real estate market a special and interesting example to study. The econometric technique proposed by Den Haan(2000)is employed to examine the inflation-hedging behavior of securitized real estate from both the short-andlong-termperspectives.This approach is superior to other traditional methods because of its flexibility in depicting the correlations at different time horizons for both stationary and cointegrated series, and the estimation outcomes can be straightforwardly interpreted at arbitrary forecast horizons. Details of the methodology adopted are discussed in Section 3.
Our empirical results show that the correlations between the inflation rate and returns from the securitized real estate market are positive in the short-term and negative in the long-term. This interesting pattern helps to highlight the importance of differentiating between short- and long-run relationships and proper use of appropriate econometric technique. In the Hong Kong market, securitized real estate can behave as an inflation hedge in the short term, but it becomes a perverse inflation hedge in the long run. The neighboring markets (Singapore,South Korea,Taiwan,and Japan)show a different pattern and indicate that inflation hedge is a major long term consideration.Hence,this study contributes to the literature that the inflation-hedging capability of securitized real estate is not static, but rather contingent on the length of the forecast horizon. In other words, the dynamic aspects of the comovement between real estate returns and inflation rate have an important impact on the inflation-hedging performance of the securitized real estate.
The remainder of the paper is structured as follows. Section 2 provides a literature review of the inflation-hedging performance of real estate and the methodology used in previous studies. Section 3 introduces the econometric
224 Liu and Zhou
method proposed by Den Haan (2000) to estimate correlation coefficients at different forecast horizons.Section4 gives the details of the Hong Kong dataset used in this study.The outcomes of the empirical analysis are presented and discussed in Section5,and finally,the conclusions are summarized in Section 6.
2.
Literature Review
2.1. Inflation-hedging Behavior of Real Estate
The inflation-hedging performance of real estate has been one of the fundamental issues in the economics of real estate. The positive relationship between inflation and real estate returns receives consensus only for cases when unsecuritized real estate is considered (see, for example, Miles and Mahoney, 1997; Gyourko and Linneman, 1988; Hartzell et al., 1987; Sirmans and Sirmans, 1987; Brueggeman et al., 1984). When securitized real estate is involved,a variety of conclusions co-exist in the literature on its inflation- hedging capability. Table1 summarizes the main conclusions and adopted methodology of the representative studies.
As for securitized real estate,which is our research target, most of the previous studies state that there is a negative or an insignificant relationship between REIT returns and inflation (Ewing and Payne 2005; Lu and So 2004; Liu and Hartzell 1997; Park, Mullineaux, and Chew 1990; Titman and Warga 1989; Gyourko and Linneman 1988). Meanwhile, some researchers attempt to re- examines the perverse inflation-hedging behavior of securitized real estate. Simpson,Ramchander,andWebb(2007)study theasymmetricresponse of REIT returns to positive and negative changes in inflation and report that the returns rise in response to both increases and decreases in inflation. Glascock, Lu, and So (2002) investigate the causality effects among REIT returns, inflation, and monetary policies, and conclude that the negative correlation between REIT returns and inflation primarily attribute to the interaction of monetary policies with inflation.Ganesan and Chiang (1998) study the long- and short-run movements of the inflation-hedging behavior of both real and financial assets, and conclude that generally, financial assets in Hong Kong are a better hedge against inflation than real assets.
Although many studies have been conducted on the inflation-hedging performance of securitized real estate, no consensus is reached. In addition, they all treat the inflation-hedging behavior of real estate as a static issue, while ignoring the dynamic aspects of this comovement. It is suggested that the magnitude and sign of empirical correlations between macroeconomic variables may be different towards the length of forecast horizons (Den Haan, 2000). Inspired by this result,our study aims to contribute to the literature by exploring the inflation-hedging characteristics of securitized real estate from a dynamic perspective.
In fla tio n -h ed g in g B eh av io r o f a S ec u rit iz ed R ea l E st at e M ar k et 2 2 5
Table 1 Representative Studies on the Inflation-hedging Behavior of Real Estate
Paper Methodology Outcome
Panel A: Studies on inflation-hedging behavior of un-securitized real estate
Chen and Sing (2006) Vector autoregressive model Hedge against inflation
Bond and Seiler (1998) Added variable regression method Hedge against inflation
Miles and Mahoney (1997) Fama and Schwert’s framework (1977) Hedge against inflation
Wurtzebach, Mueller,and Machi(1991) Linear regression Hedge against inflation
Gyourko and Linneman(1988) Linear regression Hedge against inflation
Hartzell, Hekman,and Miles(1987) Fama and Schwert’s framework (1977) Hedge against inflation
Sirmans and Sirmans(1987) Literature review Hedge against inflation
Brueggeman,Chen,and Thibodeau(1984) Fama and Schwert’s framework (1977) Hedge against inflation
Panel B: Studies on inflation-hedging behavior of securitized real estate
Simpson, Ramchander, and Webb(2007) Linear regression REIT returns rise in response to both increases and decreases in inflation
Liow and Yang (2005)
Vector error-correction model, Fractionally integrated vector error- correction model
Securitized real estate and common stocks are fairly substitutable assets over the long run in Hong Kong and Singapore.
Ewing and Payne (2005) Vector autoregressive model Perverse hedge
Lu and So (2004) Vector error-correction model Perverse hedge
Glascock, Lu, and So (2002) Vector error-correction model The negative correlation betweenREIT returns and inflation primarily
attribute to the interaction of monetary policies with inflation.
Ganesan and Chiang (1998) Fama and Schwert’s framework
(1977),Cointegration technique
Financial assets in general are a better hedge against inflation than real assets in Hong Kong.
Liu and Hartzell (1997) Fama and Schwert’s framework (1977) Perverse hedge
Yobaccio, Rubens, and Ketcham (1995) Fama and Schwert’s framework (1977) Partial hedge against expected inflation and perverse hedge against
unexpected inflation
Park, Mullineaux, and Chew (1990) Fama and Schwert’s framework (1977) Perverse hedge
Titman and Warga (1989) Linear regression Perverse hedge
226 Liu and Zhou
2.2. Econometric Techniques Adopted in Studies
Although the inflation-hedging behavior of real estate has been widely investigated in the previous studies, the main econometric techniques that are adopted have their respective limitations.Chen and Sing(2006),and Ewing and Payne(2005),for example, use the VAR approach to investigate the inflation-hedging characteristics of residential property markets and REIT returns,respectively.The VAR fits linear and stationary series,but is inadequate for nonlinearorasymmetric phenomena.Structuralchangesinthecorrelation may exist,and thus the estimation of the number of regimes cannot be neglected(Strikholm and Teräsvirta, 2006).
VECM is good at depicting the short-term dynamics, but with limited lags. The picture at further lags needs complex calculation and the procedure is far from straightforward. Liow and Yang (2005) adopt both the conventional VECM and the fractionally integrated VECM (FIVECM), an improvement that is proposed by Lien andTse(1999),to investigate whether the securitized real estate and stock markets have long-term co-memories for short-term adjustment.However,the traditional VECM method allows only the first-order lag of the cointegration residuals to affect the long-term equilibrium relationship, and the FIVECM works well only when slow mean-reversion and significant long memory are present,characteristics which are not necessarily present in the data series.In short,VAR,VECM,and FIVECM have their respective limitations in application, and the estimate outcomes are confined to several lags and thus can hardlybe used to differentiate short-and long-term relationships.
Ganesan and Chiang(1998) implicitly assume that the short- and long-term dynamics are independent from each other and can be treated separately. They ignore the possible transmission between short- and long-term dynamics. The authors apply Fama and Schwert’s framework(1977) and the cointegration technique(Barkham and Ward 1996),respectively,to study the short- and long-run inflation-hedging characteristics of real estate returns in Hong Kong. Fama and Schwert’s framework is based on the ordinary least squares regression and has been heavily criticized for its assumptionof aconstant rate-of-returnandstationarityof the timeseries.For the long- term dynamics, the cointegration technique may produce spurious conclusions about the existence of a long-run hedge characteristic if it does not consider structural breaks.Maddala and Kim(1998)have also cautioned that cointegration can not necessarily be interpreted as a long-term relationship.
To overcome the aforementioned drawbacks, we utilize the methodology proposed by Den Haan(2000)to examine the inflation-hedging behavior of securitized real estate in Hong Kong from the short- and long-term perspectives, respectively. This approach considers the full set of statistics in the dataset to efficiently characterize the dynamics of both types of horizons.
Based on a VAR forecast horizon, correlation coefficients at different horizons are estimated and used to separate the short- and long-term dynamics.The estimation outcomesare straightforward enough to interpret the correlation at various numbers of lags,which is a huge advantage over VAR, VECM,and FIVECM.In addition,Den Haan’s approach is flexible enough to produce correlation estimates that are free from the constraints of lag-order selection, stationarity, and structural change. More general and objective results can thus be obtained, and they are easier to interpret. This flexibility provides Den Haan’s approach with a significant level of superiority over traditional methods in outlining the correlation patterns. However, it has not yet been applied to the analysis of the inflation-hedging effects of securitized real estate. Our study adds to the literature by employing this superior approach to explore the short- and long-term dynamics of the comovement between the inflation rate and securitized real estate returns. Through the analysis, we aim to provide new insights to help settle the inflation-hedging debate in the real estate literature by differentiating short- from long-term dynamics. Details of the methodology are discussed in the next section.
3.
Correlation Coefficients at Different Forecast Horizons
Den Haan (2000) introduces the VAR forecast error-based model to estimate the correlation coefficients at different forecast horizons. We adopt this model to analyze the inflation-hedging performance of securitized real estate, as discussed below.Consider the VAR model for the inflation rate (P ) and a securitized real asset t return (
Y
t) series: 2 1 L t t t X µ Bt Ct A X− ε = = + + +∑
l l+ l , (1) where(i)X
tcan be in eitheroriginalorlogform,i.e.,t
X′=[
P
t,Y
t]or[logP
t,log
Y
t],andt
X′denotes the transpose of
X
t; (ii)A
ls are the regression coefficients, andµ
, B, and C are the three constants; (iii) L denotes the total numberoflags,andtrepresentsthetimeperiod;and(iv)ε
tisthe innovation term and assumed to be serially uncorrelated. In practice,ε
t can be serially correlated, and the implied correlation coefficients are calculated via the forecast errors. The K-period ahead forecast and the forecast error oft X′are denoted by [E Yt t K+ ,E Pt t K+ ] and [ teK e K t P
Y+ , + ], respectively. By utilizing the difference between the realizations and their forecasts, we construct a time series for the forecast errors. Based on equation (1), the coefficients and covariance of
ε
t can be estimated via ordinary least squares regression.The228 Liu and Zhou
implied covariance and correlation coefficient between the K-period ahead forecast errors of
P
t andY
t can be calculated accordingly.The major advantages of this method are that it makes no assumption about the lag order of the integration, and works for both stationary and cointegrated series. If the series are stationary, then the correlation coefficient of the forecast errors will converge to the unconditional correlation coefficient between
P
tandY
t asK goes to infinity. For nonstationary series, the statistics may not converge, but the covariance and the correlation between theP
t andt
Y
series can be estimated consistently for fixed values of K(for more details, please refer to Den Haan, 2000).The Akaike information criterion (AIC) is used to identify the VAR order for the model specification. For a given vector time series, the order p is selected, such that AIC (p) = min0≤i≤mAIC (i), where m is a predetermined positive
integer. In addition,the lag order must be large enough to ensure that
ε
tis not integrated;that is, thelagordershould beat least g ift
X′containsanintegrated processof orderg,which is denoted as I (g).
4.
Data Description
As Glascock, Lu, and so (2002) have pointed out, the correlation between the returns of securitized real estate market and inflation rate is significantly influenced by macroeconomic monetary policy. Hong Kong serves as a special and appropriate study case because its monetary policy is delinked to exchange rate fluctuations. The real estate market plays an essential role in Hong Kong’s local economy. Real estate companies account for about 25% of the capitalization of the stock market, and many non-real estate companies are also involved in real estate-related business (Schwann and Chau, 2003). It is claimed that the Hong Kong real estate market is a mirror of its local economic circumstances (Haila, 2000).
Since the latter half of the 1990s, the Hong Kong real estate market has experienced drastic fluctuations, due to turbulent events, such as the 1997 Asian financial crisis, 2003 SARS outbreak, and major political shocks and economic transitions that resulted from the return of Hong Kong to China on July 1, 1997. These events came with various types of risks, and make vibrant Hong Kong an exemplary case for studying the short- and long-term impacts on the real estate market and deriving meaningful implications from the associated inflation-hedging behavior.
We used the Hang Seng Property Index (HSPI) as a proxy for the securitized real estate market in Hong Kong. The HSPI is one of the four sub-indexes of the Hang Seng Index(HSI),which is the overall stock market index of Hong Kong. The other three are the HSI-Finance, HSI-Utilities, and HSI-Commerce & Industry indexes. 1 The HSPI is more representative of the securitized real estate market in Hong Kong than REITs in terms of data coverage and history. Although the HSPI is made up of only six property companies, i.e., Cheung Kong, Henderson Land, Sun Hung Kai Properties Ltd., Sino Land, Hang Lung Properties Ltd., and China Overseas, they account for about 50% of the total market capitalization of the property sector in Hong Kong. As of December 31, 2007, the total market capitalization of their stocks is HK$1325.303 billion (Table 2),which is 50% of the entire property sector; HK$2650.790 billion. In addition, data availability is not an issue for the HSPI, whereas Hong Kong’s REITs are still in the initial stage of development and their data history is quite limited. The initial public offering of the first REIT; the Link REIT, was in November2005, and to date, there are only six REITs in Hong Kong. Therefore, the HSPI is an acceptable proxy for the securitized real estate market in Hong Kong.
Table 2 Market Capitalization ofSixConstituentCompanies in HSPI
Code Name Capitalization on Dec. 31, 2007 (HK$
billions)
1 Cheung Kong 334.198
12 Henderson Land 157.912
16 SHK Prop 424.086
83 Sino Land 134.053
101 Hang Lung Prop 150.049
688 China Overseas 125.004
Sum 1325.303
Source: http://finance.yahoo.com.hk/
Monthly time series for the HSPI and Hong Kong inflation rate were extracted from DataStream.The sample period ranged from April 1986, when the Hong Kong Exchanges announced the HSPI, to April 2007. Figure 1 presents the time series plots of the monthly HSPI and inflation rate in Hong Kong, and the corresponding descriptive statistics are listed in Table 3. It can be observed that before 1997, the inflation rate remains around 10%, which is accompanied by drastic increases in the property price index. Also, annual GDP grows at a rate of more than 10%, except in 1995. This overheated economy results in a significant bubble in the Hong Kong real estate market in 1997, as confirmed by Hui and Yue (2006).
1
230 Liu and Zhou 2 3 0 L iu a n d Z h o u
Figure 1 Time Series Plots of the Monthly Property Price Index (HSPI) and the Inflation Rate in Hong Kong from
1986 to 2007 -10 -5 0 5 10 15 75年年年年 4月月月月 77年年年年 4月月月月 79年年年年 4月月月月 81年年年年 4月月月月 83年年年年 4月月月月 85年年年年 4月月月月 87年年年年 4月月月月 89年年年年 4月月月月 91年年年年 4月月月月 93年年年年 4月月月月 95年年年年 4月月月月 Time In fl a ti o n (% ) 0 5000 10000 15000 20000 25000 30000 H S P I Infl ati on H KPI
Table 3 Descriptive Statistics of the Monthly Property Price Index and Inflation Rate in Hong Kong from 1986 to 2007
Mean Median Minimum Maximum
HSPI 12850.13 14212.29 1899.62 26940.82
Inflation (%) 4.15 5.38 -6.16 12.48
Std. Dev. Kurtosis Skewness Count
HSPI 6405.91 -0.9916 -0.02 253
Inflation (%) 5.15 -1.31 -0.27 253
The overwhelming political uncertainty associated with the handover of sovereignty on July 1, 1997 overshadowed the Hong Kong economy. The 1997 Asian financial crisis then led to a major economic downturn, which was accompanied by a huge drop in property prices. After several years of stagnancy, the Hong Kong real estate market suffered another period of recession after the SARS outbreak in 2003. The inflation rate remained at negative levels from 1998 to 2003, and the annual GDP growth rate was also negative for most of the period(seeFigure1).This is recognized as one of the toughest periods for the local property market in Hong Kong history. To boost Hong Kong’seconomy,the Chinese centralgovernment issued several major policies in the second half of 2003.2 These heavy-handed rescue policies helped the local economy to crawl out of its trough. As shown in Figure 1, the long period of deflation ends with a low and stable inflation rate (around 2%), and annual GDP is growing steadily at a rate of more than 5%. These evidences indicate that Hong Kong’s economy has been revitalized and is now growing at a healthy pace. Along with these favorable economic conditions, the real estate market has also gradually revived.Figure1 shows that the HSPI has increased rapidly since mid-2003, although it has not yet recovered to its 1997 peak level. All of the signs indicate that the real estate market in Hong Kong has regained market vitality and investor confidence.
5.
Empirical Results and Discussion
The stationarity of the series is a crucial issue in comovement analysis, and unit root tests are used to identify nonstationary series.Comovement analyses are implemented to analyze the correlation between the HSPI and inflation rate as a way to study the inflation-hedging performance of the securitized real estate market.The stationarity tests and comovement analyses are presented in Sections 5.1 and 5.2, respectively.
5.1. Stationarity Tests
Rolling analysis of time series is a preliminary step to test the model stability over
2
Among these policies, the most successful were the Individual Visit Scheme (http://www.tourism.gov.hk/english/visitors/visitors_ind.html) and the Closer Economic Partnership Agreement (http://cepa.tdctrade.com/).
232 Liu and Zhou
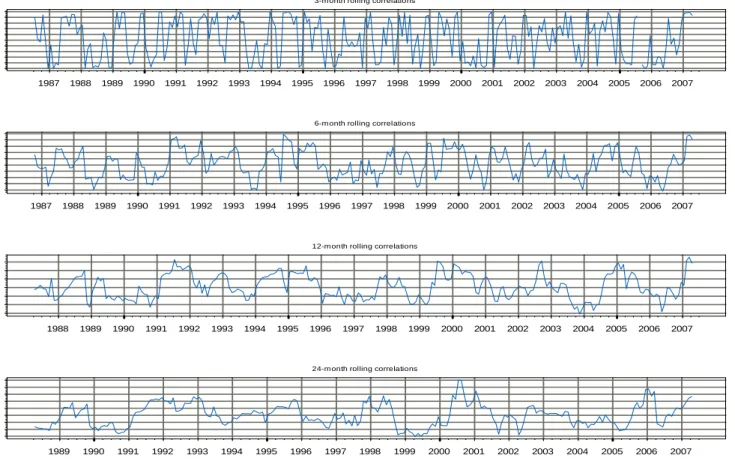
time, i.e. to compute parameter estimates over a rolling window of a fixed size through the sample. Rolling descriptive statistics for both series are demonstrated in Figures 2 and 3, with a moving window of 3 and 12 periods (quarterly and yearly, respectively) to represent the respective short- and long-term dynamics. In contrast, stationarity is significant in inflation rate series, but not HSPI return series. The correlation coefficient between the two series via rolling analysis (over 3-, 6-, 12-, and 24-month period)cannot give an intuitive outcome(Figure4).In essence, rolling analysis for correlation coefficient cannot perform well if one of the two series exhibits significant nonstationarity.
Figure 2 HSPI Return Series along with 3 and 12 Month Rolling Means And Standard Deviation
Panel A: 3-Month 1987 1989 1991 1993 1995 1997 1999 2001 2003 2005 2007 -0 .5 -0 .4 -0 .3 -0 .2 -0 .1 0 .0 0 .1 0 .2 0 .3 Returns Rolling mean Rolling sd Panel B: 12-Month 1987 1989 1991 1993 1995 1997 1999 2001 2003 2005 2007 -0 .5 -0 .4 -0 .3 -0 .2 -0 .1 0 .0 0 .1 0 .2 Returns Rolling mean Rolling sd
Figure 3 Inflation Rate Series along with 3 and 12 Month Rolling Means and Standard Deviation
Panel A: 3-Month 1987 1989 1991 1993 1995 1997 1999 2001 2003 2005 2007 -0 .5 -0 .4 -0 .3 -0 .2 -0 .1 0 .0 0 .1 0 .2 0 .3 Returns Rolling mean Rolling sd
Panel B: 12-Month 1987 1989 1991 1993 1995 1997 1999 2001 2003 2005 2007 -0 .0 6 -0 .0 4 -0 .0 2 0 .0 0 0 .0 2 0 .0 4 0 .0 6 0 .0 8 0 .1 0 0 .1 2 Returns Rolling mean Rolling sd
234 Liu and Zhou 2 3 4 L iu a n d Z h o u
Figure 4 Rolling Analysis of Correlation between HSPI Return and Inflation Rates
3-m onth rolling correlations
1987 1988 1989 1990 1991 1992 1993 1994 1995 1996 1997 1998 1999 2000 2001 2002 2003 2004 2005 2006 2007
-0
.8
0
.8
6-m onth rolling correlations
1987 1988 1989 1990 1991 1992 1993 1994 1995 1996 1997 1998 1999 2000 2001 2002 2003 2004 2005 2006 2007
-0
.8
0
.8
12-m onth rolling correlations
1988 1989 1990 1991 1992 1993 1994 1995 1996 1997 1998 1999 2000 2001 2002 2003 2004 2005 2006 2007
-0
.6
0
.2
24-m onth rolling correlations
1989 1990 1991 1992 1993 1994 1995 1996 1997 1998 1999 2000 2001 2002 2003 2004 2005 2006 2007
-0
.3
0
Seven types of unit roots were implemented for the stationarity tests. The initial benchmark test was the augmented Dickey-Fuller (ADF) test, which assumes that the residuals are independent and identically distributed (Dickey and Fuller1979).The Phillips-Perron(PP)test is similar to the ADF,but allows for serial correlation and heteroscedasticity in the residuals (Phillips and Perron 1988).Both tests usually give the same conclusion, but they suffer from problems,such as the lower power of the test,size distortion,and the false rejection of the null hypothesis of unit root existence, i.e., non- stationarity(NgandPerron2001).Someimprovedmethods havebeen proposed to overcome the pitfalls associated with the ADF and PP tests. For example, the KPSS(Kwiatkowski,Phillips,Schmidt,and Shin)test can be considered complementary to the ADF whose null hypothesis assumes stationarity (Kwiatkowski et al. 1992; Cheung and Chinn 1997). The modified Phillips- Perron (MPP) test is less subject to size distortion in the presence of serial correlation (Perron and Ng 1996; Cati, Garcia,and Perron 1999).The DF test with GLS detrending (DFGLS) is based on a generalized least squares regression of detrended data to help achieve the desirable size and power properties(Ng and Perron 2001). The Elliot-Rothenberg-Stock(ERS)test modifies the Dickey-Fuller t-test and substantially improves the power of the unit root test when an unknown mean or trend is present(Elliott, Rothenberg, and Stock 1996).The Zivot-Andrew test, which is based on the recursive estimation of a test regression, allows a break at an unknown point in either the intercept,linear trend,or both(ZivotandAndrews 1992).
For the inflation rate series, all of the unit root tests, except for the KPSS test, rejected the unit root hypothesis.TheKPSStestconfirmed that the differenced seriesare stationary.The outcomes for theHSPIwere mixed:three of the tests (the ADF,PP,and Zivot-Andrewtests)reject the unit roothypothesisatthe1% significance level, while three of the others (the MPP, DFGLS, and ERS tests) do not. The KPSS test indicated that the inflation rate is an I(1) process and that the HSPI cannot reject I(0) at the 1% significance level.This implies that the two series cannot be I(1) together and cointegration does not exist.In other words, the inflation rate series is an integrated process,whereas the nonstationarity of the HSPI is not strong.Thus,the HSPIcan be considered as either a stationary oran integrated process.Stationarity is a crucial issue in computing the correlation between the two series, but an arbitrary conclusion ontheunitrootcanbiasthecorrelationestimate.DenHaan’sapproachhas the advantage of being flexible enough to work for both stationary and cointegrated series,and free of the lag order assumption.Therefore, we conducted a comovement analysis on the inflation-hedging performance of securitized real estate in Hong Kong for two cases: one between the two differenced series,and the other for the original rate series of the HSPI and inflation rate.
236 Liu and Zhou
5.2 Comovement Analysis
The cointegration test helps to identify a long-term relationship between the series involved when the series have stochastic trends and short-term random divergence.Acomovementanalysiswasalsoconductedontheinflationrateand rate of return ofthesecuritized real estate market to help us in understanding itsinflation-hedging performanceinHongKong.The VAR and VECM models were first applied to investigate the cointegrated relationship between the inflation rate and securitized real estate, and then, we used Den Haan’s (2000) VAR forecast error approach for the comovement analysis.The superiority of the VAR forecast error approach is then demonstrated and discussed. The Johansen rank tests(Johansen1991)forcointegration showed that the two series are cointegrated at order 1, and the VAR model estimates are summarized in Table4.The parameter estimates are far from satisfactory because they have low t values,and a long-term relationship cannot be inferred from the results.The VECM estimate outcomes are presented in Table 5.These parameter estimates are equally unimpressive, due to their small t values. Consequently, the comovement estimates over different time horizons are far from reliable or straightforward.
Table 4 Johansen Rank Tests and VAR Model Estimates
Type of Model: VAR(2)
Estimation Method: Least Squares Estimation
AR Coefficient Estimates
Lag Variable HSPI Inflation rate
HSPI -0.02862 -0.32499 1 Inflation Rate -0.00772 0.89044 HSPI 0.00202 0.45079 2 Inflation Rate -0.00042 0.10614 Information Criteria AICC: -15.1142 HQC: -15.07 AIC: -15.1152 FPEC: 2.726E-7
SBC: -15.0029
Model Parameter Estimates
Equation Parameter Estimate Standard Error t Value Pr > |t| Variable
HSPI AR1_1_1 -0.02862 0.06362 -0.45 0.6532 HSPI (t-1)
AR1_1_2 -0.32499 0.85001 -0.38 0.7025 inflation(t-1)
AR2_1_1 -0.00202 0.06383 -0.03 0.9748 HSPI (t-2)
AR2_1_2 0.45079 0.85047 0.53 0.5966 inflation (t-2)
Inflation AR1_2_1 -0.00772 0.00476 -1.62 0.1059 HSPI (t-1)
AR1_2_2 0.89044 0.06355 14.01 0.0001 inflation (t-1)
AR2_2_1 -0.00042 0.00477 -0.09 0.9301 HSPI (t-2)
AR2_2_2 0.10614 0.06358 1.67 0.0963 inflation (t-2)
Note:AICC: Corrected Akaike Information Criterion;
AIC: Akaike Information Criterion
SBC: Schwartz Bayesian Information Criterion HQC: Hannan-Quinn Information Criterion FPEC: Final Prediction Error Criterion
The autocorrelation function (ACF) plot can help in detecting the long memory property.The long memory characteristics are exhibited in the inflation rate series,but not the HSPI series(Figure5).Dueto the unilateral longmemoryproperty,it isnot appropriatetoadopteitheralong-memorymodel (e.g.,theFIVECM)oralinear VECM.
Table 5 VECM Model Estimates
Type of Model: VECM(2)
Estimation Method: Maximum Likelihood Estimation Cointegrated Rank: 1
AR Coefficient Estimates
Lag Variable HSPI Inflation Rate
HSPI 0.00483 0.06628 1 Inflation rate -0.00694 0.89146 HSPI 0.03305 0.06140 2 Inflation rate -0.00046 0.10512 Information Criteria AICC: -15.1284 HQC: -15.095
AIC: -15.1289 FPEC: 2.689E-7
SBC: -15.0447
Model Parameter Estimates
Equation Parameter Estimate Standard Error t Value Pr > |t| Variable
D_HSPI AR1_1_1 -1.03062 0.09058 HSPI (t-1)
AR1_1_2 0.12079 0.01062 inflation(t-1)
AR2_1_1 0.00201 0.06332 0.03 0.9746 D_HSPI (t-2)
AR2_1_2 -0.44837 0.84282 -0.53 0.5952 D_inflation (t-1)
D_inflation AR1_2_1 -0.00815 0.00678 HSPI (t-1)
AR1_2_2 0.00096 0.00079 inflation (t-1)
AR2_2_1 0.00042 0.00474 0.09 0.9290 D_HSPI (t-1)
AR2_2_2 -0.10826 0.06308 -1.72 0.0874 D_inflation (t-2)
Structural change can have a significantimpact on comovementestimation outcomes. Based on the test proposed by Hansen(1997),nonlinearityis confirmed as significant in both series, and the bootstrapped threshold estimates are listed in Table 6. The null hypothesis of no threshold is rejected for both series because the bootstrap p-value is lowand F-test statistics are high.The major political and economic events during the sample period are the top candidates for causing the significant structural changes. These include the political handover on July 1, 1997, the 1997 Asian financial crisis, 2003 SARS outbreak, and significant market recovery that followed them, spurred on by the favorable policies of the central government. These structural changes in the respective series also result in the failure of the VAR and VECM models.
238 Liu and Zhou 0 20 40 60 80 100 Lag -0 .4 -0 .2 -0 .0 0 .2 0 .4 0 .6 0 .8 1 .0 A C F
Figure 5 ACF Plot
Panel A: Inflation Rate
Panel B: HSPI
Table 6 Nonlinearity Tests
Variable HSPI Inflation rate
Number of bootstrap replications 100 100
Trimming percentage 0.15 0.15
Threshold estimate 0.016 0.0071
F-test for no threshold 30.8232 44.3376
Bootstrap P-Value 0.02 0
Null Hypothesis: No threshold with the specified threshold variable under maintained
assumption of homoskedastic errors
NonlinearityTest:Hansen sup-LR Nonlinearity
0 20 40 60 80 100 Lag 0.0 0.2 0.4 0.6 0.8 1.0 ACF
The VAR forecast error approach introduced by Den Haan (2000) helps to overcome the estimation hurdles encountered by the VAR and VECM models and provides straightforward and intuitive estimation results. This approach requires no assumption on the order of integration of Xt; that is, it allows Xt to
contain stationary and integrated processes (Den Haan (2000)). Therefore, we conducted a comovement analysis between the HSPI and inflation rate for two cases: one with both original series and the other with the cointegrated process of order 1.The number of lags was determined via the AIC criterion, and the forecast horizons were specified for periods1to 84,considering the average length of business cycles.
The comovement estimation results for the two series are presented in Figure 6. Panel A plots the correlation coefficient estimates produced by the VAR forecast error method when a unit root is imposed; that is, the two processes are differenced and thus both stationary. Panel B demonstrates the correlation coefficients when no unit root is imposed and the original series are used. Both panels show a similar and straightforward pattern, which indicates the comovement between the HSPI and inflation rate is positive in the short-term (with a forecast horizon of fewer than 12 periods, i.e., one year) and negative in the long-term, regardless of the unit root. As discussed in Section 3, the correlation coefficient estimates by Den Haan’s method may not converge for nonstationary series and the noise in the VAR forecast error may expand as the forecast horizon expands in Panel B. However, the distinctive pattern remains noticeable. Note that the absolute negative comovement magnitude at longer forecast horizons is larger than the positive estimate for the short-term horizons; that is, the positive comovement is transient and weak3.
3
Itmightbetemptingtodecomposetheinflationrateintoexpectedandunexpected
components and study their respective correlation with the return series of securitized real estate market. There are some issues to clarify before implementation and the estimation outcomes are not satisfactory. There are at least three major ways to
disintegrate the inflation rate into expected and unexpected components.The first
approachisproposed by FamaandGibbons(1984)which assumes that the risk-free rate
is the sum of expected and unexpected inflation rates with residual term. The risk-free
rate is either assumed constant or treated as a weighted average of past real rates.It is
debatable toassume theconstant rateand period length for the weighted average. The
second approach is based on the adaptive expectation, which formulates that the next inflation estimate is based on the prior expected inflation rate and adjusted for differences between actual and the prior expectation of inflation rate for each period. This approach is essentially a Box-Jenkins ARIMA model. The third approach is based on the Hoddrick-Prescott filter which effectively assumes random walk for the inflation rate. The estimate outcomes for the first approach do not indicate any significant pattern. Yet, there is no consistency in the lag length employed for the second approach. For the third approach, the correlation coefficient estimates show zigzags around zero. In summary, estimate outcomes do not indicate a specific and meaningful pattern and are infeasible to interpret. The results are not reported in the paper, but they can be obtained upon request.
240 Liu and Zhou
Figure 6 Correlation Coefficient Estimates by VAR Forecast Error Method for the Original Monthly Series (Hong Kong)
Panel A (With Unit Root)
-0.5 -0.4 -0.3 -0.2 -0.1 0 0.1 0.2 1 4 7 10 13 16 19 22 25 28 31 34 48 84 C o rr e la ti o n C o e ff ic ie n t Forecast Horizon VAR, lag=4, UR
Panel B (Without Unit Root)
The estimation outcomes based on quarterly data are presented in the Appendix.Theinflation-hedging performance remainsnegativein thelongrun. However, the relationship does not appear to be positive in the short term, probably because the transient pattern shown in the relatively high frequency
-0.5 -0.4 -0.3 -0.2 -0.1 0 0.1 0.2 1 4 7 10 13 16 19 22 25 28 31 34 48 84 C o rr e la ti o n C o e ff ic ie n t Forecast Horizons VAR, lag=4, No UR
data (monthly data) can hardly be displayed in the low frequency data (quarterly data), and the insufficient data count can barely provide robust outcomes. In addition, the Hong Kong securitized real estate market is rather volatile during the sampling period. Through the use of quarterly data, some
volatility may be smoothed and thus the estimation results cannot reveal the real picture of this market. Therefore, the discussion in this study is based on the outcomes of a monthly data analysis.
The estimation results of a monthly data analysis imply that the use of securitized real estate as an inflation hedge is only a short-term consideration in Hong Kong. In the long term, in contrast, securitized real estate becomes a perverse inflation hedge. Furthermore, the short- and long-term correlations may interact or overlap and specific patterns are unknown. This scenario makes it impossible to segregate complex correlation dynamics with respect to various shocks. Rather, we focus on depicting the overall correlation changes along with various forecast horizons in a way that is easy to interpret. The result indicates that other social,political, and even regional factors take effect in the long-term and outweigh the inflation-hedging performance. Securitized real estate performs more like common stocks and shows reverse inflation behavior in the long term, although it can serve as an inflation hedge for short-term investment. These observations underline the importance of differentiating between short- and long-term dynamics when conducting comovement analysis, and the outcomes provide new insights into the debate over the inflation- hedging performance of securitized real estate.
The neighboring markets exhibit a distinctive inflation-hedging pattern, which is different from Hong Kong. In general, the comovement pattern is negative in the short run and positive in the long run for the markets in Singapore, South Korea, Taiwan, and Japan (Figures 7-10).4Essentially, inflation-hedging is a major long- term consideration for these four markets, but only a short-term consideration in the Hong Kong market. This contrast not only serves as a robustness check, but also highlights the special properties of the securitized real estate market in Hong Kong. If we reconsider the turmoil during 1986 and 2007 experienced by the East Asian markets, Hong Kong is special for its experience in political handover. This major political switch has brought tremendous impacts on investment preferences on the real estate market. After all, inflation-hedge is one of the decision factors and real estate investment has its short- and long-term considerations. The free market and linked exchange rate systems in Hong Kong have facilitated the local real estate market to react in a more straightforward sense.
4
The monthly datasets of local stock market index and inflation rate in the other four East Asian markets (Singapore, South Korea, Taiwan, and Japan) are also downloaded from Datastream, ranging from April 1986 to April 2007.
242 Liu and Zhou
Figure 7 Correlation Coefficient Estimates by VAR Forecast Error
Method for the Original Monthly Series (Singapore)
Panel A (with unit root)
-0.02 -0.01 0 0.01 0.02 0.03 0.04 0.05 0.06 0 10 20 30 40 50 60 70 80 90 C o rr e la ti o n C o e ff ic ie n t Forecast Horizon VAR, Lag=10, UR
Panel B (without unit root)
-0.04 -0.02 0 0.02 0.04 0.06 0.08 0 20 40 60 80 100 C o rr e la ti o n C o e ff ic ie n t Forecast Horizon VAR, lag=10, No UR
Figure 8 Correlation Coefficient Estimates by VAR Forecast Error Method or the Original Monthly Series (South Korea)
Panel A (with unit root)
-0.1 0 0.1 0.2 0.3 0.4 0.5 0.6 0.7 0 10 20 30 40 50 60 70 80 90 C o rr e la ti o n C o e ff ic ie n t Forecast Horizon VAR, lag=12, UR
Panel B (without unit root)
-0.1 0 0.1 0.2 0.3 0.4 0.5 0.6 0.7 0 10 20 30 40 50 60 70 80 90 C o rr e la ti o n C o e ff ic ie n t Forecast Horizon VAR, lag=12, No UR
244 Liu and Zhou
Figure 9 Correlation Coefficient Estimates by VAR Forecast Error
Method for the Original Monthly Series (Taiwan)
Panel A (with unit root)
-0.02 0 0.02 0.04 0.06 0.08 0.1 0.12 0 20 40 60 80 100 C o rr e la ti o n C o e ff ic ie n t Forecast Horizon VAR, lag=11, UR
Panel B (without unit root)
VAR, lag=11, No UR -0.2 -0.2 -0.2 -0.2 -0.15 -0.15 -0.15 -0.15 -0.1 -0.1 -0.1 -0.1 -0.05 -0.05 -0.05 -0.05 0 00 0 0.05 0.05 0.05 0.05 0.1 0.10.1 0.1 0 0 0 0 10101010 20202020 30303030 40404040 50505050 60606060 70707070 80808080 90909090 Forecast Horizon C o rr e la ti o n C o e ff ic ie n t
Figure 10 Correlation Coefficient Estimates by VAR Forecast Error Method for the Original Monthly Series (Japan)
Panel A (with unit root)
-0.025 -0.02 -0.015 -0.01 -0.005 0 0.005 0.01 0.015 0.02 0.025 0 20 40 60 80 100 C o rr e la ti o n C o e ff ic ie n t Forecast Horizon VAR, lag=9, UR
Panel B (without unit root)
-0.06 -0.04 -0.02 0 0.02 0.04 0.06 0.08 0.1 0 20 40 60 80 100 C o rr e la ti o n C o e ff ic ie n t Forecast Horizon VAR, lag=9, UR
246 Liu and Zhou
6.
Conclusions
Real estate plays an important role in reflecting the social, economic, and political conditions of a society, and its inflation-hedging performance is one of the major considerations in real estate investment. This study attempts to contribute to the literature by exploring the inflation-hedging capability of securitized real estate from a dynamic perspective.We have studied the comovement relationship between securitized real estate returns and the inflation rate at different forecast horizons in the five major markets in East Asia by applying the VAR forecast error method introduced by Den Haan (2000).The HSPI is selected as a proxy for securitized real estate market because of its availability of richer data and wider coverage of the property market in comparison with REITs.
The approach proposed by Den Haan (2000) has been found to outperform the traditional linear VAR and VECM models in two aspects: it can reveal the short- and long-term dynamics of thecomovement relationship,and works for both stationary and integrated processes. This method helps to outline the comovement at different forecast horizons irrespective of issues, such as lag order selection, long memory property, structural changes, and existence of cointegration.
Distinctive from the patterns of the other four East Asian markets, the comovement estimates in Hong Kong show a positive correlation between the HSPI and inflation in the short-term and a negative correlation in the long-term for both the original series and cointegration process. This indicates that in Hong Kong, securitized real estate can behave as an inflation hedge in the short term, but becomes a perverse inflation hedge in the long run. These different correlation patterns at different forecast horizons not only highlight the significance of differentiating between short- and long-term dynamics, but also reflect the fast-decaying weight of the inflation hedge consideration for securitized real estate investment. This is because the inflation hedge consideration soon becomes overwhelmed by other factors, such as political uncertainty and economic shocks. The results of our analysis of the Hong Kong market indicate that the inflation-hedging capability of securitized real estate is not a static issue, but rather, depends on the length of the forecast horizons.
Furthermore, Hong Kong shows a different inflation-hedging pattern from that of its neighboring markets(Singapore,South Korea,Taiwan,and Japan) during1986 and 2007. It can be speculated that the difference can be attributed to the free market and linked exchange rate systems in Hong Kong or this topic can be reserved for future research. This topic is reserved for further research.
References
Anari, Ali, and James Kolari. (2002). House Prices and Inflation, Real Estate Economics, 30, 1, 67-84.
Barkham, R. J., and C. W. R. Ward. (1996). The Inflation-hedging Characteristics of UK Property, Journal of Property Finance, 7, 1, 62-76. Bond, M. T., and M. J. Seiler. (1998). Real Estate Returns and Inflation: An Added Variable Approach, Journal of Real Estate Research, 15, 3, 327-338. Brueggeman, W. B., A. H. Chen, and T. G. Thibodeau. (1984). Real Estate Investment Funds: Performance and Portfolio Considerations, AREUEA Journal, 12, 3, 333-354.
Cati, Regina Celia, Marcio G. P. Garcia,and Pierre Perron. (1999). Unit Roots in the Presence of Abrupt Governmental Interventions with an Application to Brazilian Data. Journal of Applied Econometrics, 14, 1, 27-56.
Chen, Ming-Chi, and Tien Foo Sing. (2006). Common Structural Time Series Components in Inflation and Residential Property Prices, Journal of Real Estate Portfolio Management, 12, 1, 23-36.
Cheung, Yin-Wong, and Menzie D.Chinn.(1997). Further Investigation of The Unit Root in GNP, Journal of Business and Economic Statistics, 15, 68-73.
Den Haan,Wouter J. (2000). The Comovement Between Output and Prices, Journal of Monetary Economics, 46, 3-30.
Dickey, D. A., and W. A. Fuller. (1979). Distribution of the Estimators for Autoregressive Time Series with a Unit Root, Journal of the American Statistical Association, 74, 366, 427-431.
Elliott, G., T. J. Rothenberg, and J. H. Stock. (1996). Efficient Tests for an Autoregressive Unit Root, Econometrica, 64, 813-836.
Ewing, B., and J. Payne. (2005). The Response of Real Estate Investment Trust returns to Macroeconomic Shocks, Journal of Business Research, 58, 3, 293-300.
Fama, Eugene F., and G. W. Schwert. (1977). Asset Returns and Inflation. Journal of Financial Economics, 5, 2, 115-146.
Ganesan, S., and Y. H. Chiang. (1998). The Inflation-hedging Characteristics of Real and Financial Assets in Hong Kong, Journal of Real Estate Portfolio Management, 4 1, 55-67.
248 Liu and Zhou
TGlascock, John L., Chiuling Lu, and Raymond W. So. (2002). REIT Returns and Inflation: Perverse or Reverse Causality Effects?, Journal of Real Estate Finance & Economics, 24, 3, 301-317.
Gyourko, J., and P. Linneman. (1988). Owner-occupied Homes, Income-producing Properties, and REITs as Inflation Hedges: Empirical Findings, Journal of Real Estate Finance and Economics, 1, 4, 347-372. Haila, A. (2000). Real estate in global cities: Singapore and Hong Kong as Property States, Urban Studies, 37, 12, 2241-2256.
Hansen, Bruce E. (1997). Inference in TAR Models, Studies in Nonlinear Dynamics and Econometrics, 2, 1, 1-14.
Hartzell, D., J. S. Hekman, and M. E. Miles. (1987). Real Estate Returns and Inflation, AREUEA Journal, 15, 1, 617-637.
Hoesli, M., B. D. MacGregor, G. Matysiak, and N. Nanthakumaran. (1997). The Short-term Inflation-hedging Characteristics of U.K. Real Estate. Journal of Real Estate Finance and Economics, 15, 1, 27-57.
Hudson-Wilson, S., J. S. Gordon, F. J. Fabozzi, M. J. P. Anson, and S. M. Giliberto. (2005). Why Real Estate? And How? Where? And When? Journal of Portfolio Management, Real Estate Special Issue, 12-22.
Hui, E. C. M., and S. Yue. (2006). Housing Price Bubbles in Hong Kong, Beijing and Shanghai: A Comparative Study, Journal of Real Estate Finance and Economics, 33, 4, 299-327.
Johansen, S. (1991). Estimation and Hypothesis Testing of Cointegration Vectors in Gaussian Vector Autoregressive Models, Econometrica, 59, 1551-1580.
Kwiatkowski, D., P. Phillips, P. Schmidt, and Y. Shin. (1992). Testing the Null Hypothesis of Stationarity Against the Alternative of a Unit Root. Journal of Econometrics, 54, 159-178.
Lien, D., and Y. Tse. (1999). Forecasting the Nikkei Spot Index with Fractional Cointegration, Journal of Forecasting, 18, 259-273.
Liow, Kim, and Haishan Yang. (2005). Long-term Co-memories and Short-run Adjustment: Securitized Real Estate and Stock Markets, Journal of Real Estate Finance and Economics, 31, 3, 283-300.
Liu, Crocker H., and David J. Hartzell. (1997). International Evidence on Real Estate Securities as an Inflation Hedge. Real Estate Economics, 25, 2, 193-221.
Lu, Chiuling, and Raymond W. So. (2004). The Relationship Between REITs Returns and Inflation: A Vector Error Correction Approach, Review of Quantitative Finance and Accounting, 16, 2, 103-115.
Miles, M., and J. Mahoney. (1997). Is Commercial Real Estate an Inflation Hedge?, Real Estate Finance, 13, 4, 31-45.
Ng, S., and P. Perron. (2001). Lag Length Selection and the Construction of Unit Root Tests with Good Size and Power, Econometrica, 69, 1519-1554. Park, J. Y., D. J. Mullineaux, and I. K. Chew. (1990). Are REITs inflation hedge?, Journal of Real Estate Finance and Economics, 3, 1, 91-103.
Perron, P., and S. Ng. (1996).Useful Modifications to Unit Root Tests With Dependent Errors and Their Local Asymptotic Properties, Review of Economic Studies, 63, 3, 435-463.
Phillips, P. C. B., and P. Perron. (1988). Testing for a Unit Root in Time Series Regression, Biometrika, 75, 2, 335-346.
Schwann, G. M., and K. W. Chau. (2003). News Effects and Structural Shifts in Price Discovery in Hong Kong, Journal of Real Estate Finance and Economics, 27, 2, 277-271.
Simpson, Marc W., Sanjay Ramchander, and James R. Webb. (2007). The asymmetric response of equity REIT returns to inflation, Journal of Real Estate Finance and Economics, 34, 4, 513-529.
Sirmans, G. S., and C. F. Sirmans. (1987). The Historical Perspective of Real Estate Returns, Journal of Portfolio Management, 13, 3, 22-31.
Strikholm, Birgit, and Timo Teräsvirta. (2006). A Sequential Procedure for Determining the Number of Regimes in a Threshold Autoregressive Model, Econometrics Journal, 9, 3, 472-491.
Titman, S., and A. Warga. (1989). Stock Returns as Predictors of Interest-rates and Inflation, Journal of Financial and Quantitative Analysis,
24, 1, 47-58.
Wurtzebach, C. H., G. R. Mueller, and D. Machi. (1991). The impact of inflation and vacancy of real estate returns, Journal of Real Estate Research,
6, 2, 153-168.
Yobaccio, E., J. H. Ketcham, and D. C. Ketcham. (1995). The Inflation-hedging Properties of Risk Assets: The Case of REITs, Journal of Real Estate Research, 10, 3, 279-296.
250 Liu and Zhou
Zivot, Erick, and Donald Andrews. (1992). Further Evidence on the Great Crash, the Oil-price Shock, and the Unit-root Hypothesis, Journal of Business and Economic Statistics, 10, 251-270.
Appendix
The Estimate Outcomes by VAR Forecast Error-Based Model with Quarterly Data
The datacountforquarterlydata is84andtheforecast horizon is7years,i.e.28 periods. The lag number is 7, selected via AIC. The estimation outcomes are demonstrated in Figures A1 and A2, with and without the unit root, respectively. Both figures show a significant and negative inflation-hedging relationship in the long run. The short-term positive correlation pattern in the monthly data is not seen in the quarterly analysis, either due to the transient short-term dynamics(for example, in Figure7,it lastsfor only threemonths)or because the insufficient data count can hardly provide more robust outcomes.
Figure A1 Correlation Coefficient Estimates by VAR Forecast Error Method for the Original Quarterly Series (with unit root)
VAR, lag=7, UR -0.3 -0.25 -0.2 -0.15 -0.1 -0.05 0 1 3 5 7 9 1 1 1 3 1 5 1 7 1 9 2 1 2 3 2 5 2 7 Forecast Horizon C o rr e la ti o n C o e ff ic ie n t
Figure A2 Correlation Coefficient Estimates by VAR Forecast Error Method for the Original Quarterly Series (without unit root)
VAR, lag=7, no UR -0.15 -0.1 -0.05 0 1 3 5 7 9 1 1 1 3 1 5 1 7 1 9 2 1 2 3 2 5 2 7 Forecast Horizon C o rr e la ti o n C o e ff ic ie n t