Content Availability, Pollution and Poisoning in Peer-to-Peer File
Sharing Networks
∗
Nicolas Christin
a, Andreas S. Weigend
band John Chuang
aaSchool of Information Management and Systems, University of California, Berkeley bWeigend Associates, LLC
{christin,chuang}@sims.berkeley.edu [email protected]
Abstract
Copyright holders have been investigating technological solu-tions to prevent distribution of copyrighted materials in peer-to-peer file sharing networks. A particularly popular technique consists in “poisoning” a specific item (movie, song, or soft-ware title) by injecting a massive number of decoys into the peer-to-peer network, to reduce the availability of the targeted item. In addition to poisoning, pollution, that is, the accidental injection of unusable copies of files in the network, also de-creases content availability. In this paper, we attempt to pro-vide a first step toward understanding the differences between pollution and poisoning, and their respective impact on con-tent availability in peer-to-peer file sharing networks. To that effect, we conduct a measurement study of content availability in four of the most popular peer-to-peer file sharing networks, in the absence of poisoning, and then simulate different poi-soning strategies on the measured data to evaluate their poten-tial impact. We exhibit a strong correlation between content availability and topological properties of the underlying peer-to-peer network, and show that the injection of a small number of decoys can seriously impact the users’ perception of content availability.
1
Introduction
Since its inception in 1999 with the Napster service, peer-to-peer file sharing has grown to the point of becoming one of the predominant sources of Internet traffic [20, 22]. As a result, and even though the actual impact of peer-to-peer file sharing on product sales remains hard to assess (e.g., [19] and [24] reach opposite conclusions), copyright holders are now more than ever worried by the potential loss of revenues due to file sharing, and have been exploring several options for thwarting file sharing on peer-to-peer networks. In particular, while legal action, for instance the case against Napster [1], has received the most significant exposure in the popular press, consider-able effort has also been devoted to investigate technological solutions for reducing content availability in peer-to-peer file sharing networks.
A common technique to decrease the availability of a spe-cific item (e.g., movie, song, software distribution) in a peer-to-∗This work is supported in part by the National Science Foundation under
grant numbers ANI-0085879 and ANI-0331659.
peer network consists in injecting a massive number of decoys into the network [12]. The decoys are files whose name and metadata information (e.g., artist name, genre, length) match those of the item, but whose actual content is unreadable, cor-rupted, or altogether different from what the user expects. For instance, many peer-to-peer users who tried to download the song “American Life” by Madonna found themselves in pos-session of a track that only contained a message from the artist chiding them for using file sharing services. We refer to such a deliberate injection of decoys as item poisoning.
In addition to poisoning, the accidental injection of “bad” (i.e., poorly encoded or truncated) copies of files in the net-work, or network pollution, also has the effect of decreasing the proportion of usable content in the network. For instance, a recent study [16] provides empirical evidence that a significant fraction of the files served in the KaZaA/FastTrack network are unusable, due to either pollution or poisoning.
However, while pollution and poisoning both result in intro-ducing unusable files in the network, their respective charac-teristics and impact may be significantly different. More pre-cisely, pollution can generally be assimilated to (almost) ran-dom noise, whereas poisoning aims at changing the availabil-ity of a specific item in the network, by deliberately making it harder to find usable copies of the item.
In this paper, we attempt to provide a first step toward un-derstanding the impact of pollution and poisoning on content availability in peer-to-peer file sharing networks. We notably investigate questions such as “which level of network pollution is really harmful?” or “is a given poisoning strategy effective at limiting the availability of the item it targets?”
Our specific contributions are as follows. We first provide a measurement study of content availability in four of the most popular peer-to-peer file sharing networks, in the absence of (blatant) poisoning. We next discuss the differences between network pollution and possible poisoning strategies, some of which have been observed in practice [16]. We then evalu-ate the effect of network pollution and poisoning on content availability, by numeric simulation on the gathered measure-ment data. We exhibit a potentially strong correlation between content availability and topological properties of the underly-ing peer-to-peer network, and show that the injection of a small number of decoys can seriously impact the users’ perception of content availability.
As a caveat, we point out that this paper solely focuses on the properties of the file sharing networks. More precisely,
while we do look at metrics that influence user behavior, such as the time to complete a download, we defer the study of ac-tual user behavior (e.g., through laboratory experiments with human subjects) to future work.
The remainder of this paper is organized as follows. In Sec-tion 2, we briefly review some of the related measurement stud-ies that have been proposed in the literature. In Section 3, we summarize how the various peer-to-peer networks we investi-gate respond to user queries. In Section 4, we report our mea-surements of content availability in four of the most popular peer-to-peer networks. In Section 5, we use the measurement data obtained to characterize by simulation the response of the networks under consideration to pollution and to different types of poisoning attacks. Finally, in Section 6, we draw brief con-clusions and identify some avenues for future research.
2
Related work
The rapid rise of peer-to-peer networks has prompted number of quantitative works. Some studies, e.g. [13, 20, 22], take a bird’s eye view of commercial or university networks, and as-sess the impact of peer-to-peer traffic on the underlying phys-ical network. In particular, [20] provides convincing evidence of the very high level of peer-to-peer traffic on university cam-puses, and [13] confirms the amount of peer-to-peer traffic is not declining, despite the legal threats on peer-to-peer users.
Other measurement works investigate topological properties of peer-to-peer networks. For instance, [15] discusses proper-ties of the KaZaA/FastTrack network, [17] describes the evo-lution in the topology of the Gnutella network, and [23] char-acterizes traffic on the eDonkey network; [21] exhibits a high heterogeneity in the hosts connected to the Gnutella and Nap-ster networks, while [5] looks at peer availability, and notably at the turnover rate of hosts in the Overnet peer-to-peer network.
A few studies measure content location and popularity in peer-to-peer networks. [6] exhibits power-laws in content repli-cation in the Napster and Gnutella networks. [11] shows that, on the other hand, download requests significantly deviate from a power-law distribution, due to the fact that most users down-load files only once. [14] shows that the eDonkey network presents geographical clustering properties, which could be taken advantage of with the appropriate content replication al-gorithms.
All of these works provide us with a very good understanding of the properties of peer-to-peer file sharing systems at the net-work level, by mostly relying on passive measurements; that is, they monitor the network without introducing noticeable per-turbations. Because we are more concerned in how end users perceive the network, we use active measurements, which con-sist in presenting the network with an input, and measuring the response of the network to that input.
In that respect, [16] is more closely related to our study. The authors of [16] send a set of queries into the FastTrack net-work, and measure returns to their queries. They show they obtain a significant proportion of incomplete or corrupted files, and provide a methodology to automatically assess whether a
file is a decoy. Our study takes a different, and complementary, approach, by making the distinction between pollution and poi-soning, and evaluating the potential impact of different poison-ing strategies. Additionally, we do not limit our investigation to FastTrack but also examine the properties of the eDonkey, Overnet, and Gnutella networks.
3
Background
As evidenced by the demise of the Napster network, which quasi-immediately followed the shutdown of the search infras-tructure, the success of a peer-to-peer network is generally driven by content availability. Content availability describes how easily content can be found and downloaded, and is it-self directly conditioned by the network response to user search queries.1 How queries are processed is itself highly dependent on the topology of the peer-to-peer network, which we discuss in this section.
Older peer-to-peer file sharing networks such as Napster re-lied on a global index of the network contents, hosted on a cen-tralized server. Because one can take down the entire network by attacking the centralized server, as was the case with the legal attack on Napster [1], most of the peer-to-peer networks have since then abandoned a completely centralized search in-dex in favor of distributed search primitives.
In particular, the four most popular peer-to-peer networks, that is, the eDonkey, FastTrack, Ares, and Gnutella networks, which have between 1,000,000 and 2,500,000 users each,2all
rely on two-tiered hierarchical topologies, where nodes are split between leaf nodes and hubs (called “ultrapeers” in Gnutella, “supernodes” in FastTrack and Ares, and “servers” in eDon-key). Leaf nodes maintain a connection to a handful of hubs, while hubs maintain connections with hundreds or more of leaves, and with many other hubs. Each hub serves as a central-ized index for the leaf nodes that it is connected to. Whenever a leaf node issues a query, the query is sent to the hub(s) the leaf node is connected to. If the item requested is not present in the index maintained by the hub(s), the query is then forwarded to other hubs.
The main differences between the eDonkey, FastTrack, Ares and Gnutella networks reside in (1) the proportion of hubs among all nodes, (2) the rate at which connections between leaves and hubs change, and (3) the criteria that preside over the promotion of a leaf node to hub status. Different networks also use different formats for query messages, but differences in message formats have generally limited incidence on the num-ber and content of responses to a query, thus we will not discuss them any further here.
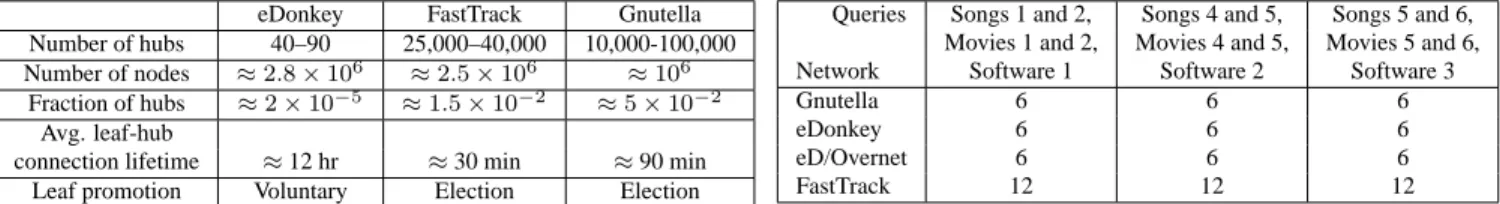
We summarize the hierarchical properties of the different networks under study in Table 1. The number of hubs is
eval-1A notable exception is BitTorrent [9], which does not provide any search
facility. As such, BitTorrent is arguably more of an extremely efficient dis-tributed algorithm for downloading a given file, than a peer-to-peer network containing a collection of files.
eDonkey FastTrack Gnutella Number of hubs 40–90 25,000–40,000 10,000-100,000 Number of nodes ≈2.8×10⁶ ≈2.5×10⁶ ≈106
Fraction of hubs ≈2×10⁻⁵ ≈1.5×10⁻² ≈5×10⁻²
Avg. leaf-hub
connection lifetime ≈12 hr ≈30 min ≈90 min Leaf promotion Voluntary Election Election
Table 1: Topological characteristics. The table illustrates the differences in topology between the different networks. uated using publicly available statistics for eDonkey,3 and
us-ing measurements presented in [15] and [17] for FastTrack and Gnutella, respectively. We do not have data available for the Ares network, but conjecture Ares presents some similarities with Gnutella, since Ares was originally based on Gnutella. Di-viding the number of hubs by the total size of the network, we can infer the fraction of hubs in the network. We further use measurements from [15, 17] as well as our own measurements (for eDonkey) to determine the average lifetime of a leaf-hub connection. Note that we only present estimates of averages over all nodes here. Results for specific nodes can significantly deviate from these averages, and we refer to [15, 17] for more comprehensive data. However, these averages allow us to make the key observation that eDonkey is much more centralized than FastTrack or Gnutella, relying on a few hubs (servers), and con-nections between leaf nodes and servers that are much more persistent.
The insight behind the difference in topologies lies in how nodes are promoted from leaf to hub. Promotion is purely vol-untary in eDonkey: users interested in hosting a server have to install and run specific server software. Hence, servers are ex-pected to have very long uptimes, a (quasi-)permanent connec-tion to the network, and the ability to handle large number of re-quests. Conversely, in both FastTrack and Gnutella, leaf nodes are promoted to hubs by the software client, and generally un-beknownst to the user. Even though criteria for promotion to hub status include node uptime, network capacity and process-ing power, FastTrack and Gnutella hubs exhibit rates of con-nection and disconcon-nection to the network only slightly lower than those of leaves, and certainly much higher than those of eDonkey servers.
Last, the fifth most popular file sharing network, Overnet, accounts for over 800,000 users. Overnet does not distinguish between leaves and hubs, and instead relies on the Kademlia distributed hash table [18] to locate content. However, all Over-net clients simultaneously connect to the eDonkey Over-network,4so
that we expect to observe significant content overlap between the eDonkey and Overnet networks.
4
Content availability
Ideally, each node participating in a peer-to-peer network should have the same, global, view of the entire content
avail-3http://ocbmaurice.dyndns.org/pl/ed2k_stats.pl 4Clients solely connecting to the Overnet network were only available as
“beta” versions, and were discontinued in August 2004.
Queries Songs 1 and 2, Songs 4 and 5, Songs 5 and 6, Movies 1 and 2, Movies 4 and 5, Movies 5 and 6, Network Software 1 Software 2 Software 3
Gnutella 6 6 6
eDonkey 6 6 6
eD/Overnet 6 6 6
FastTrack 12 12 12
Table 2: Experimental setup. The table describes the number of hosts on each network that were used to issue each query.
able on the network, irrespective of time or location. However, responses to a query may significantly differ depending on the hub responding to the query. In networks where connections between leaves and hubs are highly dynamic, and with high turnover rate among the peers [5, 15, 17], a user’s view of the available content may drastically depend on time and location.
In this section, we outline the differences in (perceived) con-tent availability across different networks, and correlate them with differences in the network topologies. The goal is to gain a better understanding of the factors that influence the sensitiv-ity of a network to poisoning and pollution. To that effect, we conducted a measurement study of content availability in the eDonkey, eDonkey/Overnet, FastTrack, and Gnutella networks in the absence of observable poisoning, so that we can later (in Section 5) separately characterize the effects of different poi-soning strategies on each network. We next motivate and dis-cuss our measurement infrastructure, describe our experimental methodology, and report our observations.
4.1
Measurement infrastructure
Logical overlay network topologies such as peer-to-peer net-works generally bear little resemblance to the underlying ge-ographical locations of their participants. However, we con-jecture that peer-to-peer nodes located in geographically dis-tant areas are unlikely to be topologically close in the peer-to-peer network. Thus, we try to obtain a global view of the net-works under consideration, by running peer-to-peer clients on a number of geographically dispersed nodes in the PlanetLab infrastructure [7]. We ran peer-to-peer clients on over 50 nodes located in 18 different countries in North and South America, Europe, Asia, and Oceania. PlanetLab nodes connect to the Internet through different ISPs and different types of physical links, including broadband access (DSL).
We use MLDonkey [4] to connect to the eDonkey, eDon-key/Overnet5, and Gnutella networks, and giFT-FastTrack [2] to access the FastTrack network. The main advantage of MLDonkey and giFT-FastTrack is that both implement dae-mons, which can be accessed through telnet-based inter-faces. Hence, experiments are easily scriptable, and therefore easily repeatable. We communicated with the daemons using simple Perl clients to search and download files in all four net-works. As an aside, nodes under our control only implement leaf functionality, and cannot be used as a hub. In other words,
5MLDonkey, like the official Overnet client, requires to simultaneously
none of our nodes is a FastTrack supernode, a Gnutella ultra-peer, or an eDonkey server. Because we are more interested in how users see the network rather than considering aggregate of requests, this limitation does not affect our study.
4.2
Experimental methodology
As we mentioned earlier, active measurements are a good fit for our approach, since we want to contrast the response of the net-work depending on whether the netnet-work is subject to poisoning. In addition, the most popular items on the network are likely to be poisoned. Therefore, poisoning could account for a vast ma-jority of the traffic observed using passive measurements, ul-timately making the distinction between poisoning effects and usual network behavior difficult.
The main drawback of active measurements is that they heav-ily depend on the nature of the input we inject in the network. In other words, we have to find a set of queries that are repre-sentative enough to give us an accurate picture of the network. In an effort to cover the three main categories of content avail-able in peer-to-peer file sharing networks, we chose 15 query strings corresponding to 6 movies, 6 popular songs, and 3 pop-ular software titles. (To avoid facilitating potential copyright in-fringement, we refer to the different queries as Song 1 through 6, Movie 1 through 6, and Software 1 through 3, respectively.) In an effort to improve the quality of the search returns, we use “specialized” queries for songs and movies; that is, we restrict the possible returns to MP3 files and video files, respectively.
For each of our 15 queries, we manually verified that the item queried was not subject to poisoning (or at least, that a potentially ongoing poisoning attack had negligible effect); that is, we checked that a few “good” files could be easily found and downloaded. On the other hand, we cannot guarantee the network is not subject to pollution; in fact, we have experienced various pollution levels depending on the network and query considered, as we discuss later.
We injected the queries in each network as described in Ta-ble 2. A bug in MLDonkey causes the results of concurrent queries to be sometimes mixed, so we ran only one MLDon-key client per host, and grouped queries into three groups of five queries (2 songs, 2 movies, and 1 software distribution) each. For each group of the three groups of queries, we sent the queries from 6 hosts connected to the Gnutella network, 6 hosts connected to the eDonkey network, and 6 hosts connected to the eDonkey/Overnet network. In addition, we also issued the queries on 12 hosts connected to the FastTrack network. On each host, we repeatedly issued the queries every half-hour for 36 hours.
Last, when a peer-to-peer client is first installed and run on a host, it uses a bootstrapping mechanism that typically results in connecting to a fixed, well-known set of hubs. We attenu-ate the impact of the initial bootstrapping mechanisms on our experimental results by running the clients for several days be-fore starting to collect data. More precisely, all clients were started between November 26 and 27, 2004, and all data pre-sented in this paper was collected over December 1–5, 2004.
The length of the collection period allows us to circumvent transient and short-term effects, such as time-of-the-day depen-dency; a comparison with previous experiments we conducted over October 7–14, 2004, and which we do not report here, in-dicates that seasonal effects do not play a significant role in the set of measurements we are gathering.
4.3
Experimental results
All network properties have, to some extent, an impact on how people exchange content on peer-to-peer file sharing networks. Because we do not, in this paper, study user behavior directly, we have to find the set of network metrics that are likely to have the most impact on users’ decisions to use or instead abandon a given network. While we do not claim the metrics we select describe exhaustively all factors that condition user behavior, we focus on a set of five metrics that intuitively play a key role in how peer-to-peer users perceive a network: number of re-sponses to a query, response time to a query, content stability, content replication, and download completion time.
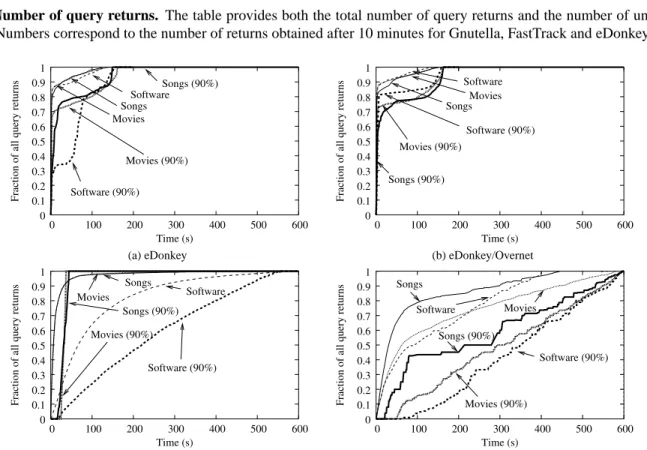
Number of query returns Table 3 provides the average num-ber of responses to our queries we obtained for each network 10 minutes after having issued the query, averaged over all songs, movies and software titles. Because a given file may be hosted on several peers simultaneously, we distinguish be-tween the total number of responses and the number of unique files returned. We make several observations. First, we had sig-nificantly more returns in eDonkey and eDonkey/Overnet than in the other networks. This does not necessarily imply that the eDonkey network has more content available than the other net-works. In fact, a more likely cause for the observed difference is that each hub in FastTrack and Gnutella indexes the contents of a much lower fraction of the total number of nodes than in eDonkey. Thus, each node in FastTrack and Gnutella has a rela-tively limited search horizon, which results in lower numbers of returns, and in the returns being more sensitive to node churn. The high variability in the observed number of query returns in FastTrack and Gnutella seems to confirm our hypothesis. In ad-dition, we notice that specialized searches (movies and songs) in FastTrack result in a low number of returns. This can be due to either high levels of pollution (specialized searches tend to filter out some of the polluted items), or to a bug in how the giFT-FastTrack daemon handles specialized searches. We need further measurements, some of which we discuss later, to clar-ify the possible causes.
Query response times Because searches are not fully cen-tralized, different query results are returned to the sender at dif-ferent times. Query results that arrive quickly are more likely to be selected for download by most users, who generally have limited patience. Hence, the distribution of the query response times (that is, the time difference between a query is issued and a specific return reaches the sender) may play an important role with respect to the users’ perception of content availability.
eDonkey eDonkey/Overnet FastTrack Gnutella
Songs Movies Software Songs Movies Software Songs Movies Software Songs Movies Software
Avg. number 648 369 790 759 473 909 32 6 348 68 186 563 of responses (Std. dev.) (292) (210) (237) (315) (236) (200) (37) (7) (291) (76) (185) (528) Avg. number 578 282 588 668 348 650 22 4 178 65 179 521 of unique files (Std. dev.) (268) (163) (166) (294) (179) (106) (23) (4) (123) (72) (178) (492) Table 3: Number of query returns. The table provides both the total number of query returns and the number of unique files returned. Numbers correspond to the number of returns obtained after 10 minutes for Gnutella, FastTrack and eDonkey.
0 0.1 0.2 0.3 0.4 0.5 0.6 0.7 0.8 0.9 1 0 100 200 300 400 500 600
Fraction of all query returns
Time (s) Songs (90%) SongsSoftware Software (90%) Movies Movies (90%) (a) eDonkey Songs 0 0.1 0.2 0.3 0.4 0.5 0.6 0.7 0.8 0.9 1 0 100 200 300 400 500 600 Time (s)
Fraction of all query returns
Songs (90%) Movies (90%) Software Movies Software (90%) (b) eDonkey/Overnet 0 0.1 0.2 0.3 0.4 0.5 0.6 0.7 0.8 0.9 1 0 100 200 300 400 500 600
Fraction of all query returns
Time (s) Songs Movies Movies (90%) Software (90%) Software Songs (90%) (c) FastTrack 0 0.1 0.2 0.3 0.4 0.5 0.6 0.7 0.8 0.9 1 0 100 200 300 400 500 600
Fraction of all query returns
Time (s) Songs Movies (90%) Software (90%) Songs (90%) Movies Software (d) Gnutella
Figure 1: Query response times. The plots describe the average (thin lines) and 90th percentile (thick lines) of the query response times (normalized over the final number of returns), for all three types of queries in the four networks under consideration.
We plot the distribution of the query response times for all four networks in Fig. 1. The thin lines in the plots show the average over all queries of each type (songs, movies, and soft-ware titles). A better indicator might be the 90th percentile of all queries (thick lines), which provides an upper bound for the query response times experienced by 90% of the queries. We observe that eDonkey and eDonkey/Overnet produce results ex-tremely quickly: after two minutes, for nearly all queries, the sender has received over 85% of all query returns. After 3.5 minutes, the network had returned virtually all responses to every query. We can explain this small response time by the highly centralized topology in eDonkey: the first server to be contacted already has most of the results available. In fact, the couple of jumps one can observe in each of the plots in Figs. 1(a) and (b) correspond to results coming from different eDonkey servers. Conversely, Gnutella seems to produce re-sults almost continuously. FastTrack also exhibits a long-tailed distribution of query response times for software titles. This
results indicates that queries are propagated to many different hubs that answer to the sender at different times. We note that FastTrack seems to respond very quickly to specialized searches (movies and songs). We speculate that the special-ized searches were not propagated to other hubs, which would explain both the low number of returns we observed in Table 3, as well as the very quick response time.
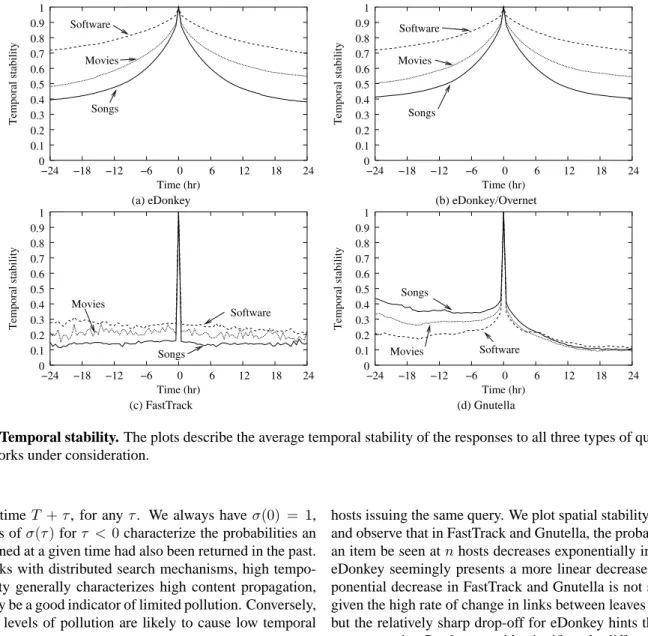
Content stability We use a time-dependent function we call temporal stability,σ, to assess how the users’ perception of the available content changes over time. Denoting byU(t)the set of query returns corresponding to unique files returned at timet, we defineσ(τ), for anyτ∈R, as
σ(τ) = P t|U(t)∩U(t+τ)| P t|U(t)∪U(t+τ)| .
In other words,σ(τ)is the average probability (averaged over all times) that an item returned at a given time T is also
0 0.1 0.2 0.3 0.4 0.5 0.6 0.7 0.8 0.9 1 −24 −18 −12 −6 0 6 12 18 24 Temporal stability Time (hr) Songs Movies Software (a) eDonkey 0 0.1 0.2 0.3 0.4 0.5 0.6 0.7 0.8 0.9 1 −24 −18 −12 −6 0 6 12 18 24 Temporal stability Time (hr) Movies Software Songs (b) eDonkey/Overnet 0 0.1 0.2 0.3 0.4 0.5 0.6 0.7 0.8 0.9 1 −24 −18 −12 −6 0 6 12 18 24 Temporal stability Time (hr) Songs Software Movies (c) FastTrack 0 0.1 0.2 0.3 0.4 0.5 0.6 0.7 0.8 0.9 1 −24 −18 −12 −6 0 6 12 18 24 Temporal stability Time (hr) Songs Movies Software (d) Gnutella
Figure 2: Temporal stability. The plots describe the average temporal stability of the responses to all three types of query in the four networks under consideration.
turned at timeT +τ, for anyτ. We always haveσ(0) = 1, and values ofσ(τ)forτ < 0characterize the probabilities an item returned at a given time had also been returned in the past. In networks with distributed search mechanisms, high tempo-ral stability genetempo-rally characterizes high content propagation, which may be a good indicator of limited pollution. Conversely, important levels of pollution are likely to cause low temporal stability.
We plot the temporal stability in all four networks in Fig. 2, and observe significant differences between the different net-works. In particular, eDonkey and eDonkey/Overnet have very high temporal stability. For instance, after 24 hours, there is a 50% chance that a given user perceives a specific movie file as still being present on the network. In contrast, two factors ap-pear to cause FastTrack to exhibit a low temporal stability: (1) leaf-hub connections change more frequently than in eDonkey, and (2) there is a much higher pollution rate in the FastTrack network. Results for Gnutella present an anomaly: judging from Fig. 2(d), content seems to be continuously disappearing from the network. In fact, we issued identical requests at a rate considered abusive by some servers, which then banned our IP addresses and stopped responding to our requests. A separate experiment, whose results we omit here, showed that sending requests every hour instead of every half hour attenuates the phenomenon.
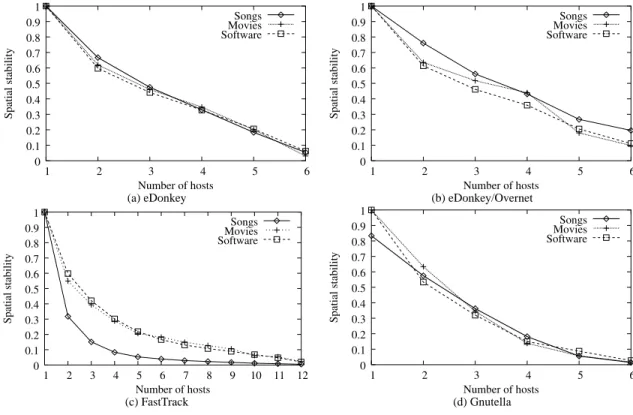
Complementary to temporal stability, we characterize spa-tial stability as the probability that a given return is obtained at least once (over the entire time of the experiment) by different
hosts issuing the same query. We plot spatial stability in Fig. 3, and observe that in FastTrack and Gnutella, the probability that an item be seen atnhosts decreases exponentially inn, while eDonkey seemingly presents a more linear decrease. The ex-ponential decrease in FastTrack and Gnutella is not surprising given the high rate of change in links between leaves and hubs, but the relatively sharp drop-off for eDonkey hints that differ-ent servers in eDonkey provide significantly differdiffer-ent returns. Indeed, the very small number of servers in eDonkey translates into a high probability that several of our hosts are connected to the same server. Hence, we would have expected the curve to remain much closer to 1 if different servers provided relatively similar results.
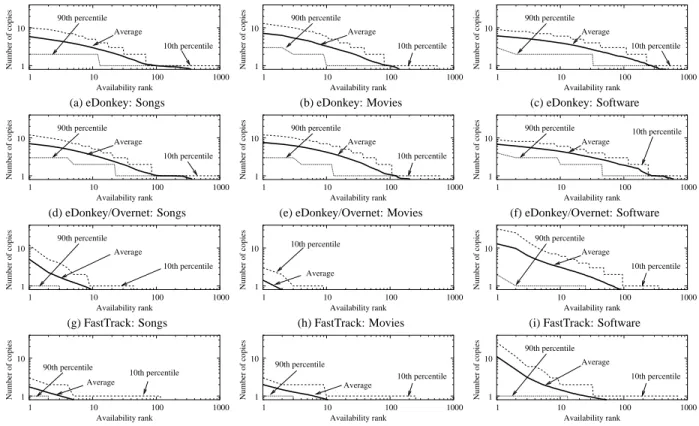
Content replication Content replication is a direct conse-quence of propagation, and is perhaps the most important rea-son behind the success of peer-to-peer networks. Indeed, highly replicated content, being served by a number of peers, is less likely to be unavailable; and, most peer-to-peer protocols use swarming downloads, which makes replicated content easier and faster to download. Thus, most peer-to-peer clients rank query returns by number of copies of a given file found in the network. Ranking items according to their degree of replication creates an hysteresis effect: users are more likely to download highly replicated items, thereby increasing the number of repli-cas available in the network.
Fig. 4 shows that, for all networks and all items, content replication roughly follows a power law. The key result here
0 0.1 0.2 0.3 0.4 0.5 0.6 0.7 0.8 0.9 1 1 2 3 4 5 6 Spatial stability Number of hosts Songs Movies Software (a) eDonkey 0 0.1 0.2 0.3 0.4 0.5 0.6 0.7 0.8 0.9 1 1 2 3 4 5 6 Spatial stability Number of hosts Songs Movies Software (b) eDonkey/Overnet 0 0.1 0.2 0.3 0.4 0.5 0.6 0.7 0.8 0.9 1 1 2 3 4 5 6 7 8 9 10 11 12 Spatial stability Number of hosts Songs Movies Software (c) FastTrack 0 0.1 0.2 0.3 0.4 0.5 0.6 0.7 0.8 0.9 1 1 2 3 4 5 6 Spatial stability Number of hosts Songs Movies Software (d) Gnutella
Figure 3: Spatial stability. The plots describe the average spatial stability of the responses to all three types of query in the four networks under consideration.
0 0.5 1 1.5 2 2.5 0 10 20 30 40 50 60 70 80 90 Time (mins) eDonkey eDonkey/Overnet FastTrack of completed downloads Average number
Figure 5: Download completion time. The graph shows the average number of files that were successfully downloaded af-ter a given amount of time, averaged over all experiments.
is that we obtain the same behavior irrespective of the net-work considered or of the type of query; plots for the 90th and 10th percentile also exhibit power-law distributions. In addition our results match observations previously made over entire net-works for FastTrack [16], and older variants of Gnutella, which did not use a two-tiered hierarchical topology, and Napster [6]. In other words, despite their limited view of the network, users have a quite accurate perception of the relative availability of different files.
Download completion time Last, we measure the total time needed to successfully complete a download. This is arguably an important metric with respect to the users’ decision to aban-don or join a peer-to-peer file sharing network.
Because, in this experiment, we download actual files, we had to use a scaled-down experimental setup. We ran a Fast-Track, an eDonkey/Overnet, and an eDonkey client6 on three machines, which, every two hours, sent a request for Song 1. After 10 minutes, our client ranked the query returns by num-ber of copies found, and attempted to download the 30 highest ranked returns. Thus, our experimental setup attempts at mim-icking the behavior of a user who launches a query, waits long enough, and tries to download all the results she sees on her screen (most clients display about 30 results per page).
We track the progress of the downloads over 90 minutes, and plot the average number of completed downloads against time, averaged over all experiment runs, in Fig. 5. We observe that, despite its relatively low temporal and spatial stability, the Fast-Track network is doing surprisingly well: at least one copy of the song has been successfully downloaded within 20 minutes. These results indicate that, as shown in [16], the FastTrack net-work is highly polluted. However, good copies are easy to find among the mostly replicated objects. In other words, replica-tion appears to be an efficient antidote to network pollureplica-tion.
eDonkey and eDonkey/Overnet seem to be lagging behind the FastTrack client, before catching up and obtaining a number of files quite quickly. This is due to the credit system used in the
Average 90th percentile 10th percentile 1 10 1 10 100 1000 Availability rank Number of copies
(a) eDonkey: Songs
Average 90th percentile 10th percentile 1 10 1 10 100 1000 Availability rank Number of copies (b) eDonkey: Movies Average 90th percentile 10th percentile 1 10 1 10 100 1000 Availability rank Number of copies (c) eDonkey: Software Average 90th percentile 10th percentile 1 10 1 10 100 1000 Availability rank Number of copies (d) eDonkey/Overnet: Songs Average 90th percentile 10th percentile 1 10 1 10 100 1000 Availability rank Number of copies
(e) eDonkey/Overnet: Movies
Average 90th percentile 10th percentile 1 10 1 10 100 1000 Availability rank Number of copies (f) eDonkey/Overnet: Software Average 90th percentile 10th percentile 1 10 1 10 100 1000 Availability rank Number of copies (g) FastTrack: Songs 10th percentile Average 1 10 1 10 100 1000 Availability rank Number of copies (h) FastTrack: Movies Average 10th percentile 90th percentile 1 10 1 10 100 1000 Availability rank Number of copies
(i) FastTrack: Software
90th percentile Average 10th percentile 1 10 1 10 100 1000 Availability rank Number of copies (j) Gnutella: Songs 10th percentile 90th percentile Average 1 10 1 10 100 1000 Availability rank Number of copies (k) Gnutella: Movies Average 90th percentile 10th percentile 1 10 1 10 100 1000 Availability rank Number of copies (l) Gnutella: Software
Figure 4: (Perceived) content replication. The plots present, in a log-log scale, the average, 90th and 10th percentiles of the number of copies found against their availability rank, for all three types of queries in the four networks under consideration. Average distributions are relatively close to power-laws.
downloading algorithm in eDonkey. Peers which upload more traffic get more credits, and can in turn download files from a larger number of peers. Such a credit system mildly penalizes newcomers, and corroborates the results we observed.
Summary of measurements We exhibited a correlation be-tween network topology and content availability. In particular, more centralized topologies such as eDonkey result in faster query response times, and higher temporal stability of the con-tent available to a client. Perceived concon-tent replication, that is, the number of copies of a given file that are found in a search initiated by a node, generally follows a power law distribution. Users’ perception of content replication thus matches measure-ments of content replication over an entire network, as reported elsewhere [6, 16]. Hence, ranking of query returns by number of replica available in the network can be an effective strategy in accommodating the modest or intermediate levels of network pollution we observed in our experiments, as evidenced by the relatively short time we needed to download a good copy.
5
Pollution and poisoning
Poisoning and pollution both result in decreasing the relative availability of usable content in the network [16]. One might expect pollution to be a mostly random process, which may be
filtered out relatively easily, for instance by ranking search re-sults by number of replicas found, as discussed in the previous section. On the other hand, poisoning should in principle be designed to ensure, with very high probability, that users al-ways end up downloading decoys. Furthermore, we expect to observe pollution with most files in the network, whereas poi-soning should be targeted to the specific files that one want to protect against distribution over a peer-to-peer network.
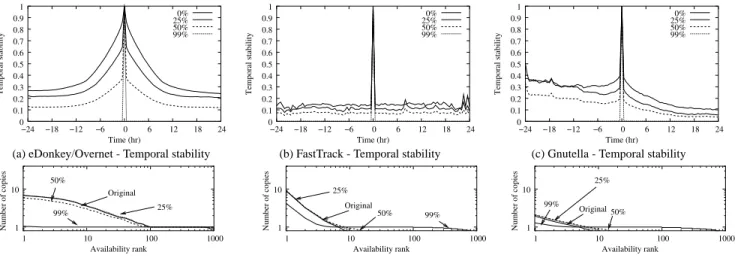
In this section we describe three possible strategies for in-jecting decoys (or bad files) in a peer-to-peer network: injection of random decoys, injection of replicated decoys, and injection of replicated transient decoys. We characterize each strategy and show its effect on content availability, by considering how each strategy impacts temporal stability and number of replicas found. To that effect, we simulate each strategy on the mea-surements we obtained in the previous section for Song 1. We chose Song 1 because it presents typical (i.e., relatively close to the average) characteristics in the absence of poisoning, but point out that the results are mostly independent of the specific query we use in our simulations.
Random decoy injection The first strategy we consider con-sists in randomly injecting decoys in the network. That is, we assume that a set of hosts advertise files that are in fact decoys, and frequently change the contents of the decoys. At low
0 0.1 0.2 0.3 0.4 0.5 0.6 0.7 0.8 0.9 1 −24 −18 −12 −6 0 6 12 18 24 Temporal stability Time (hr) 0% 25% 50% 99%
(a) eDonkey/Overnet - Temporal stability
0 0.1 0.2 0.3 0.4 0.5 0.6 0.7 0.8 0.9 1 −24 −18 −12 −6 0 6 12 18 24 Temporal stability Time (hr) 0% 25% 50% 99%
(b) FastTrack - Temporal stability
0 0.1 0.2 0.3 0.4 0.5 0.6 0.7 0.8 0.9 1 −24 −18 −12 −6 0 6 12 18 24 Temporal stability Time (hr) 0% 25% 50% 99%
(c) Gnutella - Temporal stability
Original 99% 50% 25% 1 10 1 10 100 1000 Availability rank Number of copies
(d) eDonkey/Overnet - (Perceived) content replication
Original 25% 99% 50% 1 10 1 10 100 1000 Availability rank Number of copies
(e) FastTrack - (Perceived) content replication
99% 50% Original 25% 1 10 1 10 100 1000 Availability rank Number of copies
(f) Gnutella - (Perceived) content replication Figure 6: Random decoy injection. The plots describe the effect of randomly injecting decoys on the temporal stability and content replication of each network, for various levels ranging from mild pollution to aggressive poisoning.
els of injection, such a strategy is in fact a good approximation of network pollution, if we make the assumption that polluted copies do not propagate.7
At high levels, such a strategy may seem at first glance a rather inefficient way of poisoning an item. Indeed, flooding the network with random decoys does not, in itself, change the availability of usable files in the network. Hence, the decoys should be easy to filter out using a simple technique such as ranking search results by number of replicas found.
While this reasoning is generally true when the number of injected random decoys remains low, at high levels, we have to take into account the fact that peer-to-peer networks limit the number of returns a given query can yield. For instance, FastTrack supernodes never send more than 200 returns at a time, and can only be queried five times in a row, for a total of at most 1,000 results. Injecting a massive number of random decoys may therefore prevent usable files from appearing in the search results.
Figure 6 shows the effect of random decoy injection in the networks, for different levels of injection (0%, 25%, 50%, and 99%). We limit the number of possible query results to 2,000. We observe that while random decoy injection significantly lowers temporal stability, it does not affect content replication unless the injection level is extremely high. Fig. 6(c) shows that, even at high injection levels, content replication is only affected when the number of decoys injected in the network is high enough to drive usable files out of the search results.
Thus, random decoy injection requires the injection of mas-sive quantities of decoys in the network to be an effective poi-soning technique. For example, for an item that returns on aver-age 100 results, one would need to inject around 9,900 decoys in the network. In fact, to successfully poison the item over the entire network, one might need to inject as many as 9,900
de-7Even though this assumption is unlikely to perfectly hold, propagation of
polluted files is likely to be relatively limited, as we expect most users would delete the file once they realize the file is unusable.
coys at each hub. While not technically infeasible, the solution is likely to be expensive and to require a massive infrastructure, which may be impractical. In addition, in highly centralized networks such as eDonkey, such a massive injection of decoys from a number of limited sources may be very easy to detect.
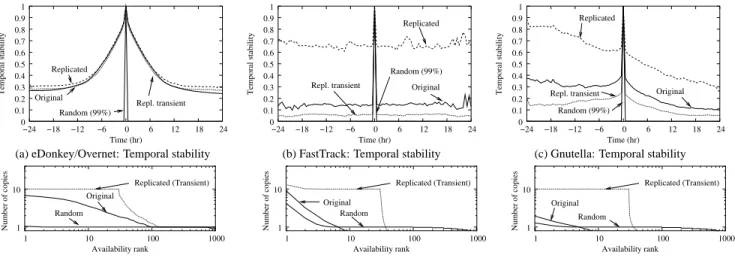
Replicated decoy injection Instead, one may consider to in-stead inject numerous replicas of the same decoy. Such a tech-nique has the advantage of guaranteeing a high ranking in the search results for the injected decoy, thereby leading the decoy to be frequently downloaded. Of course, the injection of a sin-gle, highly replicated decoy is relatively easy to detect, so that one may improve the poisoning by injecting many replicated decoys. Liang et al. report that such a technique is used for poisoning some items in the FastTrack network [16].
This technique is less costly that a brute-force random decoy injection. Indeed, judging from the content replication mea-surements we obtained in the previous section, one would need to inject about 10 replicas per decoy, and about 30–40 decoys, for a total of 300–400 files per hub, to significantly skew the ranking of the search results in favor of the decoys. However, such a poisoning can be easily counterbalanced by a simple rep-utation system that tells users if a given file is likely to be a decoy; for instance, the Jugle eDonkey FakeCheck service [3] provides such a reputation service. One can in turn defeat the reputation system by either compromising it (which may not be easy), or by frequently replacing the replicated decoys in-jected in the network. We refer to this poisoning technique as replicated transient decoy injection.
We compare the effect of the three poisoning techniques we discussed in Fig. 7: 99% random decoy injection completely destroys temporal stability, and the perception the clients have from content replication. Replicated, and replicated transient decoy injection manage to significantly skew the perceived con-tent replication; in addition, replicated transient decoy injection avoids significantly changing the temporal stability properties
0 0.1 0.2 0.3 0.4 0.5 0.6 0.7 0.8 0.9 1 −24 −18 −12 −6 0 6 12 18 24 Temporal stability Time (hr) Original Random (99%) Replicated Repl. transient
(a) eDonkey/Overnet: Temporal stability
0 0.1 0.2 0.3 0.4 0.5 0.6 0.7 0.8 0.9 1 −24 −18 −12 −6 0 6 12 18 24 Temporal stability Time (hr) Replicated Repl. transient Random (99%) Original
(b) FastTrack: Temporal stability
0 0.1 0.2 0.3 0.4 0.5 0.6 0.7 0.8 0.9 1 −24 −18 −12 −6 0 6 12 18 24 Temporal stability Time (hr) Replicated Original Random (99%) Repl. transient
(c) Gnutella: Temporal stability
Random Original Replicated (Transient) 1 10 1 10 100 1000 Availability rank Number of copies
(d) eDonkey/Overnet: (Perceived) content replication
Replicated (Transient) Original Random 1 10 1 10 100 1000 Availability rank Number of copies
(e) FastTrack: (Perceived) content replication
Replicated (Transient) Random Original 1 10 1 10 100 1000 Availability rank Number of copies
(f) Gnutella: (Perceived) content replication Figure 7: Poisoning effects. The plots provide a comparison of the different poisoning techniques with respect to temporal stability and perceived content replication. Note that replicated decoys and replicated transient decoys have the exact same effect on perceived content replication.
of each network, which makes such a poisoning strategy hard to detect. In fact, except for deliberately including misspellings in metadata information to escape poisoning, we are not aware of any deployed mechanism that would currently circumvent replicated transient decoy injection. However, a more elabo-rate reputation system, which weighs the reputation of a file by the time it has been present in the network could be useful in limiting the impact of a replicated transient decoy injection.
Last, we note that the above poisoning techniques are not mutually exclusive. A poisoning attack on a file, that, for in-stance, combines injection of random decoys at a level of 80%, with the injection of a few replicated transient decoys, would likely be difficult to detect, and could lead to significantly de-creasing the content availability of the targeted file.
6
Conclusions
We have provided a measurement-based analysis of content availability in peer-to-peer networks. We have shown that the topology of the peer-to-peer network plays a crucial role in how each peer perceives the network. Specifically, we have defined the notion of temporal stability, and have shown that more cen-tralized topologies, such as used by eDonkey, generally had a better temporal stability than more distributed networks, such as FastTrack or Gnutella. In addition, we confirmed that cen-tralized topologies tend to return query results faster.
We showed that (perceived) content replication generally fol-lows power-laws. Consequently, we showed that ranking query results by the number of copies found in the network was effec-tive in dealing with moderate to intermediate levels of network pollution. We also discussed possible strategies that copyright holders may use to prevent the propagation of copyrighted ma-terial, and, notably item poisoning. We showed that, to be an effective technique for reducing the availability of content on
the network, randomly injecting decoys of popular files needs needs to be done on a massive scale and may be easy to detect in highly centralized peer-to-peer networks. On the other hand, the injection of a few replicated decoys can lead to significant perturbations in the network as well, while being much more cost-efficient.
We see two main avenues for our future work on the subject. First, we are interested in precisely determining the statistical characteristics of network pollution. In this paper, we reduced pollution to a random injection of bad files. However, studies of user behavior show that a vast number of users are vastly un-aware of the files they share [10]. As such, one would expect polluted items to accidentally propagate, which we could deter-mine by deliberately injecting bad copies of a file and tracking their progress in the network. Second, we focused on the net-work metrics which, we believe, play an important role in user behavior with respect to peer-to-peer file sharing usage. We plan on conducting laboratory experiments with human sub-jects to get a better characterization of user behavior in face of pollution and poisoning.
Peer-to-peer file sharing is a reality, and copyright holders seem to have, at least partially, accepted the limitations of legal recourses. Hence, we are starting to observe a technological arms’ race between peer-to-peer network designers and copy-right holders. The former want to make their networks as ro-bust as possible, that is as immune as possible to poisoning and pollution, while the latter want to disrupt availability of copy-righted contents. This is one of the “tussles” Clark et al. were envisioning in [8], one which we believe will have significant economic impact in the years to come.
References
[1] A&M Records et al. v. Napster. United States Court of Appeals for the 9th Circuit, Case Number: 00-16401. February 12, 2001. [2] giFT: Internet File Transfer - FastTrack plug-in. Available fromhttp://gift-fasttrack.berlios.de/. See also
http://gift.sourceforge.net.
[3] Jugle real-time fake check for eMule and eDonkey. http:// www.jugle.net.
[4] MLDonkey, a multi-networks file-sharing client. Avail-able fromhttp://savannah.nongnu.org/projects/ mldonkey/.
[5] R. Bhagwan, S. Savage, and G. Voelker. Understanding avail-ability. In Proceedings of the 2nd International Workshop on Peer-to-Peer Systems (IPTPS’03), pages 256–267, Berkeley, CA, February 2003.
[6] J. Chu, K. Labonte, and B. Levine. Availibility and locality mea-surements of peer-to-peer filesystems. In Scalability and Traffic Control in IP networks II. Proceedings of SPIE, volume 4868, pages 310–321, Boston, MA, July 2002.
[7] B. Chun, D. Culler, T. Roscoe, A. Bavier, L. Peterson, M. Wawr-zoniak, and M. Bowman. PlanetLab: an overlay testbed for broad-coverage services. ACM Computer Communication Re-view, 33(3):3–12, July 2003.
[8] D. Clark, J. Wroclawski, K. Sollins, and R. Braden. Tussle in cy-berspace: defining tomorrow’s Internet. In Proceedings of ACM SIGCOMM’02, pages 347–356, Pittsburgh, PA, August 2002. [9] B. Cohen. Incentives build robustness in BitTorrent. In
Pro-ceedings of the First Workshop on the Economics of Peer-to-Peer Systems, Berkeley, CA, June 2003.
[10] N. Good and A. Krekelberg. Usability and privacy: a study of KaZaA P2P file-sharing. In Proceedings of ACM CHI 2003, pages 137–144, Fort Lauderdale, FL, April 2003.
[11] K. Gummadi, R. Dunn, S. Saroiu, S. Gribble, H. Levy, and J. Za-horjan. Measurement, modeling, and analysis of a peer-to-peer file-sharing workload. In Proceedings of ACM SOSP’03, pages 314–329, Bolton Landing, NY, October 2003.
[12] J. Hale and G. Manes. Method to inhibit the identification and retrieval of proprietary media via automated search engines uti-lized in association with computer compatible communications network, May 2004. US Patent nr. 6,732,180.
[13] T. Karagiannis, A. Broido, N. Brownlee, kc claffy, and M. Faloutsos. Is P2P dying or just hiding? In Proceedings of IEEE Globecom 2004, Dallas, TX, November 2004.
[14] F. Le Fessant, S. Handurukande, A.-M. Kermarrec, and L. Mas-souli´e. Clustering in peer-to-peer filesharing workloads. In Pro-ceedings of the 3rd International Workshop on Peer-to-Peer Sys-tems (IPTPS’04), San Diego, CA, February 2004.
[15] J. Liang, R. Kumar, and K. Ross. The KaZaA overlay: a measurement study. Polytechnic University Working Paper. Available fromhttp://cis.poly.edu/˜ross/, Septem-ber 2004.
[16] J. Liang, R. Kumar, Y. Xi, and K. Ross. Pollution in P2P file sharing systems. Polytechnic University Working Paper. Avail-able fromhttp://cis.poly.edu/˜ross/, July 2004.
[17] B.-T. Loo, R. Huebsch, I. Stoica, and J. Hellerstein. The case for a hybrid P2P search infrastructure. In Proceedings of the 3rd In-ternational Workshop on Peer-to-Peer Systems (IPTPS’04), San Diego, CA, February 2004.
[18] P. Maymounkov and D. Mazi`eres. Kademlia: A peer-to-peer information system based on the XOR metric. In Proceed-ings of the 1st International Workshop on Peer-to-Peer Systems (IPTPS’02), pages 53–65, Cambridge, MA, February 2002. [19] F. Oberholzer and K. Strump. The effect of file sharing on
record sales: an empirical analysis. University of North Car-olina at Chapel Hill Working Paper. Available from http: //www.unc.edu/˜cigar/strumab.htm, March 2004. [20] S. Saroiu, K. Gummadi, R. Dunn, S. Gribble, and H. Levy. An
analysis of Internet content delivery systems. In Proceedings of USENIX OSDI’02, pages 156–170, Boston, MA, December 2002.
[21] S. Saroiu, K. Gummadi, and S. Gribble. A measurement study of peer-to-peer file sharing systems. In Proceedings of SPIE/ACM MMCN’02, pages 156–170, San Jose, CA, January 2002. [22] S. Sen and J. Wang. Analyzing peer-to-peer traffic across large
networks. In Proceedings of the 2nd ACM SIGCOMM Workshop on Internet Measurment (IMW’02), pages 137–150, Marseille, France, November 2002.
[23] K. Tutschku. A measurement-based traffic profile of the eDon-key filesharing service. In Proceedings of the 5th Passive and Active Measurement Workshop (PAM’04), pages 12–21, Juan-les-Pins, France, April 2004.
[24] A. Zentner. Measuring the effect of music downloads on mu-sic sales. University of Chicago Working Paper. Available from