Risk-sharing among
European Countries
M. Nardo, F. Pericoli, P.Poncela
This publication is a Technical report by the Joint Research Centre (JRC), the European Commission’s science and knowledge service. It aims to provide evidence-based scientific support to the European policymaking process. The scientific output expressed does not imply a policy position of the European Commission. Neither the European Commission nor any person acting on behalf of the Commission is responsible for the use that might be made of this publication.
JRC Science Hub https://ec.europa.eu/jrc
JRC109598 EUR 28934 EN
PDF ISBN 978-92-79-77063-0 ISSN 1831-9424 doi: 10.2760/028526
Luxembourg: Publications Office of the European Union, 2017 © European Union, 2017
Reuse is authorised provided the source is acknowledged. The reuse policy of European Commission documents is regulated by Decision 2011/833/EU (OJ L 330, 14.12.2011, p. 39).
For any use or reproduction of photos or other material that is not under the EU copyright, permission must be sought directly from the copyright holders.
How to cite this report: Nardo, M., Pericoli, F. and Poncela, P., Risk-sharing among European Countries, EUR 28934 EN, Publications Office of the European Union, Luxembourg, 2017, ISBN 978-92-79-77063-0, doi 10.2760/028526, PUBSY No JRC109598.
All images © European Union 2017.
Contents
Foreword ... 2
Abstract ... 3
1 Executive summary ... 4
2 Introduction ... 7
3 The channels of risk-sharing ... 9
3.1 The estimated model ... 11
3.2 The data ... 13
4 Results ... 14
4.1 Target group: EU15 ... 14
4.2 Target group EU15: sub-sample analysis ... 17
4.3 A closer look to Ireland ... 19
4.4 Target group: EU28 ... 21
5 Relative performance of countries ... 24
6 Conclusions ... 27
References ... 29
List of figures ... 30
List of tables ... 31
Foreword
This report details the final estimations about the degree of risk sharing that European countries actually displayed both before and after the 2008 crisis. It is the final delivery of the Administrative Arrangement FISMA/2016/086/B2/ST/AAR.
Authors
Michela Nardo, Joint Research Centre, European Commission. Filippo Pericoli, Joint Research Centre, European Commission. Pilar Poncela, Joint Research Centre, European Commission.
Abstract
This technical report details the results of risk sharing in the EU country by country. The great recession and the subsequent sovereign debt crisis in Europe have shown an asymmetric behavior of the different member countries of the EU, also with regards of risk sharing. We provide country specific measures decomposing risk sharing as that obtained via the capital markets, international transfers and savings or the credit markets channel. Afterwords, we use a mean group estimator to measure average risk sharing for the group of countries. This can help to identify where risk sharing is working and through which channels.
1
Executive summary
1The Five Presidents’ Reports (2015), and more recently the Investment Plan for Europe (2016) claim the need for mechanisms and institutions capable of absorbing the impact of economic shocks across states and regions and achieve an effective risk-sharing across European countries. One of these mechanisms is the Capital Markets Union aimed at promoting cross-border links and cross-ownership of productive assets. The possibility to receive interests or dividends from investments made abroad or to earn profits from activities undertaken in other countries allows, in hard times, to reduce the volatility in disposable income that would otherwise occur, hereby, sustaining domestic consumption and investments. International risk sharing therefore focuses on the cross border channels at work in smoothing income and consumption when a country is hit by an output shock. We follow the international literature and use the term risk-sharing to identify the 3 channels through which shocks to GDP are cushioned: 1) the capital markets channel, capturing private cross-border links; (2) the government channel, capturing international public transfers; and (3) the credit markets channel also affected by domestic (fiscal) policies. A disclaimer is needed: 2 of these channels (the capital market and the government channel) imply only cross border links and, therefore, the possibility to share domestic risks with other countries. The third channel (credit market) captures all the policies affecting gross savings (e.g. domestic fiscal policies, and international capital transfers) mixing pure domestic smoothing with cross-border effects taking place through net borrowing and lending from the rest of the world. This decomposition comes from the system of National Accounts and is limited by its structure.
In an ideal world of perfect risk sharing, countries are completely insured against bad events, and domestic consumption growth is independent from domestic output growth. In practice, this is hardly the case. If in the US three quarters of shocks to per capita GDP of individual states are absorbed (smoothed), Europe is lagging far behind and in spite of the recent recuperation that can be measured including data up to 2016, still more than 60% of GDP idiosyncratic shocks remain unsmoothed, i.e. directly transmitted to domestic consumption. This very high average figure yet can hide highly heterogeneous patterns across countries. In this report we provide country measures of risk sharing for all the EU countries. Our measures are based on estimations using a variety of models, from those customarily used in the literature to the more recent dynamic approach to take into account, among other things, the interdependence of the channels.
1 The content of this report does not reflect the official opinion of the European Union. Responsibility for the information and views expressed therein lies entirely with the authors.
Our findings are the following:
• In line with the literature, the bulk of risk sharing takes place through the credit markets (saving) channel in all EU28 countries. The credit markets channel smooths more than 50% of the shocks in some countries, being an important buffer for output shocks especially in Ireland, Sweden, Finland, Greece and Belgium (sample 1960-2016). A subsample analysis (1999-2016) reveals that this channel has had a reduced incidence in several countries (e.g. Sweden and Belgium) after the introduction of the euro.
• For several countries (among them Italy and Portugal), we find that the credit market channel acted as shock amplifier during the recent 2008 crisis and subsequent sovereign debt crisis, provoking a certain degree of dis-smoothing (the shock not only is transmitted to consumption but that channel induces additional consumption drop). .
• Risk sharing has greater effects in small open economies: Sweden is able to smooth about 3 times more than Germany and UK in the first subsample.
• Risk sharing through international public transfers is almost non-existent for all periods and countries analysed.
• Capital markets risk sharing remains very low for all subsets of countries and periods considered. Nevertheless, it increased its role in recent times, especially in the Baltic countries and Ireland.
• Luxembourg and Malta also emerge as achieving high quotas of risk sharing, especially through the capital and credit markets channels. This reflects their roles of financial hubs.
Our findings suggest a number of general issues relevant for policy making:
1. Both, the interactions of the channels as well as their dynamic behavior should be taken into account for policy recommendations. As for the first, the analysis we provide relies on estimates of risk sharing on impact, that is, contemporaneous to the shock. This is when most of risk sharing takes place. However, analysing the dynamic aspects of risk sharing, the picture may change: after an initial positive smoothing following a GDP shock, we find, for some countries, a dis-smoothing in the credit channel in the subsequent years.
2. The interaction between channels needs to be considered when designing policies targeted to a single channel. Our analysis shows that when there is an interaction between channels they act mainly as substitutes: policies positively affecting the
capital channel may produce negative (dis-smoothing) effects in the credit channel. Whether the substitution effects also hold for the government channel needs to be analysed.
3. From the country-specific analysis emerges that in Europe risk sharing is mainly confined to small and open economies as in larger countries the scale of cross-border risk sharing is relatively small as compared with the size of the economy. 4. The highest positive figures for the capital markets channel are obtained in Ireland and
the Baltic countries. In spite of having the same label, risk-sharing, the situation is totally different in these two examples. In the Baltic countries, the banking union was the mechanism at work to smooth the shocks: by transferring funds to their subsidiaries in Lithuania, Latvia and Estonia, foreign owned banks (mainly Finnish and Swedish) acted as shock absorbers allowing the Baltic citizens to smooth their consumption during the negative GDP shocks of the latest crisis. On the contrary, in Ireland, we find smoothing of positive GDP shocks: foreign owned companies that moved their headquarters to Ireland for tax purposes, contributed to high positive GDP growth. A substantial part of this growth, however, was redirected back in the form of outflows of equity income provoking the smoothing of positive GDP growth. Risk sharing is therefore a stabilizer that works both ways: for negative as well as for positive shocks.
5. The size of the shocks experienced by each country is very different and deserves careful evaluation. The volatility of idiosyncratic GDP for Ireland and Greece is 10 and 8 times, respectively, that of more stable countries, like France, Belgium or the Netherlands. This implies that not all the countries had the same needs in terms of risk sharing. We find that, for European countries, the size of the shock is not related to the size of the economy while the degree of risk-sharing is. Our findings point to an effective role of risk sharing in small countries only: being small and open though necessary is not a sufficient condition to profit from risk sharing.
2
Introduction
International risk sharing focuses on the cross-border channels at work for smoothing income and consumption when a country is hit by an output shock. In hard (good) times, the possibility to receive or distribute interests or dividends from investments made abroad or to earn profits form activities undertaken in other countries allows reducing the fluctuations in disposable income that would otherwise occur, hereby, stabilizing domestic consumption and investments and, finally, supporting growth.
Clearly, the capability of a system of countries to share risks not only depends on the cross-border mechanisms which attenuate fluctuations of disposable income but also on the domestic pattern of savings influenced, among other things, by country specific fiscal policies. The literature proposes three channels for sharing risks in case of idiosyncratic GDP shocks: the capital markets channel, the government or fiscal channel (also known as public risk sharing) and the credit markets channel. Whereas the first two channels are only dealing with cross-border transactions, the third mixes cross-border transactions with domestic smoothing (see next section) and can be seen as the part of consumption smoothing achieved through public and private dis-saving. We are fully aware of the ambiguity of these definitions rooted in the categorization of national accounts items, but we stick to this labelling following a well-established literature and denote the channels as capital markets, government and credit markets channels.
In an ideal world of perfect risk sharing, where countries are completely insured against output shocks, domestic consumption growth will be orthogonal (hence, independent) to idiosyncratic or country specific output growth. In practice, this is rarely the case. Even in well-functioning monetary unions like the US, evidence suggests that one quarter of shocks to per capita GDP of individual states remains unsmoothed (Asdrubali et al., 1996). We find that in the Euro Area and the European Union more than 60% of GDP idiosyncratic shocks remain unsmoothed. This very high average figure, however, can hide highly heterogeneous patterns across countries that deserve further investigation. Anecdotic evidence, in fact, suggests that the 2008 recession and the subsequent sovereign debt crisis in Europe led to an asymmetric risk sharing of the different EU member states. Kalemli-Ozcan et al. (2014), for instance, link the recent downfall in risk sharing of peripheral European Union (EU) countries (Portugal, Italy, Ireland, Greece and Spain) to the fact that their governments did not save during the expansionary phases of the business cycle and were not able to borrow on the international markets during the crisis due to the high levels of outstanding public debt.
The idea of country specific risk sharing was first introduced by Mélitz and Zumer (1999) and further developed in Sørensen, Wu, Yosha and Zhu (2007). However, as Asdrubali, Kim, Pericoli and Poncela (2017) point out, these authors focus on interaction effects with country specific explanatory variables and not on country specific estimates per-se of risk sharing. Our aim, therefore, is to fill this gap providing an individual characterization of risk sharing for each of the channels and each country of the EU and several subsets within it. As in Asdrubali et al. (2017), we measure country specific risk sharing, but we focus on the countries in the EU, instead of the set of OECD countries. We also capture the change in risk sharing due to more recent turbulent times, providing a subsample analysis, whenever data availability allows. We estimate a variety of models, generalizing the results shown in the policy report “Risk sharing in Europe” by Poncela, Pericoli, Manca and Nardo (2016). The interested reader should refer to it for the general setup to measure static and dynamic risk sharing, the notation, the exact definitions, the estimation methods and the pros and cons of each estimation strategy. However, instead of considering the countries as homogeneous, we allow for country heterogeneity as in Asdrubali et al. (2017), where the reader is referred for the general set up of country heterogeneity in risk sharing.
3
The channels of risk-sharing
Following the structure of national accounts, Asdrubali et al. (1996) defined three channels for risk sharing (or, equivalently, consumption smoothing): the capital markets channel, the government channel and the credit markets channel. They start from the following identity:2
=
where GDP stands for Gross Domestic Product, GNI for Gross National Income, GDI for Gross Disposable Income and C for Consumption. Manipulating the identity (for details, see Poncela et al. 2016) one obtains workable expressions for the three channels:
Δlog(GDP) − Δlog(GNI) = , + Δlog(GDP) + (1)
Δlog(GNI) − Δlog(GDI) = , + Δlog(GDP) + (2)
Δlog(GDI) − Δlog(C) = , + Δlog(GDP) + (3)
Δlog(C) = , + Δlog(GDP) + (4)
Equation (1)is employed to identify the capital markets channel and is based on the
difference between Gross Domestic Product and Gross National Income. It corresponds to national accounts’ Net Factor Income (NFI) category and accounts for two types of transactions between residents and non-residents:
• Income from work: compensations to national employees working abroad. Migrants are excluded if living in the foreign country for more than one year.
• Income from property or investments: rents, interests and profits, including retained earnings. It includes factor income from abroad gained from properties (e.g. buildings, shops, factories, financial assets like bonds and shares in foreign countries) and earning, thereby, rents and interests. The item also includes
2 From the System of National Accounts the following identities hold: GNI = GDP + primary incomes receivable from the rest of the world - primary incomes payable to the rest of the world. GDI=GNI + current transfers receivable from the rest of the world - current transfers payable to the rest of the world. S=GDI - final consumption expenditure.
profits earned from entrepreneurial activities of goods and services production. It covers income from foreign direct investments, portfolio investment incomes and other investment incomes, and includes payments on debt securities (interests) and on equity securities (dividends). Notice that capital gains and losses coming from buying or selling activities/securities do not pertain to this channel since they are classified as part of the value of the investments (and included in the credit channel).
To get a flavour of the importance of each type of transaction on cross border smoothing through the capital markets channel, The Quarterly Report on the Euro Area (2016) estimated for a group of 13 countries3 belonging to the euro area, that only 0.2% of shocks were smoothed through cross-border labour compensation, out of the 5.6% of total shocks smoothed through this channel, indicating that most of the risk sharing achieved through this channel was due to income from property or investments.
Equation (2) is used to identify the fiscal or government channel (or public
risk-sharing) and is based on the difference between Gross Disposable Income and Gross National Income, i.e. Net International Transfers (NIT). It includes transfers made by a resident entity to a non-resident entity without an economic counterpart. It includes general government transfers (transfers between governments and international cooperation entities) such as cash transfers between governments in order to finance current expenditures; gifts of food, international aid for earthquakes or natural disasters; gifts on military equipment and regular contributions paid by governments to international organizations and vice versa. Included here are also transfers between governments and non-residents other than governments and international organizations. For instance, current taxes on income or social security contributions between a government and non-residents are included here. Certain classes of cross-border transfers made between private sectors are also recorded in this category and include workers’ remittances by migrants (staying in the foreign country for more than one year) and international transfers between private entities aimed to alleviate poverty and the consequences of natural disasters.
Equation (3) represents the credit markets channel and is based on the difference
between Gross Disposable Income and Consumption. This difference is the balancing item in the system of national accounts that corresponds to gross savings. It comprises not only household savings, but also corporate and government savings. This category includes net lending/borrowing to/from the rest of the world plus gross capital formation and net capital transfers to the rest of the world. Capital transfers are defined as transfer of the ownership
of an asset (other than inventories and cash), or the cancellation of a liability by a creditor, without any counterpart being received in return. They cover capital taxes, investment grants and other capital transfers. Notice that this channel has also a domestic connotation, through the gross capital formation, since agents can smooth consumption by borrowing and lending in international markets but also, for instance, by investing less. This channel therefore covers both national and international smoothing effects.
Finally, equation (4), relating consumption to GDP, measures the fraction of domestic shocks that is directly transmitted to domestic consumption, hence, remains unsmoothed and, therefore 1- measures the total amount of smoothed shocks. If = 0, there will be full risk sharing, whereas if > 0, domestic output shocks are at least partially passed to consumption. In the extreme case of > 1, GDP shocks are amplified rather than smoothed.
Each of the estimated parameters , , in the equations (1) to (3) represents the amount of risk sharing (in percentage to 1) that takes place through the capital, government and credit channels, respectively. Alternatively, 1- , the total amount of risk sharing can also be given by the sum of percentage smoothed through each one of the channels, that is, + + . Notice that we could have negative estimated betas, meaning that the associated channel does not contribute to consumption smoothing but rather amplifies consumption volatility in response to GDP shocks.
3.1
The estimated model
We have estimated equations (1) to (3) for the whole data set as well as country by country. The estimation with the whole data set will give an idea of the average risk sharing for the set of countries for homogeneous countries. The estimation, country by country, allows capturing the heterogeneity across the different economies and will give a characterization of the structure of risk sharing across the set of countries considered. We have used a variety of models, from the most popular ones used in the literature up to most sophisticated versions that take into account the dynamic nature of the problem as well as the possible issue of bidirectionality (both, Y causes X and X causes Y) in equations (1) to (3).4
We have estimated equations (1) to (3) by Least Squares (LS) methods both from a static and a dynamic perspective. We have done this as a robustness check since the static approach is the usual in the literature. We have run our estimations for the full sample of countries with the largest available time span. However, for long samples and/or sets of
heterogeneous countries, the hypothesis of constant parameters could be difficult to maintain, so we have also estimated country specific parameters. We have considered each equation in isolation as well as the estimation of equations (1) to (3) as a system (SURE) using panel techniques with time fixed effects and errors following an autoregression of order 1 to capture the main dynamics in the data. Alternatively, we have estimated a fully-fledged dynamic model which is a variation of the basic set up described in Poncela et al. (2016). It is based on a dynamic panel approach where, instead of pooling all the information relative to the countries, we estimate the following system of equations for each country:
, = , + , , + , , + ⋯ + , , + , (5)
For each country i and each time period t, , is the 4 × 1 vector
, =
−
−
−
i t i t i t i t i t i t i tC
GDI
GDI
GNI
GNI
GDP
GDP
,, is the 4x1 vector of intercepts, ,, j=1,…,p; i=1,…,N are 4 × 4 matrices of coefficients,
and , is multivariate white noise. In this setting and according to the literature (i.e.,
Asdrubali and Kim, 2004) the shock is originated via the error term , and transmitted to
the whole system.
Notice that equation (5) is analogous, in compact notation, to the system of equations (1) to (3) plus an equation describing GDP dynamics and the addition of a certain number of past values of the dependent variable ,. Past values are inserted to capture the long-lasting effects of each channel, i.e. effects that could take place some periods after the shock actually hits the country. In so doing we are able to see when a given channel acts/stops smoothing consumption, if a channel is activated immediately after the shock or if it affects the economy only with some delay. Within this methodology we compute the effect of the GDP shock to the system.
3.2
The data
The annual data used for the country-specific analysis are coming from National Accounts statistics (AMECO5) covering the timespan 1960-2016. Data on GDP, net factor income (NFI=GDP-GNI), net international transfers (NIT=GNI-GDI) and savings (S=GDI-C) are transformed in growth rates.
Idiosyncratic GDP reflects that the behaviour of each country’s domestic output can be different from the average6 of a group of countries, the target group. We compute idiosyncratic values for all the variables in the analysis. We analyse two groups of target countries:
1. European Union 157 (EU15). This choice is only due to data availability, larger for this set of countries. As robustness check we repeat the estimation eliminating Luxembourg due to its very volatile behavior. We estimate the model for the whole time span as well as for the two sub-samples 1960-1998 and 1999-2016, to highlight the effects of the recent sub-prime and sovereign crises. 2. European Union countries (EU28). As a robustness check, we also repeat the
estimations excluding from the analysis Croatia that entered the EU in 2013, Luxembourg, which exhibits a very volatile behavior and the smallest EU countries (Slovenia, Malta, and Cyprus). Lack of data prevents the estimation of sub-samples and we limit our sample size to the period 1995-2016.
To interpret the results, we set to 100 the contemporaneous effect of a shock on GDP, and report the fraction smoothed through each channel. Notice that this normalization is done for each country. Then, the numbers that appear in the tables should be taken as the percentage of idiosyncratic shocks that each country is able to smooth through the different channels.
5The annual macro-economic database is compiled by DG ECFIN
(https://ec.europa.eu/info/business-economy-euro/indicators-statistics/economic-databases/macro-economic-database-ameco_en).
6 The average is weighted to reflect the importance of each county in the target group (see, Beyer, Doornik, and Hendry, 2001, for the exact method of calculating the aggregates).
7 Austria, Belgium, Denmark, France, Germany, Greece, Ireland, Italy, Netherlands, Portugal, Spain, Sweden
4
Results
4.1
Target group: EU15
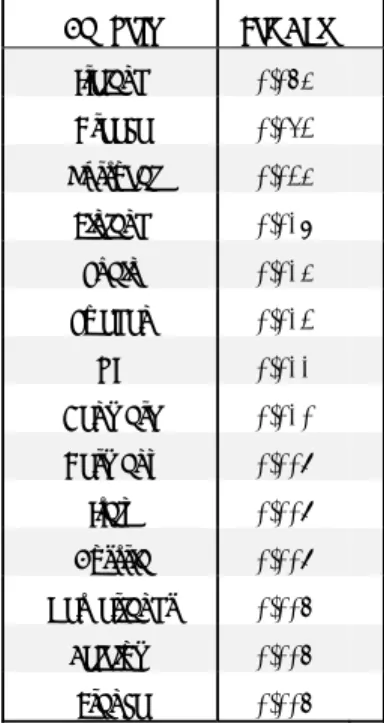
Table 1 displays the average risk sharing achieved by each country in the period 1960-2016. We present the results from 2 estimation methods for risk sharing, considering the channels jointly in a regression framework (SURE estimation) and adding the dynamic behavior to the joint estimation of risk sharing through the 3 channels (VAR estimation). SURE estimation, common in the literature, constitutes the benchmark when comparing the fully dynamic VAR approach. In the ideal case of full risk sharing among the countries in the sample, the shock to idiosyncratic GDP should not be transmitted to domestic consumption thanks to cross-border smoothing. The column Total represents the percentage of GDP shocks that is overall smoothed or, in other terms, not transmitted to domestic consumption (e.g. for Ireland is 63%, with the SURE estimation), while the remaining columns detail the percentage of total risk sharing smoothed through each of the channels (e.g. in Ireland 14% of the shocks are smoothed via the capital markets channel, SURE estimation). Negative percentages indicate “dis-smoothing”: the shock not only is transmitted to consumption but that channel induces further reductions. From now on, all the tables are read in the same way. As an additional robustness check, we also include in the Annex the estimation of risk sharing through each channel when considering them in isolation. The results are very close to those of the static system (SURE estimation). Table A5 in the Annex shows the benchmark estimation for this group of countries and the following tables those for the remaining groups analysed.
Table 1. Percentage of risk sharing in case of shocks to domestic output. Analysis per country, target group EU15 excluding LU. Total refers to the percentage of total risk sharing (% of domestic consumption smoothed). Capital, Gov and Credit refer to risk sharing obtained via capital markets, government and credit channels, respectively. Sample: 1960-2016.
1960-2016 SURE estimation VAR estimation
Country Total Capital Gov Credit Total Capital Gov Credit
Austria 25 -1 2 24** 3 -3 1 4 Belgium 68 7 -4 65*** 46 0 -3 49*** Denmark 14 -5 2 17** 13 -2 1 14 Finland 52 -6*** 0 58*** 43 -1 0 45*** France 24 3 -1 22 9 1 2 6 Germany 25 0 1 25*** 23 -1 2 22** Greece 32 3 1 27*** 42 0 -2 44*** Ireland 63 14*** 0 49*** 79 17 3 59*** Italy 31 4 -2 28*** 26 5 -1 21** Netherlands 54 10 -1 46*** 31 0 1 31 Portugal 13 -4 4 12 15 -3 -1 19 Spain 23 2 1 21*** 27 3 3 21** Sweden 47 -6 0 53*** 63 -8 0 72*** UK 10 -1 2 9 18 2 3 14
Note: data source AMECO, JRC estimations.
The symbols ** and *** indicate significant at 5 and 1% level.
The analysis for the whole sample indicates that the credit markets channel (or gross savings) is the most important channel for consumption smoothing. The importance of this channel is however different across countries, being quite high and statistically significant at 1% with all estimation procedures for Belgium, Finland, Sweden, Ireland and Greece (the particular ordering depends on the estimation method). For instance, no matter the estimation method, we can conclude that Finland smooths approximately half of GDP shocks, basically, through the credit markets channel.
The remaining channels do not show too much capacity of consumption smoothing. A notable exception is Ireland, where the capital markets channel can smooth about 15% of
GDP shocks. As regards international transfers, we do not detect significant smoothing through this channel as the numbers that appear in the table are much smaller and hardly significant. Notice that there are two countries, France and UK, where we do not detect any significant smoothing effect through any of the channels by any estimation method.
Table 2 shows the volatility (measured through the standard deviation) of idiosyncratic GDP. Leaving out the case of Ireland that we will explain later on, it turns out that, for instance, for the sample analysed, the volatility of idiosyncratic GDP in Greece is 8 times that of France, meaning that the shocks Greece has faced are 8 times bigger, on average, than those of more stable countries, like France, Belgium or the Netherlands, so not all the countries had the same needs for risk sharing.
We repeat the analysis including Luxembourg in the set of countries. Table A1 in the Annex shows the results. Overall, Luxembourg has the highest shares of consumption smoothing, being close to full risk sharing. This is achieved through the capital and credit markets channels.
Table 2. Standard deviation of idiosyncratic GDP, target group EU15 excluding LU. Sample: 1960-2016. Country Std Dev Ireland 0.053 Greece 0.042 Portugal 0.023 Finland 0.016 Spain 0.013 Sweden 0.012 UK 0.011 Denmark 0.010 Germany 0.007 Italy 0.007 Austria 0.007 Netherlands 0.005 Belgium 0.005 France 0.005 Note: data source AMECO, JRC estimations.
4.2
Target group EU15: sub-sample analysis
In order to get a flavour on how sharing risks has worked in recent times, we divide the sample in two periods 1960-1998 and 1999-2016. The values within each subsample should be taken as average figures for the years covered in each particular subsample. Notice that the second subsample is much shorter and, therefore, uncertainty around the estimations should be higher leading to less significant results. Table 3A shows the results for the first subsample (1960-1998) and Table 3B for the second one (1999-2016). In a similar way to the whole sample, the credit markets channel seems to be predominant to achieve consumption smoothing during the 1960-1998 period. The 3 methodologies used confirm that risk sharing through the credit markets channel was quite high in Belgium, Finland, Greece, Ireland, Italy and Sweden. This result is quite robust since no matter the estimation and/or model we used, the result is always statistically significant. There could be also some evidence that the capital markets channel was not working for some countries (Finland, Portugal, and Sweden).
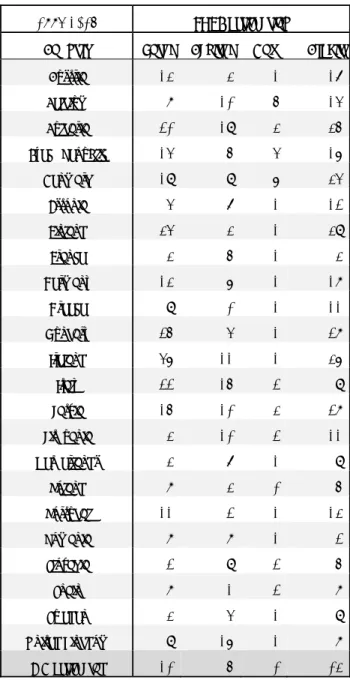
Table 3A. Percentage of risk sharing in case of shocks to domestic output. Analysis per country, target group EU15 excluding LU. Total refers to the percentage of total risk sharing (% of domestic consumption smoothed). Capital, Gov and Credit refer to risk sharing obtained via capital markets, government and credit channels, respectively. Estimation sample: 1960-1998.
1960-1998 SURE estimation VAR estimation
Country Total Capital Gov Credit Total Capital Gov Credit
Austria 29 -3 2 29*** 3 -4 5** 2 Belgium 86 1 -4 89*** 75 1 -3 77*** Denmark 10 -2 3 9 8 0 2 7 Finland 51 -7*** 0 58*** 57 -5 0 62*** France 24 -1 -3 28 25 -4 0 29 Germany 28 -1 1 28*** 20 -5 4** 20 Greece 47 2 0 45*** 55 3 1 51*** Ireland 39 4 1 33*** 40 -2 -3 44*** Italy 42 5** -4*** 41*** 36 6 -2 32*** Netherlands 59 8 -1 52*** 50 12 2 36 Portugal 14 -5** 4 15 28 -5 -6 39*** Spain 20 0 -1 21*** 20 -3 1 23** Sweden 57 -7*** 0 64*** 88 -7 0 95*** UK 13 -2 3 12 25 0 4 21
Note: data source AMECO, JRC estimations.
When we look at the second subsample (1999-2016), for the first time the capital markets channel appears statistically significant with all the procedures used to estimate the amount of risk sharing for a country, Ireland. The next section will describe in more detail the specific characteristics of the Irish economy. There is also strong evidence that the credit market channel was working for Finland and Ireland although, for the first time, there is evidence that this channel produced dis-smoothing in some countries (especially, Portugal and Italy), indicating their inability to put in place short-term measures to counteract the effects of the 2008 recession and the subsequent sovereign debt crisis. The credit channel has stopped to work also in Belgium and Sweden, compared to the first subsample. Recall that in Sweden the dot.com crisis was very severe and the credit channel (the usual way in this country to smooth consumption) was not able soften this shock.
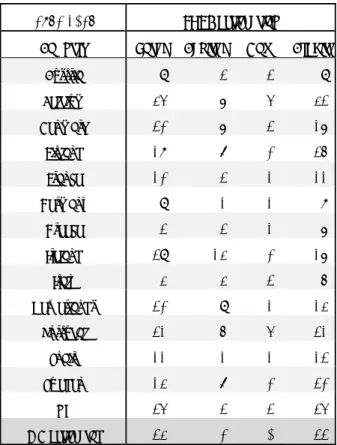
Table 3B. Percentage of risk sharing in case of shocks to domestic output. Analysis per country, target group EU15 excluding LU. Total refers to the percentage of total risk sharing (% of domestic consumption smoothed). Capital, Gov and Credit refer to risk sharing obtained via capital markets, government and credit channels, respectively. Estimation sample: 1999-2016.
1999-2016 SURE estimation VAR estimation
Country Total Capital Gov Credit Total Capital Gov Credit
Austria 8 4 -1 5 18 -7 -3 28 Belgium 21 23 -4 2 16 14 -7 9 Denmark 42 -16 -5 63*** -9 -10 2 -1 Finland 73 13 -3 63** 47 1 -2 48*** France 23 14 4 4 6 -9 -2 16 Germany 17 4 0 13 40 7 -1 33** Greece 9 7 2 1 24 6 -3 21 Ireland 77 20** -1 58*** 85 37*** 1 46*** Italy 2 -1 4 -1 -18 4 0 -23** Netherlands 32 17 -1 16 37 18 -9 28 Portugal 2 5 2 -6 -21 -3 17 -35** Spain 33 6 4 23 58 9 6 43 Sweden 43 13 1 29 32 13 2*** 17 UK 5 -3 -1 9 0 -6 3 3
Note: data source AMECO, JRC estimations.
We also repeated the subsample analysis including Luxembourg. Tables A2 and A3 in the Annex show the results. The conclusions for the first subsample (1960-2016) are the same as for the whole sample, being Luxembourg the country with the highest figures for risk sharing, specially, through the capital and credit markets. Curious enough, for the first time there is evidence of some risk sharing through the credit markets channel in the UK, although it totally disappears in the second subsample (see, Table A3).
4.3
A closer look to Ireland
Not only the credit market channel works quite well in Ireland, but also does the capital markets channel. Another fact that catches one’s eye is the high volatility of idiosyncratic GDP (10 times that of France, Belgium or the Netherlands). In fact, real GDP growth rate in Ireland for 2015 was over 26%! A closer look to Ireland shows two features.
The first is due to the 2008 crisis. After 2008 Ireland experienced a huge housing bubble together with excessive credit expansion, the subsequent burst of this bubble generated loan losses for banks, a decline of aggregate demand, an increase in unemployment and a deterioration of public finances; as a consequence, the sovereign debt crisis came along and the Irish authorities requested assistance from the EU and IMF in November, 2010. The total financial assistance program amounted to €85 billion.
In spite of the crisis and its effects Ireland has experienced a positive growth in the years before the Great Recession and the subsequent sovereign debt crisis. Figure 1 plots real GDP growth rate per capita computed employing the usual risk sharing deflator (CPI). With the exception of 2008 and 2009, per capita real GDP growth rates in Ireland were always positive, as Figure 1 shows. Average Irish real GDP growth rate (per capita) has been 7.6% for the sample 1960-2016.
Figure 1. Ireland’s real per capita GDP growth rates. Sample: 1960-2016. GDP deflator is CPI. -.2 -.1 .0 .1 .2 .3 .4 65 70 75 80 85 90 95 00 05 10 15 gdp
Note: data source AMECO.
The Net Factor Income (NFI) in Ireland has been negative since 1976,8 indicating steady capital outflows. This is mainly due to the activities of foreign-owned multinational corporations and the repatriation of their profits from Ireland. Among EU15 (excluding Luxemburg) Ireland has the highest (negative) ratio of NFI to GDP. Due to low corporation tax rates, some large multinational enterprises have reallocated their headquarters to Ireland. As the Irish Central Statistical Office points out,9 especially in recent years, the net negative flows recorded in the balance of payments are mainly due to outflows of equity income (both, in direct investment income as well as in portfolio investment income, although the first one is more pronounced), that are much higher than their inflows counterparts. Other entries in the net factor income, as the compensation to employees and other net investment incomes are insignificant. This means that Ireland was actually smoothing positive GDP growth. This was mainly due to the repatriation of profits of foreign owned multinationals settled in Ireland.
8 This means that the Gross National Income (GNI) has been lower than the Gross Domestic Product (GDP) during all those years.
Figure 2. Irish ratio NFI/GDP (in percentage). Sample: 1960-2016 -.24 -.20 -.16 -.12 -.08 -.04 .00 .04 65 70 75 80 85 90 95 00 05 10 15 Share of NFI/GDP
Note: data source AMECO.
The second peculiar feature of Ireland is a real GDP growth rate for 2015 at 26% with a negative net factor income close to 21% of GDP. As pointed out by the OECD,10 some large multinationals have recently domiciled their headquarters in Ireland moving there their intangible assets (intellectual property rights) because of Irish low corporate tax regime. This implies that the sales associated to these assets are accounted for in the Irish GDP, pushing up the value of the state’s balance sheet. In 2016, GDP growth rate in Ireland went down to around 5%, more in line with average historical Irish growth rates. We included the latest available data up to 2016 in our estimations.
4.4
Target group: EU28
Due to data availability, the sample used for the estimation of EU28 covers the period 1995-2016. We perform the analysis excluding Croatia, Cyprus, Luxembourg, Malta, and Slovenia: Croatia recently joined the EU, Malta, Cyprus and Slovenia are very small and Luxembourg displays a volatile behaviour that could condition estimations. Including those countries, however, does not change the findings (see Annex 1 for the results). Table 4 reports the results. Due to the turbulent times included in the sample, we find cases of positive and negative short term smoothing through any of the channels. The conclusions for the countries in the EU15 group practically remain unaltered when a larger group is
considered, being Ireland and Finland those with the higher percentage of domestic consumption smoothing.
Cross-border risk sharing via capital markets works quite well for Ireland and the Baltic countries (Lithuania, Latvia and Estonia). It is worth noting the case of Latvia where risk sharing achieved through the capital markets channel (the highest among all the countries in the sample) is offset by dis-smoothing through the credit channel. Figures A1 and A2 offer an intuitive graphical explanation. In Figure A1, idiosyncratic GDP and consumption growth rates go hand in hand indicating the total absence of smoothing, while in Figure A2 idiosyncratic GDP is compared with the three channels, showing that the capital markets channel acts as shock absorber. Instead, the credit or savings channel acts counter-cyclically to GDP, offsetting the smoothing achieved through the capital markets channel. A closer look to the Baltic countries reveals that there was a strong presence of foreign banks (mainly Nordic) in all 3 countries (Latvia, Lithuania and Estonia), although in Latvia domestic banks also have a considerable presence. After the bust in construction, activity fell from 10 to 4% of GDP and housing prices collapsed. In fact, GDP growth rates fell more than 14% in the 3 Baltic countries in 2009. However, the foreign banks absorbed most of the shocks and the three countries were growing at 6% or more by 2011. The only country that needed international financial assistance was Latvia,11 which has a larger share of domestic banks. The bailout in Latvia imposed austerity measures to the national government that jointly with the high unemployment rate (around 20% during the crisis) turn out in a severe dis-smoothing behavior in consumption.
11
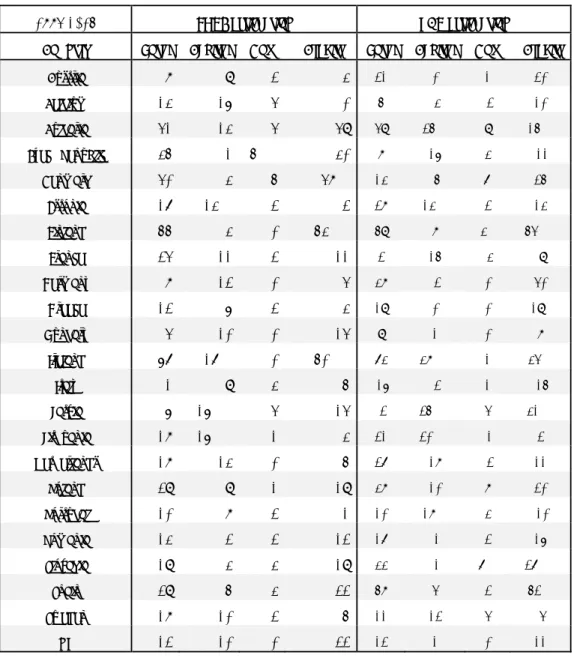
Table 4. Percentage of risk sharing to shocks to domestic output. Target group EU28 excluding LU, CY, MT, HR and SI. Total refers to the percentage of total risk sharing (% of domestic consumption smoothed). Capital, Gov and Credit refer to risk sharing obtained via capital markets, government and credit channels, respectively. Sample: 1995-2016.
1995-2016 SURE estimation VAR estimation
Country Total Capital Gov. Credit Total Capital Gov. Credit
Austria 8 9 2 -3 21 0 1 20 Belgium 13 16 -4 0 5 -3 -2 10 Bulgaria 41 -13 4 49 49 25** 9 15** Czech Republic 35 1 5*** 30 8 16 3 -11 Denmark 40 -3 -5 48** 13 -5 -7* 25 Estonia 17 13** 2 2 28 13** 2 13 Finland 55 3 0 53*** 59 8 -3** 54*** France 24 11 2 11 2 15 -3 -9 Germany 8 12 0 -4 38 -2 0 40 Greece 12 6 2 3 19 0 0 19* Hungary -4 10 0 -14 9 1 0 8 Ireland 67 17** 0 50*** 73 38*** 1 34** Italy -1 -9 3 5 -16 -2 1 -15 Latvia 6 16*** 4 -14 -2 25*** 4 -31*** Lithuania 18 16*** -1 3 21 20*** -1 2 Netherlands 18 13 0 5 27 18 -2 11 Poland 29 9 1 19 38 10 8 20 Portugal 10 8 2 1 10 18** 3 -10 Romania 13 -2 2 12 17 -1 2 16 Slovakia 19 -3 3 19 33 -1 7** 27*** Spain 29 5 3 22 58 4 2 52** Sweden 18 10 2 5 11 12 4 -4 UK 12 -10 0 22 12 1 0 11
Note: data source AMECO, JRC estimations. The symbols ** and *** indicate significant at 5 and 1% level.
We repeat the analysis including all the countries within the EU28. Due to data availability, the sample covers the time span 1995-2016. Table A4 in the Annex shows the results that remain unaltered although placing also Luxembourg and Malta among the first places in risk sharing, as expected (being them international financial hubs).
5
Relative performance of countries
The static estimation of the first two models allows decomposing the effect of risk sharing for each country in two parts: a common and an idiosyncratic one. During crisis period nearly all countries have displayed some smoothing through the analysed channels. However, to better understand the differences across countries we look at each country’s performance on top of the average (common) performance for each of the channels. This is the idiosyncratic effect. For this purpose, we re-write the basic equations for estimating risk sharing (1) to (3) as:
Δlog(GDP) − Δlog(GNI) = , + ( , + ,) Δlog(GDP) + (1’) Δlog(GNI) − Δlog(GDI) = , + ( , + ,) Δlog(GDP) + (2’)
Δlog(GDI) − Δlog(C) = , + ( , + ,) Δlog(GDP) + (3’)
where we have decomposed the parameter that represents risk sharing through each channel as the sum of two parts, a common or average, and an idiosyncratic one. To estimate the common part of risk sharing through each channel, , for the capital markets, , for the fiscal or government channel and , for the credit market channel, we use the Mean Group estimator of Pesaran and Smith (1995), averaging the country estimates for each channel. For each channel and each country, the idiosyncratic part is given by the amount of risk sharing estimated on top of the common or average part. Table 5 gives the results for the target group EU15 excluding Luxembourg for the full sample (1960-2016).
The bottom line (MG estimator) represents the average or common risk sharing for the group of countries considered, while for each country we report the idiosyncratic behaviour i.e. the share of additional consumption smoothing through each one of the channels. If the previous sections gave a picture of risk sharing in absolute terms for each country, Table 5 focuses on the relative performance of the countries giving a comparative analysis. As expected, allowing for heterogeneity results in different average estimates of risk sharing than considering all the countries as homogeneous and estimating a unique model for all of them as usually reported in the literature. Notice, as well, the case of UK (followed by Portugal) pointing out that risk sharing was way behind average figures for the whole set of years, especially through the credit market channel.
Table 5. Percentage of common and idiosyncratic risk sharing to shocks to domestic output. Target group EU15 excluding LU. Capital, Gov and Credit refer to risk sharing obtained via capital markets, government and credit channels, respectively. Sample: 1995-2016.
1961-2016 SURE estimation
Country Total Capital Gov Credit
Austria -9 -2 2 -9 Belgium 34 6 -4 32 Denmark -20 -6 2 -16 Finland 18 -7 0 25 France -10 2 -1 -11 Germany -9 -1 1 -8 Greece -2 2 1 -6 Ireland 29 13 0 16 Italy -3 3 -2 -5 Netherlands 20 9 -1 13 Portugal -21 -5 4 -21 Spain -11 1 1 -12 Sweden 13 -7 0 20 UK -24 -2 2 -24 MG estimator 34 1 0 33
Note: data source AMECO, JRC estimations.
Table 6 gives the results for the set of EU28 for the sample 1995-2016, excluding the very small and volatile economies. Focusing now on the capital markets channel, it is worth mentioning the poor behaviour of this channel in Bulgaria and Italy. However, while in Bulgaria the credit markets channel compensates the dis-smoothing that took place through the capital markets channel, in Italy the credit channel was additional to the capital channel in the collapse of risk sharing in this country in last 20 years.
Table 6. Percentage of common and idiosyncratic risk sharing to shocks to domestic output. Target group EU28 excluding LU, CY, MT, HR and SI. Capital, Gov and Credit refer to risk sharing obtained via capital markets, government and credit channels, respectively. Sample: 1995-2016.
1995-2016 SURE estimation
Country Total Capital Gov Credit
Austria -13 3 1 -17 Belgium -8 10 -5 -14 Bulgaria 20 -19 3 35 Czech Republic 14 -5 4 16 Denmark 19 -9 -6 34 Estonia -4 7 1 -12 Finland 34 -3 -1 39 France 3 5 1 -3 Germany -13 6 -1 -18 Greece -9 0 1 -11 Hungary -25 4 -1 -28 Ireland 46 11 -1 36 Italy -22 -15 2 -9 Latvia -15 10 3 -28 Lithuania -3 10 -2 -11 Netherlands -3 7 -1 -9 Poland 8 3 0 5 Portugal -11 2 1 -13 Romania -8 -8 1 -2 Slovakia -2 -9 2 5 Spain 8 -1 2 8 Sweden -3 4 1 -9 United Kingdom -9 -16 -1 8 MG estimator 21 6 1 14
6
Conclusions
We characterize risk sharing (i.e. consumption smoothing) across the EU28 countries and derive estimates of risk sharing for each channel – credit, capital and government channels. To check the robustness of our results, we provide estimations using several models (considering the channels individually, as a system taking into account possible interactions among them, and as a dynamic system to add time-dependent effects).
Following the literature we define GDP shocks as deviations from the cross-country average GDP growth rates of a set of target countries. The first target group is composed by 15 EU countries for which data availability is the largest (overall 1960-2016). This enables supplementary analysis on the effects of the financial and the sovereign crisis on risk sharing by splitting the sample size in two periods. In our sample not all countries had the same needs for risk sharing as the size of the idiosyncratic shocks is country-dependent. For instance, the volatility of idiosyncratic GDP for Ireland and Greece is 10 and 8 times higher than that of more stable countries, like France, Belgium or the Netherlands.
Looking at the set of countries in the EU15 group, results show that the credit markets channel is the first source of consumption smoothing. However, the consumption smoothing ability of this channel depends on the sample analysed. In most recent times, shaped by the turbulences of the 2008 and the sovereign crisis, this channel became less important and occasionally, for certain countries (notably, Italy and Portugal), even displayed negative values, indicating a certain degree of dis-smoothing (in other terms the credit channel was not able to absorb GDP shocks). Notice that this channel acts, not only through cross border lending and borrowing, but it also has a national connotation, as it reflects the decreased investments due to the shock. Although some countries appear as having higher shares of consumption smoothing through this channel in the sample 1960-1998 (i.e., Belgium and Sweden), analysing all samples, overall Ireland and Finland appear achieving the greatest shares of risk sharing through the credit markets channel.
The capital markets channel, languishing in the older sample, becomes much more active in the post Euro sample, especially in Ireland where huge outflows in the net factor income (mainly in the form of income on equities) have worked to smooth positive GDP shocks in later times due to the repatriation of profits earned by multinationals settled in Ireland, and attracted by low corporation tax rates.
The government channel (risk sharing achieved through public international transfers) shows to be practically inexistent for all target groups and sample sizes.
Looking at the whole set of EU countries, though with a smaller sample size (1995-2016), results hardly change with respect to the EU15 countries. Surprisingly, the capital markets channel as a source of risk sharing seems working efficiently in the Baltic countries (Lithuania, Latvia and Estonia). This is due to strong presence of foreign banks that acted as shock absorbers avoiding the collapse of the banking system during the breakdown of the housing market. However, while in Lithuania and Estonia the banking systems had a predominant presence of Finnish and Swedish banks, Latvia had a substantial share of national banks that were nationalized following the international bailout (Latvia was the only Baltic country to be intervened). During this period the savings channel in Latvia acted counter cyclically offsetting the benefits from the capital markets channel. Luxembourg and Malta also emerge as achieving high percentages of risk sharing, especially through the capital and credit markets channels. As an exception, Luxembourg seems to experience a considerable quota of dis-smoothing through the government channel when we consider all the countries (the time span, in this case, is 1995-2016). Our analysis suggests that different countries have difference needs in terms of risk sharing. Furthermore, channels work differently in each country depending on the size and openness of the countries. This might have implications for one-size-fits-all type of policies fostering risk sharing.
References
Asdrubali, P. and Kim, S. (2004). “Dynamic Risk Sharing in the United States and Europe.” Journal of Monetary Economics, 51(4):809–836.
Asdrubali, P., Kim, S., Pericoli, F., and Poncela, P. (2017). “Shock Absorption in OECD Countries: a Heterogeneous Panel VAR Approach”. Mimeo.
Asdrubali, P., Sørensen, B., and Yosha, O. (1996). “Channels of Interstate Risk Sharing: United States 1963-1990.” The Quarterly Journal of Economics, 111(4):1081–1110. Balli, F., Pericoli, F., and Pierucci, E. (2014). “Foreign portfolio diversification and risk-sharing.” Economics Letters, 125(2):187–190.
Beyer, A., Doornik, J.A. and Hendry, D.H. (2001). “Constructing Historical Euro-zone Data.” Economic Journal, vol. 111(469), 102-121
European Commission (2016). “Quarterly Report on the Euro Area.” Institutional papers. European Commission (2015). “The Five President Report. Completing Europe’s Economic and Monetary Union”.
Investment Plan for Europe (2016) https://ec.europa.eu/commission/priorities/jobs-growth-and-investment/investment-plan-europe-juncker-plan_en
Kalemli-Ozcan, S., Luttini, E., and Sørensen, B. (2014). “Debt Crises and Risk-Sharing: The Role of Markets versus Sovereigns.” Scandinavian Journal of Economics, 116(1):253– 276.
Mélitz, J., Zumer, F. (1999). “Interregional and international risk sharing and lessons for EMU.” Carnegie-Rochester Conference Series on Public Policy 51 (0), 149-188.
Pesaran, M.H., and Smith, R. (1995). “Estimating long-run relationships from dynamic heterogeneous panels.” Journal of Econometrics 68, 79-113.
Poncela, P. Pericoli, F., Manca, A. And Nardo, M. (2016). “Risk Sharing in Europe” (2016). European Commission, Joint Research Centre, Policy Report.
Sørensen, B. E., Wu, Y.-T., Yosha, O., and Zhu, Y. (2007). “Home Bias and International Risk Sharing: Twin Puzzles Separated at Birth.” Journal of International Money and Finance, 26(4):587–605.
List of figures
Figure 1. Ireland’s real per capita GDP growth rates. Sample: 1960-2016. GDP deflator is CPI.
Figure 2. Irish ratio NFI/GDP (in percentage). Sample: 1960-2016.
Figure A1. Idiosyncratic GDP and consumption growth rates in Latvia. Sample 1995-2016.
Figure A2. Idiosyncratic GDP growth rates and the 3 channels (capital markets, government and credit markets channel) in Latvia. Sample 1995-2015.
List of tables
Table 1. Percentage of risk sharing in case of shocks to domestic output. Analysis per country, target group EU15 excluding LU. Total refers to the percentage of total risk sharing (% of domestic consumption smoothed). Capital, Gov and Credit refer to risk sharing obtained via capital markets, government and credit channels, respectively. Sample: 1960-2016.
Table 2. Standard deviation of idiosyncratic GDP, target group EU15 excluding LU. Sample: 1960-2016.
Table 3A. Percentage of risk sharing in case of shocks to domestic output. Analysis per country, target group EU15 excluding LU. Total refers to the percentage of total risk sharing (% of domestic consumption smoothed). Capital, Gov and Credit refer to risk sharing obtained via capital markets, government and credit channels, respectively. Estimation sample: 1960-1998.
Table 3B. Percentage of risk sharing in case of shocks to domestic output. Analysis per country, target group EU15 excluding LU. Total refers to the percentage of total risk sharing (% of domestic consumption smoothed). Capital, Gov and Credit refer to risk sharing obtained via capital markets, government and credit channels, respectively. Estimation sample: 1999-2016.
Table 4. Percentage of risk sharing to shocks to domestic output. Target group EU28 excluding LU, CY, MT, HR and SI. Total refers to the percentage of total risk sharing (% of domestic consumption smoothed). Capital, Gov and Credit refer to risk sharing obtained via capital markets, government and credit channels, respectively. Sample: 1995-2016. Table 5. Percentage of common and idiosyncratic risk sharing to shocks to domestic output. Target group EU15 excluding LU. Capital, Gov and Credit refer to risk sharing obtained via capital markets, government and credit channels, respectively. Sample: 1995-2016.
Table 6. Percentage of common and idiosyncratic risk sharing to shocks to domestic output. Target group EU28 excluding LU, CY, MT, HR and SI. Capital, Gov and Credit refer to risk sharing obtained via capital markets, government and credit channels, respectively. Sample: 1995-2016.
Table A1. Percentage of risk sharing in case of shocks to domestic output. Analysis per country, target group EU15. Total refers to the percentage of total risk sharing (% of domestic consumption smoothed). Capital, Gov and Credit refer to risk sharing obtained via capital markets, government and credit channels, respectively. Sample: 1960-2016. Table A2. Percentage of risk sharing in case of shocks to domestic output. Analysis per country, target group EU15. Total refers to the percentage of total risk sharing (% of domestic consumption smoothed). Capital, Gov and Credit refer to risk sharing obtained via capital markets, government and credit channels, respectively. Sample: 1961-1998. Table A3. Percentage of risk sharing in case of shocks to domestic output. Analysis per country, target group EU15. Total refers to the percentage of total risk sharing (% of domestic consumption smoothed). Capital, Gov and Credit refer to risk sharing obtained via capital markets, government and credit channels, respectively. Sample: 1999-2016. Table A4. Percentage of risk sharing in case of shocks to domestic output. Analysis per country, target group EU28. Total refers to the percentage of total risk sharing (% of domestic consumption smoothed). Capital, Gov and Credit refer to risk sharing obtained via capital markets, government and credit channels, respectively. Sample: 1996-2016. Table A5. Percentage of risk sharing in case of shocks to domestic output. Benchmark analysis: uniequational estimation. Analysis per country, target group EU15 excluding LU. Total refers to the percentage of total risk sharing (% of domestic consumption smoothed). Capital, Gov and Credit refer to risk sharing obtained via capital markets, government and credit channels, respectively. Sample: 1960-2016.
Table A6. Percentage of risk sharing in case of shocks to domestic output. Benchmark analysis: uniequational estimation. Analysis per country, target group EU15 excluding LU. Total refers to the percentage of total risk sharing (% of domestic consumption smoothed). Capital, Gov and Credit refer to risk sharing obtained via capital markets, government and credit channels, respectively. Estimation sample: 1960-1998
Table A7. Percentage of risk sharing in case of shocks to domestic output. Benchmark analysis: uniequational estimation. Analysis per country, target group EU15 excluding LU. Total refers to the percentage of total risk sharing (% of domestic consumption smoothed). Capital, Gov and Credit refer to risk sharing obtained via capital markets, government and credit channels, respectively. Estimation sample: 1999-2016.
Table A8. Percentage of risk sharing to shocks to domestic output. Benchmark analysis: uniequational estimation. Analysis per country, target group EU28 excluding LU, CY, MT, HR and SI. Total refers to the percentage of total risk sharing (% of domestic consumption smoothed). Capital, Gov and Credit refer to risk sharing obtained via capital markets, government and credit channels, respectively. Sample: 1995-2016.
Table A9. Percentage of common and idiosyncratic risk sharing to shocks to domestic output. Benchmark analysis: uniequational estimation. Target group EU15 excluding LU. Capital, Gov and Credit refer to risk sharing obtained via capital markets, government and credit channels, respectively. Sample: 1995-2016.
Table A10. Percentage of common and idiosyncratic risk sharing to shocks to domestic output. Target group EU28 excluding excluding LU, CY, MT, HR and SI. Capital, Gov and Credit refer to risk sharing obtained via capital markets, government and credit channels, respectively. Sample: 1995-2016.
Annex: additional tables and figures
Analysis for EU15, including Luxembourg
Table A1. Percentage of risk sharing in case of shocks to domestic output. Analysis per country, target group EU15. Total refers to the percentage of total risk sharing (% of domestic consumption smoothed). Capital, Gov and Credit refer to risk sharing obtained via capital markets, government and credit channels, respectively. Sample: 1960-2016.
EU15 1960-2016 Uniequational estimation SURE estimation VAR estimation
Country Total Capital Gov Credit Total Capital Gov Credit Total Capital Gov Credit
Austria 26 -2 3 24 25 -1 2 24** 3 -3 1 4 Belgium 63 6 -1 58*** 68 7 -4* 65*** 45 0 -3 49*** Denmark 16 -2 1 18 14 -5 2 17** 13 -2 1 14 Finland 49 -6 0 55*** 52 -6*** 0 58*** 43 -1 0 44*** France 30 5 1 23 24 3 -1 22 9 1 2 6 Germany 28 2 0 27** 25 0 0 25*** 23 -1 2 22** Greece 34 2 1 30*** 32 3 1 27*** 42 0 -2 44*** Ireland 65 14*** 0 51*** 64 14*** 0 49*** 79 17*** 3 60*** Italy 28 7 -2 23 31 4 -2 28*** 25 5 -1 21** Luxembourg 91 21*** -4 74*** 92 19 -4 78*** 100 39** -16 76*** Netherlands 54 10 0 44*** 54 10 -1 45*** 31 -1 1 31 Portugal 10 -4 3 11 13 -4 4 13 15 -3 -1 19 Spain 24 1 0 22** 23 2 1 21*** 27 3 3 21** Sweden 47 -8 0 55*** 47 -6 0 53*** 63 -9 0 72*** United Kingdom 6 -1 4 4 10 -1 2 9 19 2 3 14
Note: data source AMECO, JRC estimations.
Table A2. Percentage of risk sharing in case of shocks to domestic output. Analysis per country, target group EU15. Total refers to the percentage of total risk sharing (% of domestic consumption smoothed). Capital, Gov and Credit refer to risk sharing obtained via capital markets, government and credit channels, respectively. Sample: 1961-1998.
Uniequational estimation SURE estimation VAR estimation
Country Total Capital Gov Credit Total Capital Gov Credit Total Capital Gov Credit
Austria 28 -1 2 27 29 -3 2 29*** -1 -4 2 2 Belgium 74 3 -2 73*** 85 1 -4 89*** 84 1 -1 85*** Denmark 13 -3 2 14 10 -2 3 9 9 0 1 8 Finland 48 -8** 1 56*** 51 -7*** 0 58*** 47 -5 1 51*** France 30 4 -1 27 24 -1 -3 27* 21 -2 2 21 Germany 34 0 1 33** 27 -1 1 28*** 18 -3 2 18 Greece 49 1 0 48*** 47 2 0 45*** 59 5 0 53*** Ireland 43 5 0 38*** 39 4 1 33*** 47 -10 5 52*** Italy 33 6 -2 29 42 5** -4** 41*** 38 8*** -2 32*** Luxembourg 91 10*** 0 81*** 92 10 0 83*** 116 -2 1 117*** Netherlands 58 8 0 50*** 59 8 -1 52*** 38 10 3 26 Portugal 10 -5 3 13 14 -5** 4 15 20 -6 -2 28 Spain 20 1 -1 20 20 0 -1 21*** 21 -1 -2 24** Sweden 53 -8 0 61*** 57 -7*** 0 64*** 78 -7** 0 85*** UK 6 -3 4 5 13 -2 3 12 26 1 5 20**
Note: data source AMECO, JRC estimations.
Table A3. Percentage of risk sharing in case of shocks to domestic output. Analysis per country, target group EU15. Total refers to the percentage of total risk sharing (% of domestic consumption smoothed). Capital, Gov and Credit refer to risk sharing obtained via capital markets, government and credit channels, respectively. Sample: 1999-2016.
EU15 1999-2016 Uniequational estimation SURE estimation VAR estimation
Country Total Capital Gov Credit Total Capital Gov Credit Total Capital Gov Credit
Austria 16 -5 8 13 8 4 -1 5 12 -6 -1 19 Belgium 25 13 5 6 21 23 -4 2 -2 -4 -2 4 Denmark 43 3 -10 50* 42 -16 -5 63*** 19 -7 3 22 Finland 54 24 -15 45 72 13 -4** 63** 53 7 -3** 49*** France 32 10 10 13 23 14 4 4 2 -11 0 13 Germany 20 7 -3 16 17 4 0 13 42 6 0 37** Greece 10 3 3 4 9 7 2 1 16 -2 -4** 22** Ireland 76 19*** 0 57*** 77 20** 0 58*** 79 26*** 0 53*** Italy 0 0 -1 1 3 0 4 -1 -8 4 0 -13 Luxembourg 92 84*** -27** 36*** 90 65 -24 49* 105 49 -7 64** Netherlands 35 21 -3 17 32 17 -1 16 16 30 -3 -10 Portugal 0 3 1 -3 2 5 2 -5 5 14 6 -15 Spain 31 0 5 26 33 6 4 24 41 2 4 35 Sweden 26 2 -3 26 43 13 1 29 29 -4 0 33** United Kingdom 5 8 2 -5 5 -3 -1 9 1 0 1 1
Note: data source AMECO, JRC estimations.
The symbols ** and *** indicate significant at 5 and 1% level.
Table A4. Percentage of risk sharing in case of shocks to domestic output. Analysis per country, target group EU28. Total refers to the percentage of total risk sharing (% of domestic consumption smoothed). Capital, Gov and Credit refer to risk sharing obtained via capital markets, government and credit channels, respectively. Sample: 1996-2016.
EU28 1995-2016 Uniequational estimation SURE estimation VAR estimation
Country Total Capital Gov Credit Total Capital Gov Credit Total Capital Gov Credit
Austria 12 13 4 -5 8 9 2 -3 3 -2 -1 7 Belgium 22 4 0 19 13 16 -4 0 4 1 -1 4 Bulgaria 42 -15** 4 53*** 41 -13 4 49 38 17 8 13 Croatia 26 3 3 20 18 -1 3 16 6 -1 -5 12 Cyprus 6 -31 -4 41 -1 -28 -2 29 -2 22 3 -26 Czech Republic 28 8 2 18 35 1 5*** 30 46 -3 -1 49** Denmark 40 7 -7 40 40 -3 -5 48** 12 -3 -2 17 Estonia 16 8 1 7 17 13 2 2 32 18*** 1 13 Finland 51 2 -2 51** 56 3 0 53*** 58 10** -3** 51*** France 31 16 3 12 24 12 2 10 -3 0 1 -4 Germany 11 16 -1 -3 8 12 0 -4 40 4 0 37 Greece 13 5 3 6 12 6 2 3 17 -1 -4** 22** Hungary 9 9 1 -2 -4 10 0 -14 6 -13 -6 25 Ireland 67 16*** 0 51*** 67 17** 0 50*** 80 27*** 0 53*** Italy 0 -2 0 2 -1 -9 3 5 -14 3 2 -20 Latvia 9 12** 3 -5 6 16*** 4 -14 3 42*** 6 -46** Lithuania 18 13** -2 7 18 16*** -1 3 31 24*** -2 8 Luxembourg 87 69*** -23*** 41** 81 58 -22 45 82 64 -28 46** Malta 67 18 -6 55*** 73 13 -3 63** 92 28 -6 69 Netherlands 25 19 -1 7 18 13 0 5 14 9 -3 8 Poland 20 7 1 13 29 9 1 19 47 21 10 15 Portugal 12 10 1 1 10 8 2 1 8 16** 5 -13 Romania 11 1 1 9 13 -2 2 12 6 5 1 0 Slovakia 17 4 1 11 20 -3 3 19 37 -11 11 37** Slovenia 42 9 -2 35 35 4 0 31 46 12 -3 37** Spain 32 3 3 27 29 4 3 22 39 3 3 33 Sweden 23 -3 1 26 18 11 2 5 29 -8 -2 39** UK 7 -2 0 9 12 -10 0 22 8 5 0 3
Note: data source AMECO, JRC estimations.
Table A5. Percentage of risk sharing in case of shocks to domestic output. Benchmark analysis: uniequational estimation. Analysis per country, target group EU15 excluding LU. Total refers to the percentage of total risk sharing (% of domestic consumption smoothed). Capital, Gov and Credit refer to risk sharing obtained via capital markets, government and credit channels, respectively. Sample: 1960-2016.
1960-2016 Uniequational estimation
Country Total Capital Gov Credit
Austria 24 -2 2 23 Belgium 61 5 -3 58*** Denmark 17 -3 1 18 Finland 49 -6** 0 56*** France 29 1 1 28 Germany 27 1 1 25** Greece 34 3 0 31*** Ireland 65 15*** 0 50*** Italy 27 2 -1 26 Netherlands 54 10 0 44*** Portugal 9 -4 3** 10 Spain 24 2 0 22** Sweden 46 -6 0 53*** UK 5 0 3 3
Note: data source AMECO, JRC estimations.
Table A6. Percentage of risk sharing in case of shocks to domestic output. Benchmark analysis: uniequational estimation. Analysis per country, target group EU15 excluding LU. Total refers to the percentage of total risk sharing (% of domestic consumption smoothed). Capital, Gov and Credit refer to risk sharing obtained via capital markets, government and credit channels, respectively. Estimation sample: 1960-1998.
1960-1998 Uniequational estimation
Country Total Capital Gov Credit
Austria 26 -2 3 25 Belgium 72 2 -2 71*** Denmark 13 -2 2 13 Finland 48 -7*** 0 56*** France 31 -1 -1 33 Germany 31 0 1 30** Greece 50 1 0 49*** Ireland 43 7*** 1 36*** Italy 32 4 -1 29** Netherlands 57 8 1 49*** Portugal 10 -5** 3** 11 Spain 20 1 -1 20 Sweden 52 -8** 0 60*** UK 4 -2 3 3
Note: data source AMECO, JRC estimations.
Table A7. Percentage of risk sharing in case of shocks to domestic output. Benchmark analysis: uniequational estimation. Analysis per country, target group EU15 excluding LU. Total refers to the percentage of total risk sharing (% of domestic consumption smoothed). Capital, Gov and Credit refer to risk sharing obtained via capital markets, government and credit channels, respectively. Estimation sample: 1999-2016.
1999-2016 Uniequational estimation
Country Total Capital Gov Credit
Austria 13 0 -1 14 Belgium 21 15 -5 10 Denmark 45 -9 -4 58** Finland 56 8 -3 51** France 27 7 5 15 Germany 20 3 1 16 Greece 10 6 1 3 Ireland 76 20*** 0 57*** Italy 1 -5 2 4 Netherlands 38 18 -1 21 Portugal 1 3 2 -4 Spain 32 5 3 24 Sweden 27 1 -1 27 UK 4 10 -1 -4
Note: data source AMECO, JRC estimations.
Table A8. Percentage of risk sharing to shocks to domestic output. Benchmark analysis: uniequational estimation. Analysis per country, target group EU28 excluding LU, CY, MT, HR and SI. Total refers to the percentage of total risk sharing (% of domestic consumption smoothed). Capital, Gov and Credit refer to risk sharing obtained via capital markets, government and credit channels, respectively. Sample: 1995-2016.
1995-2016 Uniequational estimation
Country Total Capital Gov. Credit
Austria 3 14 2 -14 Belgium 14 10 -1 5 Bulgaria 42 -16*** 4*** 54*** Czech Republic 29 12 3 15 Denmark 35 4 -5 35 Estonia 16 9** 2 5 Finland 47 0 1 47** France 20 14 5 1 Germany 4 7 1 -4 Greece 14 7 2 5 Hungary 9 9 1 -1 Ireland 67 17*** 0 50*** Italy -5 -4 2*** -3 Latvia 9 12*** 3 -6 Lithuania 18 12*** -1 6 Netherlands 20 18 0 2 Poland 18 8 0 10 Portugal 10 11 3 -3 Romania 12 1 1 11 Slovakia 16 1 3 12 Spain 32 7 3 22 Sweden 21 -2 2 20 UK 5 3 0 2
Note: data source AMECO, JRC estimations.
Table A9. Percentage of common and idiosyncratic risk sharing to shocks to domestic output. Benchmark analysis: uniequational estimation. Target group EU15 excluding LU. Capital, Gov and Credit refer to risk sharing obtained via capital markets, government and credit channels, respectively. Sample: 1995-2016.
1961-2016 Uniequational estimation
Country Total Capital Gov Credit
Austria -10 -3 1 -9 Belgium 27 4 -4 26 Denmark -17 -4 0 -14 Finland 15 -7 -1 24 France -5 0 0 -4 Germany -7 0 0 -7 Greece 0 2 -1 -1 Ireland 31 14 -1 18 Italy -7 1 -2 -6