PROJECT MANAGEMENT
Introduction to Project Management
Many people and organizations today have a new or renewed interest in project management. Until the 1980s, project management primarily focused on providing schedule and resource data to top management in the military, computer, and construction industries. Today’s project management involves much more, and people in every industry and every country manage projects. New technologies have become a significant factor in many businesses. Today’s companies, governments, and non-profit organizations are recognizing that to be successful, they need to be conversant with and use modern project management techniques. Individuals are realizing that to remain competitive in the workplace, they must develop skills to become good project team members and project managers. They also realize that many of the concepts of project management will help them in their everyday lives as they work with people and technology on a day-to-day basis.
Although people have worked on projects for centuries, most agree that the modern concept of project management began with the Manhattan Project, which the U.S. military led to develop the atomic bomb. The Manhattan Project involved many people with different skills at several different locations. It also clearly separated the overall management of the project’s mission, schedule, and budget under General Leslie R. Groves and the technical management of the project under Dr. Robert Oppenheimer. The Manhattan Project lasted about three years and cost almost $2 billion in 1946. In developing the project, the military realized that scientists and other technical specialists often did not have the desire or the necessary skills to manage large projects. For example, after being asked several times for each team member’s responsibilities at the new Los Alamos laboratory in 1943, Dr. Oppenheimer threw a piece of paper with an organization chart on it at his director and said, “Here’s your damn organization chart.” Project management was recognized as a distinct discipline requiring people with special skills and, even more importantly, the desire to lead project teams.
WHAT IS A PROJECT?Project management was first used to manage the US space program. It's practice has now been expanded rapidly through the government, the military and the corporate world. A project is “a temporary endeavour undertaken to create a unique product, service, or result.” Operations, on the other hand, is work done in organizations to sustain the business. Projects are different from operations in that they end when their objectives have been reached or the project has been terminated.
a.)
Definition of a ProjectThe Project Management Institute defines a project as follows:
A Project is a unique undertaking with a defined starting point and duration directed at achieving defined objectives, utilizing finite or infinite resources.
The key parts of this definition: 1. A project has a unique objective.
2. A project has a definite start, duration and finish. It has a temporary rather than open-ended duration.
Some examples of projects are: • Building a house
• Relocating a data center • Writing a book
• Determining project objectives
What is the goal (or goals) of the project? Examples of project goals include building a bridge, relocating the MIS department to a new site or installing a new phone system. More importantly, some examples of things that are NOT projects include scheduling the usage for a training facility or scheduling engineers in a technical service department. These are not projects because they do not meet all the criteria of a project. They do not have a definitive start, finish, and duration.
• Managing budgets and resources
Projects do not get done without resources to do them. To ensure successful completion of a project, it is important to estimate correctly the number of personnel and the amount of equipment needed. With this, it is important to realize the cost of the project. Some projects can be completed in a shorter time by increasing the manpower on the project. However, doing this also increases the cost. One of the project manager’s jobs is to maintain a balance between reducing costs and reducing the time to complete the project.
• Reporting Progress
Reporting progress is a key to project management. It is essential that key players in a project know what is happening, and whether they are on track, behind, or ahead of schedule. By reviewing progress on a regular basis, you can try to avoid possible problems in advance. For example, if you notice that a certain task was scheduled to take 10 days to accomplish, but on day 5 only 25% of the work was finished, you could possibly re-allocate resources to that task in order to complete it on time.
• Evaluating efficiency and effectiveness
During and after a project, it is important to review and analyze the performance on the project. This information can provide valuable insight into possible changes to make for future projects. For example, your project was to build a house, and one of the steps involved was landscaping. After the project is finished, you notice that it took less time to do the landscaping than you originally planned. This information could be valuable if you build another house, because you could reduce the time allocated for landscaping. By constantly reviewing the efficiency and effectiveness of your project, you can more accurately plan future projects.
Here is the main definition of what project management is: 1. Project management is no small task.
2. Project management has a definite beginning and end. It is not a continuous process.
3. Project management uses various measurement tools to accomplish and track project tasks. These include Gantt and Pert charts.
4. Projects frequently need resources on an add-on basis as opposed to organizations who have full-time positions.
There are three main points that are most important to a successful project: 1. A Project must meet customer requirements.
2. A Project must be under budget. 3. A Project must be on time.
There are four phases a project goes through. The role of the project manager in project management is one of great responsibility. It's the project manager's job to direct and supervise the project from beginning to end. Here are some other roles:
1. The project manager must define the project, reduce the project to a set of manageable tasks, obtain appropriate and necessary resources, and build a team or teams to perform the project work
2. The project manager must set the final goal for the project and must motivate his workers to complete the project on time.
3. A project manager must have is technical skills. This relates to financial planning, contract management, and managing creative thinking and problem solving techniques are promoted.
There are many things that can go wrong with project management. These are commonly called barriers. Here are some possible barriers:
1. Poor Communication
o Many times a project may fail because the project team does not know exactly what to get done or what's already been done.
2. Disagreement
o Project must meet all elements in a contract.
o Customer and project manager must agree on numerous elements. 3. Failure to comply with standards and regulations.
4. Inclement weather. 5. Union strikes. 6. Personality conflicts. 7. Poor management
8. Poorly defined project goals
c.)
Project ManagersProject managers are responsible for managing projects. They coordinate projects and related tasks, but do not usually have direct management responsibilities for resources assigned to their project. The resources involved in one project may not be the same resources involved in another project. Project managers focus only on work that is specific to their project, and are primarily task and time-constrained: “How do I ensure my project gets finished in the shortest amount of time?” is a question on every project manager’s mind each day.
An effective project manager is crucial to a project’s success. Project managers work with the project sponsors, the project team, and the other people involved in a project to meet project goals. Project managers should also possess general management knowledge and skills. They should understand important topics related to financial management, accounting, procurement, sales, marketing, contracts, manufacturing, distribution, logistics, the supply chain, strategic planning, tactical planning, operations management, organizational structures and behaviour, personnel administration, compensation, benefits, career paths, and health and safety practices. On some projects, it will be critical for the project manager to have a lot of experience in one or several of these general management areas. On other projects, the project manager can delegate detailed responsibility for some of these areas to a team member, support staff, or even a supplier. Even so, the project manager must be intelligent and experienced enough to know which of these areas are most important and who is qualified to do the work. He or she must also make and/or take responsibility for all key project decisions. Achieving high performance on projects requires soft skills, otherwise called human relations skills. Some of these soft skills include effective communication, influencing the organization to get things done, leadership, motivation, negotiation, conflict management, and problem solving. Why do project managers need good soft skills? One reason is that to understand, navigate, and meet stakeholders’ needs and expectations, project managers need to lead, communicate, negotiate, solve problems, and influence the organization at large. They need to be able to listen actively to what others are saying, help develop new approaches for solving problems, and then persuade others to work toward achieving project goals. Project managers must lead their project teams by providing vision, delegating work, creating an energetic and positive environment, and setting an example of appropriate and effective behaviour.
Project managers must focus on teamwork skills to employ people effectively. They need to be able to motivate different types of people and develop esprit de corps within the project team and with other
project stakeholders. Since most projects involve changes and trade-offs between competing goals, it is important for project managers to have strong coping skills as well. It helps project managers maintain their sanity and reduce their stress levels if they cope with criticism and constant change. Project managers must be flexible, creative, and sometimes patient in working toward project goals; they must also be persistent in making project needs known.
particular industry. Project managers must make many decisions and deal with people in a wide variety of disciplines, so it helps tremendously to have a project manager who is confident in using the special tools or technologies that are the most effective in particular settings. They do not normally have to be experts on any specific technology, but they have to know enough to build a strong team and ask the right questions to keep things on track. For example, project managers for large information technology projects do not have to be experts in the field of information technology, but they must have working knowledge of various technologies and understand how the project would enhance the business. Many companies have found that a good business manager can be a very good information technology project manager because they focus on meeting business needs and rely on key project members to handle the technical details. All project managers should continue to develop their knowledge and experience in project management, general management, soft skills, and the industries they support.
PROJECT ATTRIBUTESProject management is “the application of knowledge, skills, tools and techniques to project activities to meet project requirements.”Project managers must not only strive to meet specific scope, time, cost, and quality goals of projects, they must also facilitate the entire process to meet the needs and expectations of the people involved in or affected by project activities. Projects come in all shapes and sizes. The following attributes help to define a project further:
• A project has a unique purpose. Every project should have a well-defined objective. For example,
The Director of the Project Management Office in the opening case, might sponsor an information technology collaboration project to develop a list and initial analysis of potential information technology projects that might improve operations for the company. The unique purpose of this project would be to create a collaborative report with ideas from people throughout the company. The results would provide the basis for further discussions and projects. As in this example, projects result in a unique product, service, or result.
• A project is temporary. A project has a definite beginning and a definite end. In the information
technology collaboration project, Anne might form a team of people to work immediately on the project, and then expect a report and an executive presentation of the results in one month.
• A project is developed using progressive elaboration. Projects are often defined broadly when
they begin, and as time passes, the specific details of the project become clearer. Therefore, projects should be developed in increments. A project team should develop initial plans and then update them with more detail based on new information. For example, suppose a few people submitted ideas for the information technology collaboration project, but they did not clearly address how the ideas would support the business strategy of improving operations. The project team might decide to prepare a questionnaire for people to fill in as they submit their ideas to improve the quality of the inputs.
• A project requires resources, often from various areas. Resources include people, hardware, software, or other assets. Many projects cross departmental or other boundaries to achieve their unique purposes. For the information technology collaboration project, people from information technology, marketing, sales, distribution, and other areas of the company would need to work together to develop ideas. The company might also hire outside consultants to provide input. Once the project team has selected key projects for implementation, they will probably require additional hardware, software, and network resources. People from other companies—product suppliers and consulting companies—will become resources for meeting new project objectives. Resources, however, are limited. They must be used effectively to meet project and other corporate goals.
• A project should have a primary customer or sponsor. Most projects have many interested
parties or stakeholders, but someone must take the primary role of sponsorship. The project sponsor usually provides the direction and funding for the project. In this case, Anne Roberts would be the sponsor for the information technology collaboration project. Once further information technology projects are selected, however, the sponsors for those projects would be senior managers in charge of the main parts of the company affected by the projects. For example, if the vice president of sales initiates a project to improve direct product sales using the Internet, he or she might be the
• A project involves uncertainty. Because every project is unique, it is sometimes difficult to define its
objectives clearly, estimate how long it will take to complete, or determine how much it will cost. External factors also cause uncertainty, such as a supplier going out of business or a project team member needing unplanned time off. This uncertainty is one of the main reasons project management is so challenging, especially on projects involving new technologies.
a.)
SMART Goals What is a Goal?According to the New Comprehensive International Dictionary of the English Language a goal is a point toward which effort or movement is directed. The objective point that one is striving to reach All goals should be SMART Goals
• Specific ( o Well defined
o They are clear to anyone that has a basic knowledge of the project
• Measurable
o Have some means to be able to know if the goal is obtainable or how far away completion is.
• Agreed Upon
o Have agreement between the users and the project team on what goals should be
• Realistic
o Looking at the resources, knowledge, and time available can the goal be accomplished
• Time-Framed
o How much time is needed to accomplish the goal
o Having too much time can affect the project performance
b.)
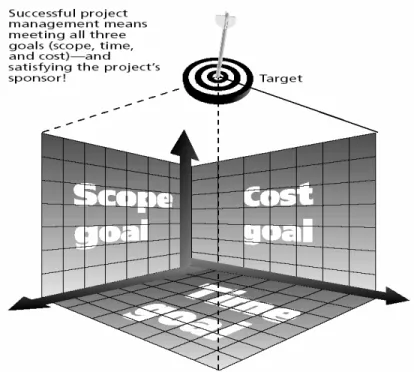
The Triple ConstraintEvery project is constrained in different ways by its scope, time, and cost goals. These limitations are sometimes referred to in project management as the triple constraint. To create a successful project, a project manager must consider scope, time, and cost and balance these three often-competing goals. He or she must consider the following:
• Scope: What work will be done as part of the project? What unique product, service, or result does the customer or sponsor expect from the project? How will the scope be verified?
• Time: How long should it take to complete the project? What is the project’s schedule? How will
the team track actual schedule performance? Who can approve changes to the schedule?
• Cost: What should it cost to complete the project? What is the project’s budget? How will costs be tracked? Who can authorize changes to the budget?
Figure 1 illustrates the three dimensions of the triple constraint. Each area—scope, time, and cost—has a target at the beginning of the project.
Managing the triple constraint involves making trade-offs between scope, time, and cost goals for a project. For example, you might need to increase the budget for a project to meet scope and time goals. Alternatively, you might have to reduce the scope of a project to meet time and cost goals. Experienced project managers know that you must decide which aspect of the triple constraint is most important. If time is most important, you must often change the initial scope and/or cost goals to meet the schedule. If scope goals are most important, you may need to adjust time and/or cost goals.
Although the triple constraint describes how the basic elements of a project —scope, time, and cost— interrelate, other elements can also play significant roles. Quality is often a key factor in projects, as is customer or sponsor satisfaction. Some people, in fact, refer to the “quadruple constraint” of project
management, including quality along with scope, time, and cost. Others believe that quality considerations, including customer satisfaction, must be inherent in setting the scope, time, and cost goals of a project. A project team may meet scope, time, and cost goals but fail to meet quality standards
Figure 1. The Triple Constraint of Project Management
Figure 2 illustrates a framework to help you understand project management. Key elements of this framework include the project stakeholders, project management knowledge areas, project management tools and techniques, and the contribution of successful projects to the enterprise.
stakeholders often have very different needs and expectations. For example, building a new house is a well known example of a project. There are several stakeholders involved in a home construction project.
• The project sponsors would be the potential new homeowners. They would be the people paying for the house and could be on a very tight budget, so they would expect the contractor to provide accurate estimates of the costs involved in building the house. They would also need a realistic idea of when they could move in and what type of home they could afford given their budget constraints. The new homeowners would have to make important decisions to keep the costs of the house within their budget. Can they afford to finish the basement right away? If they can afford to finish the basement, will it affect the projected move-in date? In this example, the project sponsors are also the customers and users for the product, which is the house.
• The project manager in this example would normally be the general contractor responsible for building the house. He or she needs to work with all the project stakeholders to meet their needs and expectations.
• The project team for building the house would include several construction workers, electricians, carpenters, and so on. These stakeholders would need to know exactly what work they must do and when they need to do it. They would need to know if the required materials and equipment will be at the construction site or if they are expected to provide the materials and equipment. Their work would need to be coordinated since there are many interrelated factors involved. For example, the carpenter cannot put in kitchen cabinets until the walls are completed.
• Support staff might include the buyers’ employers, the general contractor’s administrative assistant, and other people who support other stakeholders. The buyers’ employers might expect their employees to still complete their work but allow some flexibility so they can visit the building site or take phone calls related to building the house. The contractor’s administrative assistant would support the project by coordinating meetings between the buyers, the contractor, suppliers, and so on.
• Building a house requires many suppliers. The suppliers would provide the wood, windows, flooring materials, appliances, and so on. Suppliers would expect exact details on what items they need to provide, where and when to deliver those items, and so on.
• There may or may not be opponents of a project. In this example, there might be a neighbour who opposes the project because the workers are making so much noise that she cannot concentrate on her work at home, or the noise might wake her sleeping children. She might interrupt the workers to voice her complaints or even file a formal complaint. Or, the neighbourhood might have association rules concerning new home design and construction. If the homeowners did not follow these rules, they might have to halt construction due to legal issues.
As you can see from this example, there are many different stakeholders on projects, and they all have different interests. Stakeholders’ needs and expectations are important in the beginning and throughout the life of a project. Successful project managers develop good relationships with project stakeholders to understand and meet their needs and expectations.
d.)
Project Life CycleIn Contemporary Systems Analysis, 5th Edition published by Business and Educational Technologies, Marvin Gore and John Stubbe wrote that the Project Life Cycle includes the following Phases and activities:
A. Study Phase 1. User Need
2. Initial Investigation 3. User Review
4. System Performance Design 5. Candidate Review
3. Data Base Design 4. Control Requirements 5. Output Design 6. Input Design 7. Software Selection 8. Equipment Selection/Acquisition 9. People
10. Reference Manual Identification 11. Plans
12. Design Specifications Preparation 13. Design Phase Report Preparation
C. Development Phase
1. Implementation Planning 2. Computer Program Design 3. User Review
4. Equipment Acquisition and Installation 5. Coding and Debugging
6. Computer Program Testing 7. System Testing
8. Reference Manual Preparation 9. Personnel Training
10. Changeover Plan Preparation
11. Development Phase Report Preparation 12. User Acceptance Review
D. Operation Phase
1. System Changeover 2. Routine Operation
3. System Performance Evaluation 4. System Changes/Enhancements
e.)
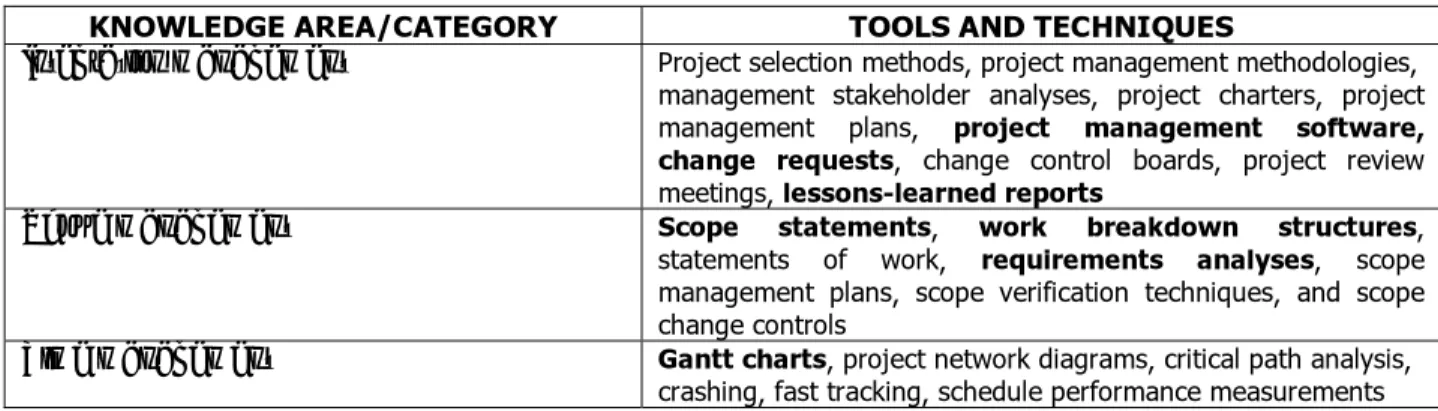
Project Management ToolsProject management tools and techniques assist project managers and their teams in carrying out work in all nine knowledge areas. For example, some popular time-management tools and techniques include Gantt charts, project network diagrams, and critical path analysis. Table 1 lists some commonly used tools and techniques by knowledge area. You will learn more about these and other tools and techniques throughout this text.
Table 1: Common Project Management Tools and Techniques by Knowledge Area
KNOWLEDGE AREA/CATEGORY TOOLS AND TECHNIQUES
Integration management Project selection methods, project management methodologies, management stakeholder analyses, project charters, project management plans, project management software,
change requests, change control boards, project review
meetings, lessons-learned reports
Scope management Scope statements, work breakdown structures,
statements of work, requirements analyses, scope management plans, scope verification techniques, and scope change controls
Cost management Net present value, return on investment, payback analysis, earned value management, project portfolio management, cost estimates, cost management plans, cost baselines
Quality management Quality metrics, checklists, quality control charts, Pareto diagrams, fishbone diagrams, maturity models, statistical methods
Human resource management Motivation techniques, empathic listening, responsibility
management assignment matrices, project organizational charts, resource histograms, team building exercises
Communications management Communications management plans, kick-off meetings, conflict management, communications media selection, status and progress reports, virtual communications, templates, project Web sites
Risk management Risk management plans, risk registers, probability/impact matrices, risk rankings
Procurement management Make-or-buy analyses, contracts, requests for proposals or quotes,management source selections, supplier evaluation matrices
• What these tools are used for?
Good project management deals with three factors: time, cost and performance. Projects are successful if they are completed on time, within budget, and to performance requirements. In order to bring the many components of a large project into control there is a large toolkit of techniques, methodologies, and tools. These techniques provide the tools for managing different components involved in a project: planning and scheduling, developing a product, managing financial and capital resources, and monitoring progress. However the success of a project will always rest on the abilities of a project manager and the team members.
(i)
WORK BREAKDOWN STRUCTURE (WBS)This tool is related to planning and scheduling a project. Basically it is a functional decomposition of the tasks of the project. The total work of the project is broken down into the major subtasks. It starts with the end objective required and successively subdividing it into manageable components in terms of size and complexity: program, project, system, subsystem, components, tasks, subtasks, and work elements.
It should be product- or task-oriented and should include all the necessary effort which must be undertaken to achieve the end objective. Because it defines the work required to achieve an objective and help to show the required interfaces, a WBS is useful for complex projects. However, it has got an important drawback: it does not show the timing of activities. In order to overcome this drawback, another tool can be used.
(ii)
GANTT CHARTS
In 1917, Henry Gantt developed the famous Gantt chart as a tool for scheduling work in factories. A Gantt chart is a standard format for displaying project schedule information by listing project activities and their corresponding start and finish dates in a calendar format. Managers drew Gantt charts by hand to show project tasks and schedule information, and this tool provided a standard format for planning and reviewing all the work on early military projects.
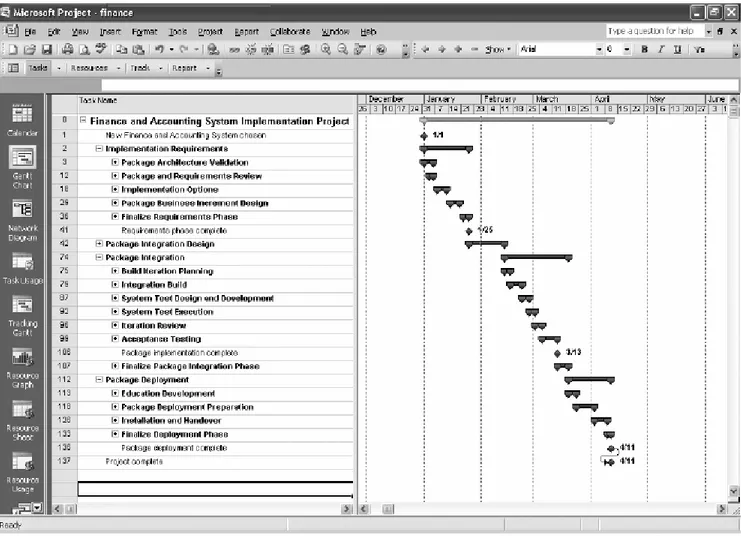
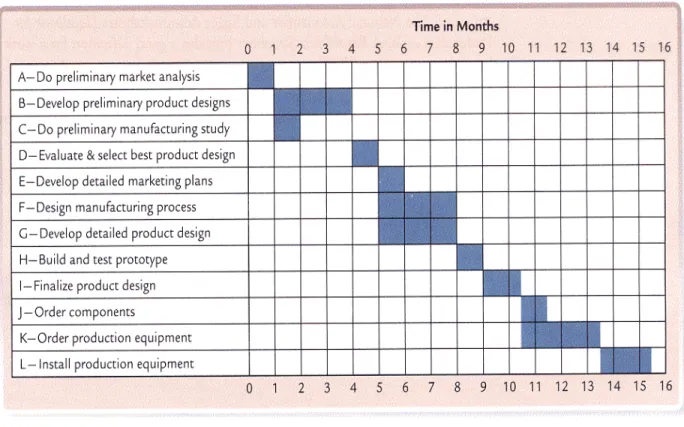
Today’s project managers still use the Gantt chart as the primary tool to communicate project schedule information, but with the aid of computers, it is no longer necessary to draw the charts by hand. Figure 4 displays a Gantt chart created with Microsoft Project and Figure 5 with Microsoft Excel, the most widely used project management software today.
Figure 5. Example of GANTT Chart
Basically there are two basic types of Gantt Charts: Load Charts and Project Planning Charts.
* Load Charts:
This type of chart is useful for manufacturing projects during peak or heavy load periods. The format of the Gantt Load Chart is very similar to the Gantt Project Planning Chart but, in this case, uses time as well as departments, machines or employees that have been scheduled.
* Project Planning Chart
It addresses the time of individual work elements giving a time line for each activity of a project. This type of chart is the predecessor of the following tool: PERT. As it can be seen in the figure, it is really easy to understand the graph, but in developing it you need to take into consideration certain precedence relationships between the different activities of the project. On the chart, everyone is able to see when each activity starts and finishes but there is no possibility to determine when each activity may start or if we can start a particular activity before finishing the immediate predecessor activity. Therefore, we need somehow know the precedence relationships between activities. This is the main reason for using the following tools instead of using exclusively Gantt Charts.
(iii)
PERT/CPM (Critical path Method)The military was the key industry behind the development of several project management techniques. Members of the U.S. Navy Polaris missile/submarine project first used network diagrams in 1958. These diagrams helped managers model the relationships among project tasks, which allowed them to create schedules that were more realistic. Figure 6 displays a network diagram created using Microsoft Project. Note that the diagram includes arrows that show which tasks are related and the sequence in which team members must perform the tasks. The concept of determining relationships among tasks is essential in
Figure 6.
Both methods show precedence relationships explicitly. Although the two methods were developed independently during the fifties, they are surprisingly similar. Both methods, PERT and CPM, use a graphic representation of a project that it is called "Project Network" or "CPM diagram", and it is used to portray graphically the interrelatioships of the elements of a project and to show the order in which the activities must be performed.
1.
Critical Path Method (CPM) Background • Need a list of activities for some project. • Each activity has list of predecessors activities.• An AOA (activity on arc) network represents the project. 1. Start node 1 has arcs for all activities with no predecessors. 2. Finish node f has no successors.
3. Start node is numbered with lower number than finish node. 4. Each arc is labelled with an activity and an activity time . 5. Two nodes can be connected by at most one arc.
6. Dummy activities are added to avoid rule 5 conflicts.
2.
CPM• ET(i), the early event time for node i, is defined by
a) determining all immediate predecessors j for node i, and
b) setting .
• LT(i), the late event time for node i is defined by a) determining immediate successors j to node i, and
b) setting .
• FF(i,j), the free float time, is allowed increase in starting time for (i,j) without delaying project: .
• LP Formulation: let be time for node j event.
Min , subject to , and all urs.
• Crashing the project: re-solving the problem with additional costs, and constraints on 's.
3.
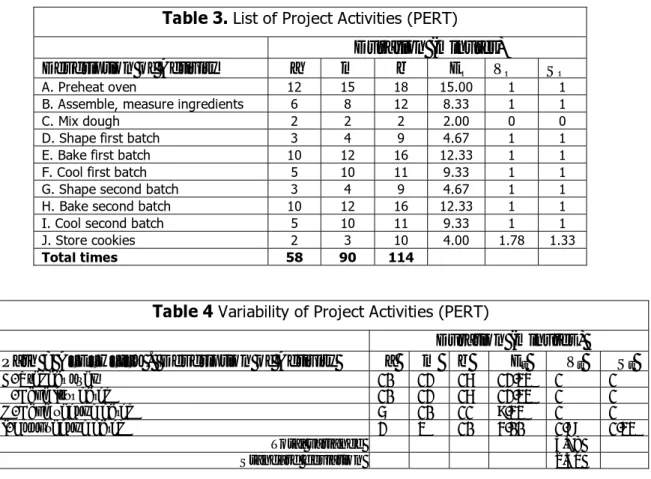
Program Evaluation and Review (PERT):assume 's are Beta random variables and compute expected value for critical path length,
using and .
4.
CPM vs. PERTCPM or "Critical Path Method" PERT or "Project Evaluation and Review Technique"
• Tool to analyze project and determine duration, based on identification of "critical path" through an activity network.
• Knowledge of the critical path can permit management of the project to change duration.
• A single estimate for activity time was used that did not allow for variation in activity times
• Activity times are assumed to be known or predictable ("deterministic")
• Activities are represented as nodes or circles
• Another derivative of the GANTT chart
• Multiple time estimates were used for each activity that allowed for variation in activity times
• Activity times are assumed to be random, with assumed probability distribution ("probabilistic")
• Activities are represented by arrowed lines between the nodes or circles
Over time, CPM and PERT merged into one technique referred to as "CPM/PERT".
• Visually easier to see precedence relationships
• Ideal for large projects with many activities
Two types:
• Activity-on-node (AON) -- nodes represent activities and arrows show precedence relationships.
• Activity-on-arrow (AOA) -- arrows represent activities and nodes are events for points in time. Dummy
inserted into the network to show a precedence relationship, but it does not represent any actual passage of time.
Activity Slack Slack is computed by:
• avoid delays
• compensate for an inaccurate time estimate Most network activities are estimates
• project uniqueness means little historical basis
• subject to a lot of uncertainty
• Using probabilistic methods rather than deterministic to minimize uncertainty Activity Scheduling
o Earliest Start time (ES): The earliest time an activity can start
o Forward pass: Start at the first node and move forward through the network to determine the
earliest start time for an activity
o Earliest Finish time (EF): The earliest start time plus the activity time
EFij = ESij + t ij
# Latest Start time (LS): The latest time an activity can start without delaying the completion of the project beyond the critical path time
LSij = LFij – tij
# Latest Finish time (LF): The latest time an activity can be completed and still maintain the critical path time
5.
Probabilistic Time EstimatesPERT-type approach uses 3 time estimates for each activity
• most likely time (m)
• subjective estimate of most frequent time
• optimistic time (a)
• shortest possible time (ideally)
• pessimistic time (b)
• continuous w/ no predetermined shape
• others types of distribution are no more or less accurate
Human judgment element
• Process no better than network and resource estimates
• Project teams make these subjective estimates
• Knowledgeable people must determine which events must precede others and how long activities will take.
(iv)
REPRESENTING A PROJECT NETWORKIn order to represent a project network, two basic elements are used:
A cycle, called "node", represents an event. An event describes a checkpoint. It does not symbolize the performance of work, but it represents the point in time in which the event is accomplished.
An arrow, called "arc", represents an activity. The network will try to reflect all the relationships between the activities.
Two simple rules govern the construction of a project network:
A. Each activity must be represented by only one directed arc or arrow. B. No two activities can begin and end on the same two nodes or cycles.
The temptation is to represent these relationships as:
But then we have broken the second rule earlier mentioned. To show that activities A and B precede C, whereas activity B precedes activity D, we use a dummy activity as shown in the figure:
To construct a project network, first of all, we need a list of activities showing the precedence relationships between the different activities involved, a list as the following example:
# PROJECT NETWORK
Because each activity must have a unique pair of starting and ending nodes, we must use a dummy activity to draw the first four activities, as shown in the figure. Constructing a project network, is a trial-and-error process. It usually takes two or three attempts to produce a neatly constructed network. After constructing the network, the duration of each activity should be shown in parenthesis. But, what is this for? With this representation we can determine the minimum completion time for the project. We do this by starting at the originating event of the network (node 1) and determining the earliest time we can start an activity, given the activities that precede it and assuming that all the activities start as soon as possible and are completed as soon as possible. For example for the first one, it would be:
Where T=0 is the Earliest Start Time (ES) for activity A and T=1 is the Latest Start Time (EF) for activity A. Continuing this process results in the network:
# PROJECT NETWORK WITH EARLIEST TIME
Notice that in the case of activity D for example, it only starts after both precedence activities B and C are completed. If everything goes as planned, the project will take 15.5 months to complete. However, every activity needs to start as early as possible for the project to be completed in 15.5 months. We can use a similar process to determine which activities we can delay, and by how much, without increasing the completion time of the project. To calculate this, we can define the "Latest Finish Time" (LF), and the "latest Start Time" (LS) for each activity, for example:
Continuing with this process we can obtain
# PROJECT NETWORK WITH EARLIEST AND LATEST TIMES
Now we have a project network with the earliest and the latest start and finish times, where:
Then I can calculate how much I can delay an activity. That is the "Slack Time." To determine it, we can use either or two equations:
Slack Time: LS-ES Slack Time: LF-EF
The slack represents how long we can delay the activity without delaying the entire project. The activities that have zero slack lie on a path through the network. This path is called the "Critical Path," and the activities are called "Critical Activities." If you delay these activities, you will delay the entire project. Every project has at least one critical path, but there can be more than one. Another procedure to determine the critical path is just noticing which is the largest path through the network, in this case A-B-D-G-H-I-K-L.
# PERT/CPM: DIFFERENCES
Both tools lead to the same end: a critical path and critical activities with slack time equal to zero. The differences between these tools come from how they treat the activity time. PERT treats activity time as a random variable whereas CPM requires a single deterministic time value for each activity. Another difference is that PERT focuses exclusively on the time variable whereas CPM includes the analysis of the Time/Cost Trade-off.
# PERT
We have a high degree of uncertainty in regard to the completion time of many activities. It makes sense in the real world that you do not really know how long a particular activity will take, specially talking about certain activities such as research and development. In this case, we can look at the project completion time in a probabilistic fashion and for each activity we can define:
a. Optimistic time estimate: an estimate of the minimum time an activity will require. b. Most likely time estimate: an estimate of the normal time an activity will require. c. Pessimistic time estimate: an estimate of the maximum time an activity will require.
With the expected time for each activity we can determine which is the critical path. Using three assumptions, we can conclude that project completion time or critical path completion time has a normal distribution. Using this, we can determine probabilities, using completion time as a normal random variable, mean and standard deviation.
Project Management Tools
In brief:
A Gantt chart lists tasks in a project on a timeline with their interdependencies. It often also shows who is responsible for what task. It is especially useful for planning tasks in a project, and monitoring progress as the project goes on. Gantt charts emphasize time rather than task relationships.
A PERT chart, in comparison, looks more like a flow chart and concentrates on the relationships between tasks (especially their dependencies) and less on the timeline. PERT charts emphasize task relationships rather than time.
Both tools are commonly used, and they are often both used for the same project.
The PERT chart is sometimes preferred over the Gantt chart because it clearly illustrates task dependencies. On the other hand, the PERT chart can be much more difficult to interpret, especially on complex projects. Frequently, project managers use both techniques.
A PERT chart is a project management tool used to schedule, organize, and coordinate tasks within a project. PERT stands for Program Evaluation Review Technique, a methodology developed by the U.S. Navy in the 1950s to manage the Polaris submarine missile program. A similar methodology, the Critical Path Method (CPM), which was developed for project management in the private sector at about the
same time, has become synonymous with PERT, so that the technique is known by any variation on the names: PERT, CPM, or PERT/CPM.
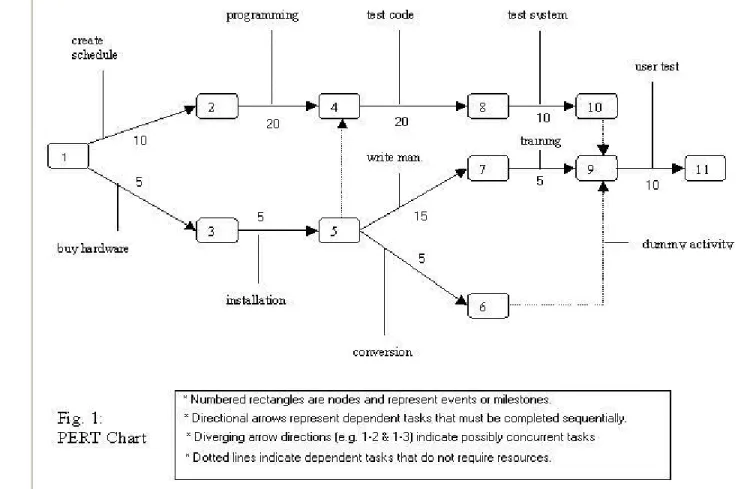
indicates the sequence of tasks. In the diagram, for example, the tasks between nodes 1, 2, 4, 8, and 10 must be completed in sequence. These are called dependent or serial tasks.
The tasks between nodes 1 and 2, and nodes 1 and 3 are not dependent on the completion of one to start the other and can be undertaken simultaneously. These tasks are called parallel or concurrent tasks.
Tasks that must be completed in sequence but that don't require resources or completion time are considered to have event dependency. These are represented by dotted lines with arrows and are called
dummy activities.
For example, the dashed arrow linking nodes 6 and 9 indicates that the system files must be converted before the user test can take place, but that the resources and time required to prepare for the user test (writing the user manual and user training) are on another path. Numbers on the opposite sides of the vectors indicate the time allotted for the task.
PREVIOUS STEPS
Before attempting to use these tools, the project's information must be assembled in a certain way. I include a basic description of the preceding steps.
The project planning process consists of the following: 1. Setting the project start date
2. Setting the project completion date
3. Selecting the project methodology or project life cycle to be used
4. Determining the scope of the project in terms of the phases of the selected project methodology or project life cycle
5. Identifying or selecting the project review methods to be used
6. Identifying any predetermined interim milestone or other critical dates which must be met. 7. Listing tasks, by project phase, in the order in which they might be accomplished.
8. Estimating the personnel necessary to accomplish each task 9. Estimating the personnel available to accomplish each task 10. Determining skill level necessary to perform each task 11. Determining task dependencies
-Which tasks can be done in parallel
-Which tasks require the completion of other tasks before they can start 12. Project control or review points
13. Performing project cost estimation and cost-benefit analysis
Work breakdown Structures
The development of a project plan is predicated on having a clear and detailed understanding of both the tasks involved, the estimated length of time each task will take, the dependencies between those tasks and the sequence in which those tasks have to be performed. Additionally, resource availability must be determined in order to assign each task or group of tasks to the appropriate worker.
One method used to develop the list of tasks is to create what is known as a work breakdown structure.
A definition
A work breakdown structure (WBS) is a hierarchic decomposition or breakdown of a project or
major activity into successive levels, in which each level is a finer breakdown of the preceding one. In final form a WBS is very similar in structure and layout to a document outline. Each item
The WBS may be drawn in a diagrammatic form (if automated tools are available) or in a chart resembling an outline.
The WBS begins with a single overall task representing the totality of work to be performed on the project. This becomes the name of the project plan WBS. Using a methodology or system life cycle (analysis, design and implementation) steps as a guide, the project is divided into its major steps. The first phase is project initiation; the second major phase is analysis, followed by design, construction, testing, implementation, and post-implementation follow-up. Each of these phases must be broken in their next level of detail, and each of those, into still finer levels of detail, until a manageable task size is arrived at. The first WBS level for the life cycle would be:
WBS number Task Description 1.0 Project initiation 1.1 Draft project plan 2.0 Analysis phase 2.1 Plan user interviews 2.2 Schedule users interviews 3.0 Examination and test 4.0 Design 5.0 Test
6.0 Implementation 7.0 Post implementation review
Tasks at each successively finer level of detail are numbered to reflect the task from which they were derived. Thus, the first level of tasks would be numbered 1.0, 2.0, 3.0, and so forth. Each of their subtasks would have a two part number: the first part reflecting the parent task and the second part, the subtask number itself, such as 1.1, 1.2, or 1.3.
As each of these, in turn, decomposed or broken down into its component tasks, each component receives a number comprised of it's parent number plus a unique number of its own.
A definition
A manageable task is one in which the expected results can be easily identified; success, failure, or
completion of the task can be easily ascertained; the time to complete the task can be easily estimated; ant the resource requirements of the task can be easily determined.
Program Evaluation and Review Technique (PERT)
Program evaluation and review technique (PERT) charts depict task, duration, and dependency information. Each chart starts with an initiation node from which the first task, or tasks, originates. If multiple tasks begin at the same time, they are all started from the node or branch, or fork out from the starting point. Each task is represented by a line which states its name or other identifier, its duration, the number of people assigned to it, and in some cases the initials of the personnel assigned. The other end of the task line is terminated by another node which identifies the start of another task, or the beginning of any slack time, that is, waiting time between tasks.
Each task is connected to its successor tasks in this manner forming a network of nodes and connecting lines. The chart is complete when all final tasks come together at the completion node. When slack time exists between the end of one task and the start of another, the usual method is to draw a broken or
A PERT chart may have multiple parallel or interconnecting networks of tasks. If the scheduled project has milestones, checkpoints, or review points (all of which are highly recommended in any project schedule), the PERT chart will note that all tasks up to that point terminate at the review node. It should be noted at this point that the project review, approvals, user reviews, and so forth all take time. This time should never be underestimated when drawing up the project plan. It is not unusual for a review to take 1 or 2 weeks. Obtaining management and user approvals may take even longer.
When drawing up the plan, be sure to include tasks for documentation writing, documentation editing, project report writing and editing, and report reproduction. These tasks are usually time-consuming, so don't underestimate how long it will take to complete them.
PERT charts are usually drawn on ruled paper with the horizontal axis indicating time period divisions in days, weeks, months, and so on. Although it is possible to draw a PERT chart for an entire project, the usual practice is to break the plans into smaller, more meaningful parts. This is very helpful if the chart has to be redrawn for any reason, such as skipped or incorrectly estimated tasks.
Many PERT charts terminate at the major review points, such as at the end of the analysis. Many organizations include funding reviews in the projects life cycle. Where this is the case, each chart terminates in the funding review node.
Funding reviews can affect a project in that they may either increase funding, in which case more people have to made available, or they may decrease funding, in which case fewer people may be available. Obviously more or less people will affect the length of time it takes to complete the project.
Critical Path Method (CPM)
Critical Path Method (CPM) charts are similar to PERT charts and are sometimes known as PERT/CPM. In a CPM chart, the critical path is indicated. A critical path consists that set of dependent tasks (each depedent on the preceding one) which together take the longest time to complete. Although it is not normally done, a CPM chart can define multiple, equally critical paths. Tasks which fall on the critical path should be noted in some way, so that they may be given special attention. One way is to draw critical path tasks with a double line instead of a single line.
Tasks which fall on the critical path should receive special attention by both the project manager and the personnel assigned to them. The critical path for any given method may shift as the project progresses; this can happen when tasks are completed either behind or ahead of schedule, causing other tasks which may still be on schedule to fall on the new critical path.
Gantt Charts
A Gantt chart is a matrix which lists on the vertical axis all the tasks to be performed. Each row contains a single task identification which usually consists of a number and name. The horizontal axis is headed by columns indicating estimated task duration, skill level needed to perform the task, and the name of the person assigned to the task, followed by one column for each period in the project's duration. Each period may be expressed in hours, days, weeks, months, and other time units. In some cases it may be necessary to label the period columns as period 1, period 2, and so on.
The graphics portion of the Gantt chart consists of a horizontal bar for each task connecting the period start and period ending columns. A set of markers is usually used to indicate estimated and actual start and end. Each bar on a separate line, and the name of each person assigned to the task is on a separate
Comparison between estimated start and end and actual start and end should indicate project status on a task-by-task basis.
Variants of this method include a lower chart which shows personnel allocations on a person-by-person basis. For this section the vertical axis contains the number of people assigned to the project, and the columns indicating task duration are left blank, as is the column indicating person assigned. The graphics consists of the same bar notation as in the upper chart indicates that the person is working on a task. The value of this lower chart is evident when it shows slack time for the project personnel, that is, times when they are not actually working on any project.
Project Management Terms
Lead time* Occurs when a task should theoretically wait for its predecessor to finish, but can actually start a little early. The time
that the tasks overlap is lead time. For example, when replacing computers in a computer lab, you could actually start bringing in the new computers while the old ones were being packed up and moved out. The time during which packing and unpacking can happen at the same time is lead time.
*Not to be confused with the economic "Lead time" which refers to the time between conceiving an idea and bringing it to fruition
Lead time, according to IT@Work, are waiting times (like lag times) that do not involve dependencies.
MS Project's help says: "Lead time is overlap between tasks that have a dependency. For example, if a task can start when its predecessor is half finished, you can specify a finish-to-start dependency with a lead time of 50 percent for the successor task."
Lag time Lag is the minimum amount of time that must pass between the finish of one activity and the start of its
successor(s). For example, if task A is painting a wall, and dependent task B is putting up a picture on the wall, there would need to be some lag time between the end of task A and the start of task B to let the paint dry.
Lag time is shown in a PERT chart as an arrow with a duration but no task assigned to it.
MS Project's help says: "Lag time is a delay between tasks that have a dependency. For example, if you need a two-day delay between the finish of one task and the start of another, you can establish a finish-to-start dependency and specify two days of lag time."
Float time a synonym for slack time
Slack time the amount of time a task can be extended or delayed before it impacts on the starting time of other tasks. Tasks A
and B start at the same time. Task C is dependent on both tasks A and B. Task A takes 2 days and task B takes 5 days. Task A has 3 days' slack. It can run 3 days overtime before it affects the planned starting time for task C.
Milestone An event of zero duration that marks a significant point of progress in a project. Milestones are used to see whether
a project is on time or not. A milestone may be "Design is finished", "Sign contract", "Project Ends" etc.
Event Something that happens, but that is not a task (it takes time, but does not take labour or resources). e.g. "Concrete
dries"
Task Something that needs to be done that requires some time.
Dependent
task A task that cannot begin before a previous task finishes. e.g. Task B, 'putting on shoes' is dependent on task A, 'putting on socks'.
Critical
path The series of tasks from the beginning of a project up to its end that takes the longest time. This is also the time in which all tasks in the project can be completed. By definition, no task on the critical path can have any slack shortest time. In other words, no task on the critical path can be delayed or extended without affecting the finishing date of the project.
Critical
Work Breakdown Structure (WBS)
Table showing tasks, durations, resources (people responsible) and dependencies. To make a WBS accurate, you have to know the constraints of the environment. E.g. Constraint - the family's house has two showers.
Dummy
Task Shown by a dotted arrow on a PERT chart, it shows a dependency but no task. I know that means nothing, so see
the Buffalo PERT example.
Here's another take on dummy tasks that may make sense to you.
Dummy tasks are tasks that must be completed in sequence but that don't require resources or completion
time. These are represented by dotted lines with arrows.
For example, the dashed arrow linking nodes 6 and 9 indicates that task 9 can't start until "conversion" (as well as "training" and "test system" are all finished, but nothing needs to be done by anyone between the end of conversion and the start of the next task.
PERT Introduction
A PERT chart is a project management tool used to schedule, organize, and coordinate tasks within a project. PERT stands for Program Evaluation Review Technique, a methodology developed by the U.S.
Navy in the 1950s to manage a nuclear submarine missile program.
Below is a PERT chart drawn to show the development of a system.
Yes - it was not drawn very well, but it's late and I'm tired.
Here are the questions to ponder before we discuss the answers.
• EXAM QUESTION 1: Which tasks are on the critical path of the PERT chart above?(1 mark)
• EXAM QUESTION 2: What is the slack time for tasks C, D and G?(1 mark)
• EXAM QUESTION 3: The person working on task C tells the project manager that he can't start work until one day after the scheduled starting date. What impact would this have on the completion date of the project? Why?(2 marks)
• EXAM QUESTION 4: Task A will be delayed by 2 days because some equipment has arrived late. If the project manager still wants to finish the project within the original time frame, he will need to shorten the time for one or more of the tasks. What steps can he take to reduce the number of days allocated to a task? (2 marks)
• EXAM QUESTION 5: The project manager decides to reduce the time needed for tasks D and F by one day each. How effective will this reduction be in achieving his aim of maintaining the original finish time for the project?(2 marks)
The CIRCLES mark the beginnings and ends of TASKS to be done in the project. Also called NODES. The ARROWS are the tasks themselves. They are identified by letters A to I. In a real PERT chart, the actual names of tasks would be used instead of letters. The lengths of the arrows does not relate to their length in time.
The NUMBERS after the task names are the DURATIONS of the task. The time interval may be anything from picoseconds to years. Let's assume these timings are in days.
Important point to remember: the ARROWS are tasks, not the circles (nodes).
When a node has two or more tasks branching from it, it means those tasks can be done concurrently (at the same time.)
When a node has incoming arrows, it means the incoming task must be completed before progress may continue to any arrows heading away from the node. e.g. Task A must be completed before tasks B or G may begin.
You need to be able to examine and interpret charts like this PERT. Let's examine it in English.
• Task A is the first task and takes 2 days. When it is done, tasks B and G can begin. If we follow the task G line, it takes 2 days to reach task H which takes 5 days. Task H leads to the final task, I. Total time for following this path is 2 + 2 + 5 + 3 = 12 days. The path would be described as A,B,G,H,I.
• When task G began, so did task B (with another team of workers). When task B finished, after 3 days, there is another opportunity to run some tasks concurrently. So after B, tasks C and D began at the same time.
o If we follow task C, it takes 1 day to reach task E, which leads to the final task I. Total time for this path was 2 + 3 + 1 + 4 + 3 = 13 days.
o If we followed task D, which takes 3 days, it leads to task F (also 3 days) before reaching the final task, I. Total time for this path is 2 + 3 + 3 + 3 + 3 = 14 days.
• Note that tasks E, F and H must all be finished before task I can begin.
You will have noticed that there are several paths through from task A to task I. Each of these paths takes a different amount of time.
What is the shortest possible time for the project to take (without leaving any tasks out)?
14 days (the longest possible path). Yeah, it sounds odd that the shortest time is the longest path, but consider another example. You are getting ready for school. At the kitchen table, you have to have breakfast while you finish your maths homework. You have to finish both before you can leave. Breakfast takes 12 minutes. Maths takes 20 minutes. What's the shortest time you would need to leave? Twenty
minutes, because both tasks must be finished. Just because one task finishes before the other, you can't leave yet. So in the chart above, the shortest project time would be 14 days.
That is the CRITICAL PATH of the project: the sequence of tasks from beginning to end that takes the longest time. No task on the critical path can take more time without affecting the end date of the project. In other words, none of the tasks on the critical path has any SLACK.
SLACK is the amount of extra time a task can take before it affects a following task. In the breakfast example above, the breakfast could take another eight minutes before it affected the leaving time, so it has eight minutes' slack.
Tasks on the critical path are called CRITICAL TASKS. No critical task can have any slack (by definition).
EXAM QUESTION 1:Which tasks are on the critical path of the PERT chart above? (1 mark) ANSWER: A,B,D,F,I
EXAM QUESTION 2: What is the slack time for tasks C, D and G? (1 mark) a. Slack time for task C: let's isolate that bit of the PERT chart.
To work out the slack time for a task, backtrack from the task to the node where the task split off from other concurrent tasks. In our case, it is the node directly before task C. Also look forward to the node where task C and the other concurrent tasks (D,F) join up again with C.
In the picture below, the beginning node is marked red and the ending node is marked green...
The top pair of tasks (C,E) is being done at the same time as the bottom pair of tasks (D,F). Together, C and E take 1 + 4 = 5 days. Together, D and F take 3 + 3 = 6 days, so tasks C,E will finish 1 day before D, F finish. Therefore, either task C or task E could take one extra day to finish without disturbing the task that comes after the green node.
That is the SLACK time for task C (it equally applies to task E: but remember the slack time is shared between them. They can't both take another day without causing delays.)
So, the slack time available to task C is ONE DAY.
b. Good. Let's try the next question: what is the slack time for task D? This is easy, when you remember that task D is on the critical path. By definition, critical tasks HAVE NO SLACK: they cannot run overtime without affecting the ending date of the project. So, the easy answer for this is THERE IS NO SLACK for task D.
Once again, I have gone back from task G to the (red) node where it branches off from a concurrent task. We look ahead to where task G's path rejoins its concurrent brothers (the green node).
Tasks G,H take a total of 7 days. Meanwhile, tasks B,C,E take 3 + 1 + 4 = 8 days and tasks B,D,F take 3 + 3 + 3 = 9 days. So, task G could run an extra 2 days before it caused delays, since it had to wait for tasks B,D,F to finish anyway.
So the answer would be, The slack time for task G is 2 days.
EXAM QUESTION 3:the person working on task C tells the project manager that he can't start work until one day after the scheduled starting date. What impact would this have on the completion date of the project? Why? (2 marks)
Let's look at the whole PERT chart again...
Task C starting one day late is not significant to the ending date of the project. It would cause task E to start a day late (because task E is dependent on task C finishing first), but remember earlier we found that task C had ONE DAY OF SLACK. Therefore, if task C started a day late, it would merely use up its day of slack and no disruption would be felt by the time task E finished and the other concurrent tasks joined up to begin task I. So the answer is: task C finishing one day late would have no impact on the completion date of the project because it has one day of slack it could use.
EXAM QUESTION 4: Task A will be delayed by 2 days because some equipment has arrived late. If the project manager still wants to finish the project within the original time frame, he will need to shorten the time for one or more of the tasks. What steps can he take to reduce the number of days allocated to a task? (2 marks)
your most valuable tool in an exam!
EXAM QUESTION 5:The project manager decides to reduce the time needed for tasks D and F by one day each. How effective will this reduction be in achieving his aim of maintaining the original finish time for the project? (2 marks)
Keep in mind that tasks D and F were chosen because they were on the critical path, and the only way to affect the finishing date is to affect critical tasks. Let's modify the PERT chart to show the new timeline if the manager shortened the time needed for tasks D and F.
Have a think: what has changed?
YES! Reducing tasks A,B,D,F,I by a total of 2 days (to 12 days) means it is no longer the critical path! It is no longer the longest route from start to finish. In other words, it has been demoted.
What is the new critical path?
Right: Path A,B,C,E,I is now the longest at 13 days so it becomes the new critical path.
So - the project manager has reduced the old critical path from 14 to 12 days, but the new critical path still takes 13 days. So, the project will now finish ONE day earlier than originally.
Reducing both tasks D and F by one day each was unnecessary because after a 1 day reduction, the tasks were no longer critical. To reduce the overall project time further, the manager would have had to shift his attention to the new critical path, and try to reduce the times of the new critical tasks.
So, an answer could be: Reducing tasks D and F each by one day would only shorten the project by one day since after a 2 day reduction, tasks D and F are no longer on the critical path. To further shorten the project time, the project manager would have to shorten tasks on the new critical path A,B,C,E,I
There are a couple of difference flavours of PERT charts: Activity on Arrow and Activity on Node
Task
Predecessors Tasks
(Dependencies) (Weeks)Time
A - 3 B - 5 C - 7 D A 8 E B 5 F C 5 G E 4
PERT Diagram using Activity On Arrow (AOA) convention
• The critical path is through activities C, F, H, J (can you prove it?) • The expected project duration is 21 weeks (7+5+5+4)
PERT Diagram using Activity On Node (AON) convention
QUESTIONS
1. Name this type of project management tool (1 mark)
2. How many possible paths are there from the start to the end of the project? (1 mark) 3. Identify the tasks on the critical path, and the length of the critical path (1 mark)
4. If task E took a day longer than planned, what effect if any would this have on the finishing date of the project? (1 mark)
5. If task D took 3 days longer than planned, what effect would this have on the finishing date of the project? (1 mark)
6. How many days over schedule could task A run without affecting the end date of the project? (1 mark)
7. What is this amount of time called? (1 mark)
8. The project manager wants to reduce the total length of the project by 4 days. By bringing in extra workers, she manages to reduce the durations of tasks B and L by 2 days each. Explain whether she will achieve her desired finishing date, and explain why. (1 mark)
This problem comes from the 2000 end of year IPM exam. It has been roundly criticised for its difficulty and vagueness. Let's see what we can do with it.
"Hopeful Universiti Teknikal Malaysia Melaka (UTeM) Council decided at its last meeting that a new computer laboratory was required. The project commenced on Monday 16 October. The plan for the process and its progress are shown in the diagram above. The school council has decided to manage to refurbishment of the room and is required to have the room completed by Friday 22 December. Due to class requirements, the commencement of alterations to the classroom cannot commence before Monday 11 December."
First: this Gantt chart was produced using Microsoft Project. This is a common tool for producing Gantt charts, but it is only one way of doing so: other charts may look a bit different.
Look at the time scale at the top of the chart. Notice anything odd? Yes, folks. The minor date scale (under the line beginning "16 Oct '00") shows every fourth day. Makes it much harder to read. Heaven
knows why the examiners did it (I can guess: it was the only way they could get it to fit onto the printed page.)
The major scale is in units of fortnights (the first step is 16 Oct, the next is the 30th - 14 days apart.) The dotty lines going down the chart mark beginnings of major time units. e.g. task 8 begins on the dotty line that marks the beginning of major unit beginning December 11 so you can easily tell it starts on Dec 11.
There are 13 tasks, listed downwards in the left column.
The blue bars graphically show the length of each task (which is also visible numerically in column 2)
The arrows from the end of one task to the beginning of another mean the second task must wait for the first task to end before the second can begin. This is called a "dependency". The earlier task is called the "predecessor".
Most tasks follow each other in a "lock-step" manner until you reach tasks 10 and 11 which overlap: overlapping bars mean the tasks can be carried out concurrently (at the same time.)
Both tasks 10 and 11 are dependent on task 9. Task 11 starts on the same day as task 10 and lasts one workday longer.
Notice however that task 10's bar is a fair bit shorter than task 11's even though they are only one workday different: this is because task 11 spans a weekend, so its bar is actually 5 days long even though no work is done on the weekend.
The diamonds show milestones. Milestones are significant points of progress in the project. They have
zero length: no work is actually needed for a milestone. They mark major points of project development.
The black lines in the bars of the first 3 tasks indicate how much of the task has been completed so far. You can see tasks 1 and 2 are finished and task 3 is half-finished. This lets a project manager keep track of where the project is actually up to.
• Quick question 1: When does the project start?
Answer: 16 October (see where task 1's bar begins on the dotty line that starts off "16 Oct")
• Quick question 2: When does the project end?
Answer: 21 December (the milestone is dated so you can easily tell) [actually, I believe the milestone is wrong - see below]
• Quick question 3: The exam questions below are worth a total of 5 marks: how long should you spend on them?
Answer: For 2003 and beyond, the exam is worth 90 marks and you have 120 minutes, therefore 1.333 minutes per mark.