This draft submitted to the Joint Commission Journal on Quality and Safety, 6/28/04.
Reducing Waste and Errors:
Piloting Lean Principles at IHC
Cindy Jimmerson, RN Consultant Missoula, Montana Dorothy Weber,* MSW
Organization Effectiveness Consultant, Intermountain Healthcare Salt Lake City, Utah
Durward K. Sobek, II, PhD
Associate Professor, Industrial and Management Engineering, Montana State University Bozeman, Montana
*Corresponding Author. Please submit all comments and correspondence regarding this paper to
Dr. Terry Clemmer, medical director of the medical/surgical ICU at LDS Hospital in the Intermountain Health Care system of Salt Lake City, is watching how the ICU clerk is doing her work with a clipboard in hand. He’s acting as an outside observer, noting each time she
changes activities or gets interrupted. As part of a pilot program applying principles from the Toyota Production System (TPS) to IHC, Dr. Clemmer is practicing a principle central to TPS: direct observation to gain a deep understanding of the way work really happens.
What Dr. Clemmer and 90 other staff have discovered through the pilot study is that most hospital work processes contain tremendous waste (non value-added activities). It repeatedly surprises observers just how much waste they live with in their day-to-day work without realizing it, as much as 35% according to one report1. One reason for this much waste is that how processes should ideally work is rarely specified clearly in healthcare operations, creating inconsistency in care, unreliable delivery systems, and constant caregiver interruptions. These in turn create inefficiencies, higher operating costs, increased potential for errors and worker frustration.
The Toyota Production System, also called “lean manufacturing,”2 represents a fresh way to look at work systems within healthcare. Toyota has developed an advanced system based on fundamental Industrial Engineering principles, combined with operational innovations to achieve unprecedented levels of waste reduction and efficiency while simultaneously increasing product quality. Ongoing research at Montana State University and Community Medical Center in Missoula, Montana, has adapted several key tools and principles from Toyota to healthcare, and demonstrated their effectiveness in improving hospital operations3,4. Intermountain Health Care (IHC) has recently conducted a pilot to test Toyota’s methods for continuous improvement
involving every employee in improving work processes, and found them powerful and effective. This article describes the key elements of the Toyota Production System that have
particular relevance to healthcare, and the tools and principles that have been adapted. We then describe IHC’s initial experience with TPS, including the approach used, results to date, key learning, and where we hope to go from here.
Why Learn from Toyota?
In the 1980’s, the US automotive industry was rapidly losing market share to foreign competitors, particularly Japanese automakers. They could manufacture automobiles with fewer defects and higher customer satisfaction than US automakers. Yet they were still cost
competitive despite overseas shipping costs and tariffs2.
This amazing turnaround caught the attention of US academics. When numerous
researchers traveled to Japan to discover the secret of their success (see Forward in Womack, et al.2), they did not find, as some expected, highly mechanized factories finely tuned to defect-free production. Nor did they find armies of inspectors to ensure quality output. Instead, they found an entirely different system of production—so new and innovative, in fact, that they gave it new name, “lean manufacturing.” The term was coined because this system for producing
manufactured goods obtained higher quality output at half the cost in half the time of traditional manufacturing methods.
Over the last 10-15 years, researchers have brought lean manufacturing practices to the US with astounding success5,6. Companies using these practices report productivity
improvements in the triple digits, defect rates falling by orders of magnitude, significantly shortened order-to-delivery times, increased customer satisfaction, greatly reduced employee
turnover, and more. The concepts are quite literally revolutionizing manufacturing in this country.
Even though lean manufacturing is often described as a Japanese phenomenon, in fact the system was invented by one company: Toyota Motor Company7. As Toyota perfected its system and began making huge strides domestically, other Japanese manufactures took note and copied its system8. What American researchers saw and reported as a Japanese method was actually just Japanese manufacturers copying Toyota more quickly than American companies!
Toyota’s production system has enabled the company to become the recognized industry leader in product quality and profitability. In the past year the company cut $2.6 billion out of its $113 billion in manufacturing costs without any plant closures or a single layoff. They expect to cut another $2 billion this year9. Toyota just passed Ford Motor Corporation to become the No. 2 automaker globally in sales volume, the first time in 75 years that Ford has been dislodged from its No. 2 position10. We believe that healthcare can learn a great deal about understanding and improving work processes from this best-in-class company.
Toyota Production System Principles
Some describe lean manufacturing as a philosophy, a perspective that abhors waste in any form, relentlessly strives to eliminate defects, and continually attacks both in a never-ending pursuit of perfection11,12,13. While such platitudes may help motivate attitudes for continuous improvement, they provide little by way of practical guidance on how to do it. In apparent response, most descriptions of lean manufacturing quickly move beyond the philosophical to an interrelated set of practices that range from overall material flow in the factory to detailed work and equipment design to human resource practices2,11,13,14,15. The difficulty, though, is that the tools and practices are finely tuned to a specific environment, that of high volume, low variety
production of durable goods. It seems unlikely that the specific practices could transfer to another environment with equal success. In fact, one can find few (if any) documented cases of lean implementation not closely tied to manufacturing.
Spear and Bowen16 imply a possible reason for this inability to transfer the system across domains. They claim that even though many of the practices have been studied and documented over the years, the essence of Toyota’s system consists of tacit knowledge, and is so woven into the culture, not written down, and workers could not articulate it. Spear conducted his Ph.D. research observing Toyota gurus in action as they transformed slow, wasteful factories into smooth running, lean operations. He discovered that the “essence” heretofore missing could be found in a set of principles that guide process improvement at Toyota. From this point forward, we refer to the Toyota’s production system as TPS rather than lean, to distinguish the principles from the practices. Interestingly, the principles described next are very consistent with one of the author’s prior work on Toyota’s vehicle design system17, indicating a strong possibility for transfer across domains.
As a first principle, Toyota relentlessly pursues an ideal state of error-free work16. Every change must move the organization closer to this ideal along one or more dimensions; otherwise, the change is not approved. Toyota’s notion of “ideal” fits healthcare so well we adapted it as shown in Figure 1.
FIGURE 1: A NOTION OF IDEAL FOR HEALTHCARE (ADAPTED FROM SPEAR AND BOWEN16)
A second principle is problem solving that happens as close to the event as possible, in time and person, supported by a coach. Problems are quickly identified because clear
specification of the work and clear definitions of “defect free” outcomes makes it readily apparent when defect free does not occur (i.e., they do not conform to the ideal). Line workers are considered experts at doing the work and at re-designing work, recognizing employees as assets rather than expense items.
Third, vigilant consideration of the current work systems, and evaluation of the ability to produce defect-free, drive a production system that changes as soon as a better way is known. Proposed changes are called “countermeasures” (not one-time “solutions” or temporary “quick fixes”), and are implemented as scientific experiments. Hypotheses about expected performance are made explicit, then actual results are measured and compared to predicted18.
Fourth, process redesigns focus on specifying work activities, making clear connections between those requesting and those receiving goods and services, and simplifying the production pathways of goods and services16. Processes improve and problems become more transparent
IDEAL
Exactly what the patient needs, defect free.
One by one, customized to each individual patient. On demand, exactly as requested
Immediate response to problems or changes. No Waste
Safe for patients, staff and clinicians: Physically, Emotionally, & Professionally
when activities are specified according to content, sequence, timing, and outcome so that regardless of who performs the work, it is completed in the best-known way with defect-free results. Processes improve when connections between workers making requests and providing services are direct, simple, and binary—doing so makes them prompt, efficient, and reliable. And, processes improve when goods and services follow the same, simple pathway through the system every time without interruption. These simple rules not only define the ideal work process, they enable workers to quickly see opportunities to improve.
Prior Work at Community Medical Center
Given the challenges of health care—increasing costs, complex regulatory environments, rising error rates, labor shortages in key sectors, and the aging baby boomer population—Sobek and Jimmerson collaborated on a project to determine whether and how the principles of TPS might apply to a healthcare environment. Community Medical Center in Missoula, Montana, agreed to be the test site for the National Science Foundation funded work.
We began by adapting two tools Toyota uses in redesigning work and problem-solving, and applying them to hospital operations. The tools embody the principles described above, and provide a tangible and consistent mechanism to reinforce the principles while facilitating
problem-solving activities. The effort to date has brought about significant, medium-scale improvements across many areas of the hospital, including such diverse areas as a cardiology diagnostic lab, pharmacy, rehabilitation, patient billing, and facility services.
Value Stream Map
Value stream maps graphically represent the key people, material and information flows required to deliver a product or service. They are designed to distinguish value-adding versus
non-value-adding steps. In manufacturing, value-added time is when the part is processed or assembled, and non-value added time is time spent in inventory. In healthcare, a value-adding step would be a nurse’s interview to obtain important information from the patient, while a non-value-adding step is a patient waiting for a physician to arrive at his/her examination room.
Rother and Shook19 provide a hands-on description of a value stream map. Simple diagrams depict the process steps (boxes), the material flow between steps (fat arrows), and information flows indicating work orders/schedules (thin arrows). Key data on the time each step takes and on the time between steps provide a simple means to analyze the overall process, or pathway. The manufacturing VSM is easily adapted to most healthcare operations and
enables the team to document and understand the steps in the request for a product or service and the steps (and delays between those steps) necessary to answer that request. It is used to
understand the high level view of a process and recognize where specific problem solving can be focused to improve the process. It is also a springboard for creating a “future state map” that outlines a clear goal toward which the team applies their improvement efforts.
The Problem-Solving A3 Report
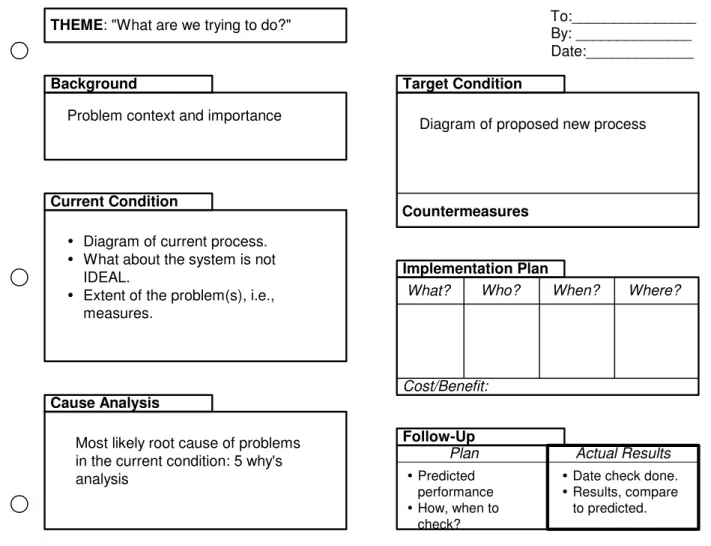
The second tool used to support solving and work redesign is the problem-solving A3 report. An A3 report fits on one side of an 11” x 17”sheet of paper (roughly equivalent to the A3 size paper in metric units; hence the name). We adapted Toyota’s more advanced A3 reporting system to healthcare, and developed a template that has been used on dozens of hospital operations problems (see Figure 2; also, Sobek and Jimmerson4).
FIGURE 2: PROBLEM-SOLVING A3 REPORT TEMPLATE
The A3 report addresses a specific problem in a systematic fashion as follows:
1. The issue or problem is stated through the eyes of the customer (e.g., “patient care is delayed waiting for stat lab results” instead of “the lab doesn’t get the results to the ED on time”).
2. The current work procedures are represented graphically as the “current condition”, based on direct observation of the problem. The graphical representation enhances the writer’s own understanding of the problem while facilitating communication with others. Drawing the current condition diagram must be based on what actually occurs
THEME: "What are we trying to do?" To:_______________
Current Condition
Diagram of current process. What about the system is not IDEAL.
Extent of the problem(s), i.e., measures.
Cause Analysis
Most likely root cause of problems in the current condition: 5 why's analysis
Background
Problem context and importance
Follow-Up Predicted performance How, when to check? By: ______________ Date:_____________ Implementation Plan
What? Who? When?
Cost/Benefit: Target Condition
Diagram of proposed new process
Where?
Plan Actual Results
Date check done. Results, compare to predicted. Countermeasures
day-to-day, rather than recollections, generalizations, or descriptions of what
“should” be happening, so direct observation is the preferred data collection method. 3. Specific problems are identified and quantified, and the root causes investigated
through a deep understanding of the current work processes. The most common approach is the 5 why’s method (asking “why?” five times in series to get to the root of the problem).
4. A better way to work is proposed through a graphical representation of the “target condition” which moves the work closer to the Ideal. The target condition is achieved through a set of countermeasures designed to alleviate the root causes identified.
5. An implementation plan identifies the steps to make the changes happen, and assigns responsibility to individuals with a deadline for completion.
6. A follow-up plan predicts the improvement expected as a result of implementation as specifically as possible, and indicates when and how to measure the success of the implementation. Space is left to record the actual results and compare with predicted. The A3 report guides the solver through a rigorous and systematic problem-solving process. Yet, the one-page format is simple and requires that problems be taken in small, doable chunks so that workers can identify and make improvements rapidly. We have
discovered, though, that coaching is often critical to effective, real-time problem-solving. The coach insists on direct observation to construct the current condition diagram, guides on how to construct a diagram that is both accurate and depicts the problem source, makes sure that the root
and are supportive, cross-checks to make sure the target condition moves the organization closer to ideal and conforms to the guidelines regarding activities, connections, and pathways, and most importantly, makes certain that implementation and follow-up actually happen and get
documented. In short, the coach ensures that the A3 problem-solving process is followed. We have also discovered that at the root of every operational problem we’ve studied is a poorly specified activity, a vague unreliable connection, or a complex pathway. While it’s not proof positive, we have not yet encountered an example where activity specification, connections and/or pathways were not central to the problem.
Training Course
In order to facilitate wide-spread use of the tools and application of the principles at Community Medical Center, Jimmerson developed a 7-week training course and workbook20. Participants meet once per week for two hours. In each session, they learn new material on the tools and principles, then take an assignment back to their home departments to be completed before the next session. By the end, each participant has completed a VSM and A3 report on an actual workplace problem. The outline for the training course is as follows:
Week 1: Introduction to Toyota and TPS principles; direct observation Week 2: Value Stream Mapping: Flow
Week 3: Value Stream Mapping: Data
Week 4: A3 problem solving: current condition and root cause
Week 7: A3 problem solving: report final results
At the end of seven weeks, each participant has enough foundation to initiate problem-solving, and most can successfully complete a VSM or A3 report with reasonably low coaching time. Community Medical Center has over 150 people who have taken this course, at IHC the number is close to 300 at this time.
Approach used at IHC
The medical director of the MedSurg ICU and the nurse manager of the Respiratory Intensive Care Unit initiated a pilot project at IHC to apply TPS locally. Over many years IHC had developed a culture of front line empowerment in the Shock Trauma ICU through pioneering work in protocol development and quality improvement. Jimmerson introduced the tools and principles through the training course developed at Community Medical Center.
Several adjustments were made in transferring the course to the new environment. First, to ensure sufficient coaching support, participants met with Jimmerson one-on-one between sessions. Second, rather than allowing participants to register for the training course on an ad hoc basis, 16 participants per course offering were carefully selected in areas of related units. The initial 10-week (3 additional weeks were used to continue on-site work with the participants, train coaches and instructors who co-taught the next course with Jimmerson) session focused on four intensive medicine units: the shock/trauma intensive care unit, a medical ICU, a general medical/surgical unit and the emergency department. We included a minimum of four people from each unit, including the manager and at least two frontline staff. We attempted to include at least one person on each unit with time out of direct patient care who could become on-the-unit coaches. This allowed the staff to continue their work while the coach initiated the
observation and problem analysis necessary to redesign problematic work. A third change was to be more proactive in soliciting physician involvement.
From February to December, 2003, a total of 90 clinical staff, managers, physicians and management engineers and 48 members of the IT department had finished the training in 9 course offerings. Staff from laboratory, dietary support services and pharmacy staff also became involved, broadening the scope well beyond the initial four units.
Results
The preliminary results to date at IHC are promising. Course participants addressed real work issues and made many improvements that ranged from simple changes implemented immediately (e.g., heart monitor paper not available when a patient presented with a dysrythmia), to larger projects involving patient or information flow issues across multiple departments. Initial improvement efforts were completed during the 7-week classes, while some continued beyond the end the course. Table 1 lists a few representative examples.
Most of the improvements required little or no investment to implement and reduced significant amounts of wasted time for front-line workers. The improvements that did require a purchase were justified by the salaries of worker time saved. Reduction of overtime hours resulted in real dollar savings immediately, while reductions in wasted staff time not affecting overtime realized immediate gains in error reduction and employee, patient and physician satisfaction. Eventually, all reductions in waste can be expected to add to the bottom line. According to the Murphy Leadership Institute, a 10% reduction in waste can be expected to increase operating margin by 2.5% (Murphy, 2003).
Problem Identified Improvement Made Savings/benefit New medication orders written
during rounds arrived late (sometimes as much as 4 hours).
Enter new medication orders during rounds with a wireless laptop
Reduced time to treatment from 4 hours to 12 minutes
Reduced IV backlog in pharmacy Reduced number of steps in getting order to pharmacy
Lab ordered for short stay surgery patients not completed before the patient was taken to the operative suite.
Change patient flow for to obtain
specimen before prep Prevent delayed results Prevent cancelled surgery after
patient is prepped for surgery (not common, but a serious patient and physician satisfaction issue). Nurses sharing one glucometer
on an ICU where most patients were on an intensive insulin protocol. Resulted in delays, interruptions, some unlabeled specimens.
Install glucometers in each room
in ICU check from 17 to 4 minutes. Reduce time to do glucose Improve ability to consistently implement the protocol.
No unlabeled specimens at risk of erroneous identification
Fewer RN interruptions and frustration
Unit Clerk interrupted while
taking off new MD orders. Create quiet area for taking off MD orders during busiest hours average 43 minutes to 10 minutes) Decrease in treatment delays (from New orders frequently missed
and documentation incomplete in the ED due to misplaced charts.
Improve chart flow process with
clear signals for each station rate (60% increase in completed charts Improvement in completed chart Decreased time and frustration looking for charts
Improved accuracy and time to billing
Paper checks being
processed/mailed each week. This work had been languishing for several months
Implement electronic payment
for large vendor accounts negotiating discount for electronic Save $849,000/ year by payment with one large vendor
Save $125,000/year postage TABLE 1: EXAMPLE PROCESS IMPROVEMENTS AT IHC
Case Study
To illustrate application of the above principles, we describe a case study in the anatomical pathology lab to reduce the turnaround time of pathologist reports. Anatomical pathologists’ reports often took up to five days to reach the treating physician instead of the desired two days. Prior attempts to improve turnaround time yielded no improvement and
sometimes made things worse. In addition, specimen volume increased by 40% due to recent marketing efforts and centralization efforts at LDS Hospital, which strained capacity and compounded the problem.
First, a team comprised of technicians and pathologists—the people closest to the work— was assembled to address the problem. The team developed a value stream map of the entire workflow, from receiving the specimens to delivering the pathology report to the referring physicians, by direct observation. The VSM showed that several areas of delay, inconsistent work processes, and labeling errors seem to be occurring in the grossing room and created most of the delay in turnaround time. A goal of a two-day turnaround was established.
The team then studied particular problem areas highlighted in the VSM using the A3 problem-solving approach. One of the first steps was to study the current workflow in detail. The current condition diagram developed from observing the workflow is depicted in Figure 3.
The diagram revealed a complex flow (or pathway) with numerous opportunities for significant delays. The root cause analysis identified four specific problems, which were addressed with specific countermeasures, as described below:
• The flow of paperwork through the process did not align with the flow of the specimens, causing 3 to 4 hours per day of waste as transcriptionists manually matched paperwork to specimens. The countermeasure involved a relatively simple software fix that cued and printed the paperwork in the same order as the specimen flow.
• Two scheduling incongruities created interruptions to the flow. For one, the grossing room operated from 7:00am to 6:00pm, but many specimens were delivered at 6:00 pm so were not processed until the next day. Also, histology embedding did not begin until 5:00am, slides could get to the pathologists at 10:00am at the earliest. The countermeasures were to expand hours of operation. The grossing room expanded operations to 10:00pm enabling an additional run per day, and histology embedding started up at 3:00am. These decisions were made by the technicians who do the work once they realized the improvements that would result, and eliminated the need for physical capacity expansion.
• Transcription reports to the pathologists previously had a four to five hour
turnaround, directly contributing to the delay in the final reports. The transcriptionists were moved out of the work area to eliminate interruptions and clutter, reducing the turnaround of reports to one hour.
• Work processes throughout were inconsistent, leading to labeling errors and further delay. The countermeasure was to clearly specify the steps in the process in
accordance with the design principle above. Labeling errors decreased from an average of three per month for the prior twelve months, to one error in the first two and one half months of the new process, improving throughput.
Although this particular problem had been tackled numerous times without success prior to this effort, by following the TPS principles and the rigorous problem-solving tools, the two-day turnaround goal was achieved in two short months. People close to the work studied the problem using direct observation. They used diagrams to develop a shared understanding of the system as a whole, and to communicate improvement ideas. They addressed root causes of problem symptoms by applying simple rules for process design. At every step, the people who do the work were involved in making the improvements. For the first time, they were able to understand their role in the overall workflow, and the impact of their work on the outcome. Figure 4 shows the target condition for the revamped grossing room flow, which will now become the new current state for the next round of improvements.
FIGURE 4: FUTURE STATE DIAGRAM FOR PATHOLOGY SPECIMENS-GROSSING ROOM
Discussion
Three key factors seem to contribute to the success of TPS implementation thus far. First, participants learned to look at their work with a fresh view and to see waste in daily work activities. After working with unnecessarily complicated systems fraught with workarounds and rework, staff for the first time began to see the waste they lived with every day and had
previously assumed was part of their job. They also put a dollar value on their wasted time and began to realize the fiscal significance of addressing small problems.
A second success factor was the enthusiasm of the front line staff for making
improvement. Because work redesign is done as close in time and person as possible, the real-time involvement of staff who identify problems, and their input into the current condition and ideas for a better way to work, motivated the staff beyond our initial anticipation. Employees
tend to resist imposed change. But we found most employees are eager to make change that will improve their own work and efficiency when they are part of a redesign process that is consistent and reliable.
Thirdly, the A3 problem solving method facilitates objective communication about interdepartmental issues. Use of a common template communicated the issue clearly, succinctly and objectively. Several heated, polarized issues became neutralized and focused on what was right for patients and customers through the use of the A3 template. Participants reported that use of the tools accelerated issues already in process (but previously languishing in lengthy, time-consuming meetings), facilitated communication and buy-in across departments.
Based on this initial experience, it seems that different hospital units may require different approaches to implementation. The laboratory, pharmacy and IT had the easiest time making change, engaging staff who had not yet taken a class, and eliminating waste. Staff in these departments are already process-focused and were better able to allocate time to process improvement than the direct patient care areas. Nursing units, in contrast, experienced greater difficulty working without a dedicated resource (a “coach”) to respond to problems that arise and to coordinate the problem resolution. Clinical educators functioned on our trial units as coaches, and they seem to be a natural fit for the coaching role, but they struggled to add the new
activities to a full workload.
Finally, senior leadership plays a critical role. Many of the inefficient processes that we identified were actually created by high-level decisions made without a good understanding of the impact on work processes and use of staff time. Ideally, senior leaders would know and understand this problem solving method and give units the responsibility and resources to self-manage toward ideal. Although at IHC we started with a bottom-up strategy to demonstrate
effectiveness in small areas at the frontline, without the drive from the top there has been insecurity at the worker level that this may be another “flavor-of-the month” effort. Growing involvement of leadership (administrative and physician) is key for securing sustainability and success.
Conclusions and Next Steps
We found that the principles and tools from Toyota are applicable to not only health care processes, but to an endless variety of processes and work settings, ranging from medical
informatics to plant maintenance. We have discovered ample opportunity to improve efficiency and quality in health care by eliminating waste. We have found front line staff inherently motivated to make improvements when they were actively involved in improving their work systems. In short, TPS represents a valuable approach to addressing critical challenges we face in health care, including medical errors, escalating costs, and staffing shortages.
IHC has initiated its learning about TPS through the pilot phase just described. Following the initial series of classes, TPS has been incorporated into the leadership
development classes for managers organization-wide. In addition, another ICU has begun the training and has completed the first series of classes. The corporate Information Systems department has embraced it and has now trained 144 managers and staff.
In attempting to grow TPS throughout IHC, we are following a Toyota principle of creating “pull” – interest created based on reports by those using the approach. As managers learn the principles and tools, and see results, they are challenged to fully deploy TPS on their units even without more organizational support. The work so far has been done without any additional resource; however, a key next step will be to fully implement TPS in one department
for a sustained period of time, with a minimum of ½ dedicated FTE for coaching. We are in the process of examining several units for this purpose and plan to have this next phase operational by September, 2004.
We hope that continued adoption and application of the tools will lead to TPS becoming a standard way of solving problems, with all staff becoming skilled at identifying waste and making improvements. Once this happens, a cultural change will be underway that will need to include greater leadership focus on understanding work processes and increased support for front-line staff to make improvements.
Acknowledgements:
Funding for this work was provided in part by the National Science Foundation, award # SES-0115352, in partnership with Community Medical Center of Missoula, MT.
References
1. Murphy M.: Eliminating Wasteful Work in Hospitals Improves Margin, Quality and Culture. Murphy Leadership Institute Research Briefing: 4, 2003.
2. Womack J., Jones D.T., Roos D.: The Machine that Changed the World: The Story of Lean Production, HarperPerennial, New York, 1990.
3. Sobek D.K., Jimmerson, C: Applying the Toyota Production System to a Hospital Pharmacy, Proceedings of the Industrial Engineering Research Conference, Portland, OR, 2003. 4. Sobek D.K., Jimmerson, C.: A3 Reports: Tool for Process Improvement, Proceedings of the
Industrial Engineering Research Conference, Houston, TX, 2004.
5. Liker J.K. (ed.): Becoming Lean: Inside Stories of U.S. Manufacturers, Productivity Press, Portland, OR, 1998.
6. Womack, J.P., Jones D.T.: Lean Thinking, Simon & Schuster, New York, 1996.
7. Cusumano, M.A.: The Japanese Automobile Industry: Technology and Management at Nissan and Toyota, Harvard University Press, Cambridge, MA, 1985.
8. Tidd J., Fujimoto T.: Work Organization, Production Technology, and Product Strategy of the Japanese and British Automobile Industries, Current Policies and Economics of Japan, 4(4): 241-180, 1995.
9. Bremner B., Dawson C.: Can Anything Stop Toyota? Business Week 117, Nov. 17, 2003. 10. Tierney C.: Toyota Climbs to No. 2, The Detroit News, Friday, Jan. 23, 2004.
11. Monden Y.: The Toyota Production System, Institute of Industrial Engineers, Atlanta, 1993. 12. Ohno T.: The Toyota Production System: Beyond Large-Scale Production, Productivity
Press, Portland, OR, 1988.
13. Shingo S.: A Study of the Toyota Production System from an Industrial Engineering Viewpoint, Productivity Press, Portland, OR, 1989.
14. Adler, P.S.: Time-and-Motion Regained, Harvard Business Review, 71: 97-103, Jan-Feb., 1993.
15. Toyota Motor Corporation: The Toyota Production System, Operations Management Consulting Division and International Public Affairs Division, Toyota Motor Corporation, Toyota City, Japan, 1995.
16. Spear S., Bowen H.K., Decoding the DNA of the Toyota Production System, Harvard Business Review: 77: 97-106, Sept.-Oct., 1999.
17. Sobek D.K., Liker J.K., Ward A.C.: Another Look at How Toyota Integrates Product Development, Harvard Business Review, 76: 36-49, July-Aug, 1998.
18. Spear S.J., Learning to Lead at Toyota, Harvard Business Review, 82: 78-86, May, 2004. 19. Rother M., Shook J.: Learning to See, The Lean Enterprise Institute, Inc., Brookline, MA,
1998.
20. Jimmerson, C.: The REVIEW Workbook, Applying the Principles of the Toyota Production System to Healthcare, New Rider Productions, Bozeman, MT, 2003.