OTS Road Collision Research
Injuries Sustained by Motorcyclists
Project Ref: PPRO 4 / 012 / 032
LU Ref: J10301 / 002
Prepared on behalf of the
Department for Transport and Highways Agency
Prepared by
Richard Frampton
James Lenard
Rachel Grant
Vehicle Safety Research Centre
Loughborough University
Please note: the VSRC is changing name to become the Transport Safety Research Centre (TSRC) to reflect the broad range of research conducted.
Disclaimer
Although this report was commissioned by the Department for Transport (DfT), the findings and recommendations are those of the authors and do not necessarily represent the views of the DfT. While the DfT has made every effort to ensure the information in this document is accurate, DfT does not guarantee the accuracy, completeness or usefulness of that
information; and it cannot accept liability for any loss or damages of any kind resulting from reliance on the information or guidance this document contains.
EXECUTIVE SUMMARY
The OTS database was interrogated to facilitate a first look at the types of injury sustained by UK powered two wheeler (PTW) riders and the use of personal protective equipment and its effectiveness. The two study areas of OTS were selected to represent the injury severity and road user distributions of national police reported accidents.
Of PTW crashes in the study sample 68% occurred in a 30 and 40mph zone. Most crashes occurred while the PTW was travelling along a straight road and impacted a car. Most riders were male but Mopeds showed the highest proportion of female riders (19%). Mopeds were also ridden by the youngest riders (57% under 20 years old). Road bikes were ridden by the oldest riders (47% were 40+ years old).
Road bikes accounted for the largest proportion of injured riders (40%) and those riders seriously injured to the MAIS 3+ level (51%). Compared to the fatality rate of 6% for the whole OTS PTW sample, Road and Sport bikes showed the highest fatality rates of 9% and 8% respectively. Road bikes accounted for 55% of rider fatalities and 40% of all bikes. Sports bikes accounted for 35% of rider fatalities and 30% of all bikes. Thus the fatality rate in respect of exposure was much less for Sports bikes. Mopeds formed 15% of the OTS sample with 0% fatality rate while Large scooters were 9% of the sample with a 2% fatality rate.
In PTW crashes, the head and chest were the body regions most at risk of serious injury while the neck, abdomen and pelvis were rarely seriously injured. The arms and legs sustained the highest proportion of slight injuries but 17% of riders sustained AIS 2+ arm injury (mainly fractures) compared to 14% who sustained AIS 2+ leg injury (mainly fractures). The feet were at low risk of sustaining fractures (2% of riders).
The majority of significant head injuries (AIS 2+ and AIS 3+) were sustained by Road bike riders, followed by Sport bike riders. Serious head injuries for Moped riders were rare. Road bike riders sustained the most AIS 2+ and 3+ chest injuries whereas no Moped or Large scooter riders sustained chest injuries at those levels. Arm fractures were sustained by roughly equal numbers of Road and Sport bike riders but again, very few by Moped and Large Scooter riders. The majority of leg fractures were sustained by Road bike riders although 15% of leg fractures were accounted for by those riding Mopeds. Foot fracture was again mostly accounted for by Road bike riders (57%). About a third of foot fractures
occurred to Sport bike riders with Moped riders sustaining 14% of those injuries. Safety helmets were almost universally used but only around a half of all riders wore protective motorcycle clothing. Most Moped riders wore no protective clothing whatsoever. The use or non-use of protective clothing showed no major effect on the distribution of injury severity in this study sample. To clarify this further, It is recommended that a future study be carried out with non-injured riders because when protection works to the extent that no injury
TABLE OF CONTENTS
Executive Summary ... ii
1.
Background ... 6
1.1.
Rationale for the Study ... 6
1.2.
Key Research Questions ... 7
1.3.
Methodology ... 8
1.4.
Literature Review ... 8
2.
Analysis ... 11
2.1.
Powered Two Wheeler Types ... 11
2.2.
Crash Characteristics ... 12
2.3.
Rider Characteristics ... 15
2.4.
Use of Personal Protective Equipment. ... 16
2.5.
Injuries ... 19
2.6.
Performance of Personal Protective Equipment ... 24
2.7.
Injury Causation ... 26
3.
Conclusions ... 28
4.
Recommendations ... 30
5.
References ... 31
6.
Appendix A ... 33
7.
Appendix B ... 34
8.
Appendix C ... 35
1. BACKGROUND
1.1. Rationale for the Study
Motorcyclists are “vulnerable road users”. Unlike the occupants of cars, this road user group has little or no passive vehicle crash protection in the form of crumple zones, safety cages and restraint systems so their injury outcome from crashes is often more severe.
Motorcyclists for example are 57 times more likely to be killed or seriously injured per kilometre driven compared to a car occupant (The Department for Transport, 2009). Given the difficulty in providing passive protection for motorcyclists, crash prevention is often assumed to be the most effective way to reduce their risk of injury. There are, however, many challenges in providing active safety for motorcyclists. Transferring car technology, such as automatic braking and stability control is challenging because too much intervention could result in a two wheeled vehicle falling over. The EU PISa project (2010) for example was only able to instigate an automatic braking system that reduced crash severity rather than completely preventing a crash.
Use of motorcycles is increasing due to rising fuel costs, traffic density and environmental factors and it is timely to re-visit the potential of passive protection for motorcyclists. In terms of passive rider protection, helmet use has been obligatory in the UK since 1973. On the other hand, the use of any other personal protective equipment is left to the rider’s discretion. Currently, motorcycle mounted airbags, suit mounted airbags, armoured clothing and neck protection devices are available, but are they well utilised and what injuries could they address?
Research outlining motorcyclist injury patterns was reported by the European Experimental Vehicles Committee in 1993 and additional research looking at the use of passive protective equipment for motorcyclists was carried out more recently (APROSYS SP4, 2004, ACEM [MAIDS], 2004) but none of these utilised UK data. The UK On-the-Spot Study (OTS), reported by Hill and Cuerden, 2005, records detailed information on motorcycle crashes and gives us the opportunity to chart the types of injuries sustained by motorcyclists in the UK, the causes of injuries and the types of crashes where they occur. The two areas chosen for the OTS study were selected to ensure that, when the data from both areas was combined, the injury severity distribution of road accidents was representative of the severity of
accidents occurring nationally and also that the sample was representative of the different road user types. Analysis of this study could allow us to develop a view on what personal protective equipment is most effective and whether requirements for its use need to be developed.
UK law specifies the use of protective helmets for motorcyclists and these devices are required to meet minimum performance standards (BS6658, ECE22.05). The effectiveness of helmets in reducing head injury has been well proven (Ankarth et al, 2002). By contrast,
Currently, a plethora of passive protection devices exist on the market. Protective boots, suits and gloves abound. High end motorcycle boots usually contain crush resistant soles and ankle protectors but cheaper versions do not. A similar situation exists with gloves, some contain knuckle armour while others are designed merely to resist abrasion. A number of European standards exist for impact protection in rider clothing.
EN 1621-1:1997 – Impact protectors worn over rider’s elbows, hips, knees and shoulders EN 1621-2:2003 – Impact protectors worn over the rider’s back
EN 13595:2002 – Jackets, trousers plus one-piece and two-piece suits EN 13634:2002 – Motorcyclists’ footwear *
EN 13594:2002 – Motorcyclists’ gloves
Dedicated shoulder, elbow, hip, knee and leg armour in motorcycle trousers and jackets often conform to European standards. However, non armoured garments are rising in popularity, being more comfortable and generally more stylish. An example being Kevlar lined jeans and jackets from such companies as Draggin Jeans and Red Route. It should be noted that many of these garments can be fitted with armour if required. Traditional leather is also still popular, often without armour, but there is still debate as to whether a leather suit provides better protection against abrasion injuries compared to modern fabric suits.
Strap on protection is also now available. Back and chest protection from companies such as Knox and Forcefield are available and neck protection devices developed in MotoGP are available from BMW Motorrad. Passive car technology has also now reached the motorcycle world. Dainese markets an airbag system built into a motorcycle suit while Honda (Honda, 2006) have a bike mounted airbag system designed to keep the rider on the bike during a head on collision.
Questions exist concerning how much protection this equipment offers and against which types of injury? How many riders in the real world use this equipment and what equipment do they use? Many of the products are pricey and fall outside of the range of some riders. This may be an issue particularly with younger riders of smaller capacity machines and those who have taken to riding bikes through economic necessity. Knowing more about motorcyclist’s injuries and the clothing worn (or not worn) could give insight into what, if anything needs to be done to encourage the use of passive safety protection and what kind of return might be possible in terms of injury reduction.
1.2. Key Research Questions
1. What is the level of use of personal protective equipment - overall and by motorcycle type, rider type?
2. What are the injuries sustained by motorcyclists?
3. What is the effectiveness of personal protective equipment?
4. Is there a need to educate riders in the benefits of personal protective equipment, if so, which riders?
1.3. Methodology
The main data source for this study was the UK OTS database. The database at the point of these analyses (23.03.10) contained 8467 vehicles of which 461 (5%) were classed as powered two wheelers (PTW’s). These PTW’s were ridden by 491 motorcyclists, therefore there were 30 pillion passengers. The 491 motorcyclists sustained between them 1943 injuries of which 571 were at AIS 2+. Numerical analysis of the OTS data were carried out to show the injury patterns of motorcycle casualties in the UK, focusing on injury type, severity, frequency and causation.
Additionally, the crash circumstances related to injuries were explored to determine any relationships between injury outcome, injury causation and crash configuration. The use and effectiveness of personal protective equipment was also evaluated. The relationship between rider age and/or type of machine and utilisation of personal protective equipment was also examined.
1.4. Literature Review
Crash Helmets - The effectiveness of motorcycle safety helmets in reducing head injury has been well proven. For example Huang & Preston, 2004 showed that helmets reduce the likelihood of death by 29% for all motorcycle crashes. A U.S. study by Coben et al (2007) compared motorcycle-related hospitalisations across states with differing helmet laws. It found that motorcyclists in states without universal helmet laws are more likely to die during hospitalisation, sustain severe traumatic brain injury and be discharged to long-term care facilities. A study by Bachulis et al (reported by Runge, 1997) found that unhelmeted riders were 10 times more likely to require craniotomy (surgical incision through the skull) than their helmeted counterparts. The European MAIDS study (ACEM 2004) found that over 90% of PTW’s riders wore helmets but that many severe and fatal injuries are to the head. The COST327 programme stated that head injuries still cause some three-quarters of all fatalities to motorcyclists within Europe, while about one quarter of all injured riders suffer a head injury (Chinn et al 2001). The MAIDS study showed that approximately 10% of crash helmets came off during the accident due to improper fastening or damage during the accident and international studies show that crash helmet use compliance is lowest in southern European countries (Stefan et al 2003). Further research into helmet design is ongoing e.g. Research by Shuaeib et al (2007) into the use of expanded polypropylene (EPP) in achieving multi-impact protection performance as well as improved ventilation.
Cervical Spine Brace - This is designed to reduce injury risk to the cervical spine, spinal cord and collar bone resulting from hyperflexion, hyperextension and lateral hyperflexion (overflexion of the head when forced forwards, rearwards and sideways) and also compression of the spinal column due to the effect of force on the helmet. BMW in
reduces the risk of wounds becoming contaminated. A decrease in the severity of sprains and fractures is obtained with the use of protectors (APROSYS D414, 2006). However, A report by the European Experimental Vehicles Committee in 1993 (de Rome and Stanford undated) concluded that protective clothing is less effective in reducing injuries associated with severe bending, crushing and torsional forces to the lower limbs and massive
penetrating injuries to any part of the body. Otte et al (2002) in de Rome and Stanford (undated) found that the same level of injury was incurred at lower speeds for non-use of protective clothing than those who did use such clothing (80% at <50km/h without protective clothing compared to 80% at <60km/h with protective clothing). This is reflected in leg injuries e.g. 40% versus 29% injury free between 31-50km/h and it was found that high boots offer significant injury protection.
Motorcycle Airbags - The role of motorcycle airbags is to reduce rider injury in frontal collisions by controlling the rider’s trajectory and reducing velocity (Finnis, 1990 in Elliott et al, 2003). The APROSYS literature review stated that airbags may be very beneficial in motorcycle accidents providing they arrest rider motion. Tests in the early 1990s showed that full restraint was not possible above a speed of 30 mph, though reducing the rider’s velocity and controlling his trajectory could still be beneficial (Elliott et al 2003). Honda has
implemented a motorcycle airbag system constituted by four crash sensors mounted on the front fork legs, an electronic control unit (ECU) and the airbag module for its top class touring motorcycle, the Gold Wing. The ECU analyses the signals from the crash sensors to
determine whether or not to inflate the airbag. The Honda airbag in horizontal section has a V shape in order to protect the rider even if he is not perfectly aligned with the motorcycle. The Honda airbag is principally designed to mitigate the consequences for the rider when the motorcycle hits the side of a car. In this kind of collision the airbag deploys like a car airbag, except that there is not a restraining system, like a seatbelt, for the rider. For this reason the Honda airbag is much larger than a normal car airbag. Honda investigation of 9 crashes with their airbags found that: the airbag was beneficial in four cases, harmful in two cases and had little or no effect in three cases. The main benefits and risks presented by the system were to the head and neck. In both cases the benefits were shown to outweigh the risks, although by a reduced margin for the neck injuries. However, due to stiffer flexion and extension of the Hybrid III MATD dummy, the benefits may be underestimated. When the injury cost model was applied, it again showed that injury benefits outweighed the risks (Elliott et al 2003)
In the mid-1990s, research was undertaken by the Transport Research Laboratory (TRL) in the UK into the development and testing of a purpose built motorcycle airbag restraint system whose objective was to protect the rider in head-on impacts of the motorcycle into stationary and moving vehicles. The system was evaluated for a standard motorcycle with a single 50th percentile rider in the normal seating position travelling at 48km/h head on into the side of a stationary vehicle. Based on the full-scale impact test results analysed to date, the dummy was successfully arrested by the airbag with a reduction in kinetic energy of between 79% and 100%. The neck results for the dummy were significantly less than the tolerance values, representing a major advance over previous research. Based on cost calculations defined in ISO DIS 13232 (Motorcycles – Test and Analysis procedures for Research Evaluation of Rider Crash Protective Devices Fitted to Motorcycles. Part 8, Documentation and Reports) as applied to the five pairs of ISO tests in the programme, it was shown that the airbag system reduced these costs by 80%.
Rider Airbags - A number of systems have been developed in which the airbag is applied to the rider’s clothing rather than the motorcycle. Dainese, a protective sports clothing maker in Vicenza, Italy, employs an electronic computer, powered by a re-chargeable battery and mounted on the motorcycle. It monitors the bike’s physical motion and communicates by wireless radio transmission with a receiver in the D-Air vest processing data up to 3,000 times per second. If the computer senses pre-specified, pre-collision activities, such as a sudden deceleration force (about 10g), the D-Air vest is automatically remotely activated. Each of the three bladders can inflate in as little as 30 milliseconds and maintains the pressure for 20 seconds to assist in subsequent impacts. The Eggparka (shock-buffer protection jacket) is triggered when a release switch is activated through the separation of components brought about by the rider disengaging from the machine over a predetermined distance. This causes the small carbon dioxide (CO2) gas cylinder (which is hidden inside the jacket) to release gas into the inner liner of the jacket, inflating bladders around the neck, back and waist within 0.9 seconds, thus adding protection by acting as a "buffer" to absorb the shock of impact. A similar system is used by MotoAir, Taiwan, which uses a coiled cable connecting the rider airbag jacket to the bike. It takes in the order of 8-12kg (17-26lbs) of force on the cable to activate the airbag (so dismounting the bike while plugged in is unlikely to result in activation).
2. ANALYSIS
2.1. Powered Two Wheeler Types
The OTS data contained 461 powered two wheelers (PTW’s) of various types that had been involved in a crash. Table 1 shows the distribution of PTW type (type definitions are
described in Appendix A).
Table 1. PTW Type PTW Type N Percentage Roadster 122 26% Sports 138 30% Tourer 31 7% Cruiser/Chopper 12 3% Adventure 18 4% Moped 69 15% Scooter > 51 cc 44 9% Other 27 6% Total 461 100%
Roadsters, sports bikes and mopeds together formed the majority of the PTW’s (71%) while sports bikes formed the single largest group. The UK, in comparison to other motorised EU states has frequently shown a high proportion of sports motorcycles in the vehicle park and a lower proportion of lower powered scooters. Table 2 shows the distribution of PTW engine capacity in cubic centimetres. The distribution was calculated from cases where cubic cc was known.
Table 2. Distribution of Engine Sizes
Cubic Capacity of Engine (cc) All PTW’s (N=448)
<= 50 18% 51-125 20% 126-250 4% 251-500 6% 501-650 21% 651-1000 19% >1000 12% Total 100%
Larger capacity bikes above 500cc form the majority (52%) of the sample whilst the smaller capacity machines (up to 125cc) favoured by learner riders account for some 38%. Machines in the mid range between 125 and 500cc only account for 10% of the sample.
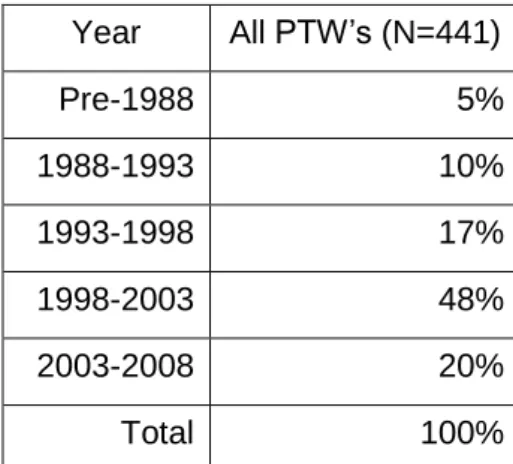
The distribution of PTW registration year is shown in table 3. The distribution was calculated from cases where registration year was known.
Table 3. PTW Registration Year Year All PTW’s (N=441) Pre-1988 5% 1988-1993 10% 1993-1998 17% 1998-2003 48% 2003-2008 20% Total 100%
By far the largest majority of motorcycles were registered between 1998-2003 (48%). The motorcycles most likely to be fitted with current safety technology, such as ABS, linked brakes and traction control would be found in the youngest group of machines, post 2003, which form 20% of the sample. It should be noted however, that currently in 2010, most new motorcycles still do not have these technologies fitted as standard.
2.2. Crash Characteristics
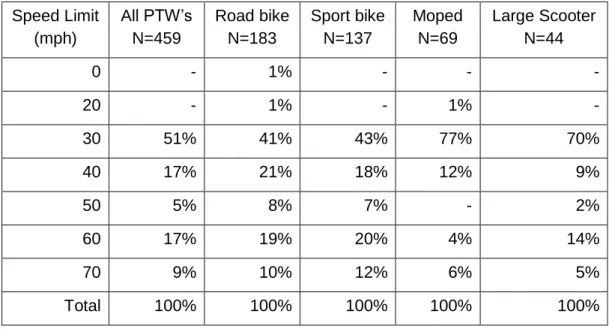
Previous motorcycle research has shown that different motorcycles are used in different ways by different riders and this has bearing on the likelihood of a crash as well as the type of crash (Christmas et al, 2009). For further analysis in this study, PTW’s were grouped into four main types which together account for 94% of PTW’s in the sample. The group classed as “Road bike” includes roadsters, tourers, cruisers, choppers and adventure bikes which are predominantly used on the road (such as the BMW R1200GS and Suzuki DL650 V-Strom). The second group of PTW’s classed as “Sport bike” includes machines based on race replicas. The third group classed as “Moped” includes traditional or scooter style machines with up to 50cc engine capacity. The fourth group “Large scooters” comprises a scooter style machine with engine capacity above 50cc. The new Road bike group accounted for 40% of all bikes, Sport bikes for 30%, Mopeds for 15% and Large scooters for 9%. Table 4 shows the road speed limit at the point of the crash in which these machines were involved. The distributions were calculated from cases where speed limit was known.
Table 4. Speed Limit at Point of Crash Speed Limit (mph) All PTW’s N=459 Road bike N=183 Sport bike N=137 Moped N=69 Large Scooter N=44 0 - 1% - - - 20 - 1% - 1% - 30 51% 41% 43% 77% 70% 40 17% 21% 18% 12% 9% 50 5% 8% 7% - 2% 60 17% 19% 20% 4% 14% 70 9% 10% 12% 6% 5% Total 100% 100% 100% 100% 100%
Most PTW crashes (68%) in the sample occurred in a 30 or 40 mph zone. While 26% occurred on derestricted A roads, dual carriageways and motorways. The proportions of Road bikes and Sport bikes which crashed on derestricted roads was similar (29% and 32%) however, very few Mopeds (12%) crashed on those types of road. 89% of Mopeds and 79% of Large scooters crashed in a 30 or 40mph zone.
Table 5 shows the first object interaction for each type of PTW. Data was available for all PTW’s in the sample.
Table 5. First Object Interaction First Object Interaction All PTW’s N=461 Road bike N=183 Sport bike N=138 Moped N=69 Large Scooter N=44 Car 62% 63% 57% 71% 64% Other vehicle with >3 wheels 7% 8% 7% 4% 9% Bicycle 1% 1% 1% - 2% Other PTW 2% 2% 1% 3% 2% pedestrian 1% 1% 2% - 2% roadside furniture 6% 4% 9% 3% 2% animal 1% 2% - - - barrier, ditch, kerb 3% 2% 6% 1% 2% Other 17% 17% 17% 17% 17% total 100% 100% 100% 100% 100%
All PTW’s, irrespective of type interacted predominantly with a car as the first struck object. Man made roadside objects were not a common source of first interaction, although Sports bikes interacted with these objects (15%) more often than other PTW types.
Table 6 summarises the pre impact movement for each type of PTW. Data was available for all PTW’s in the sample. For all PTW’s, by far the most common pre impact movement was driving along a straight road (47%). The second and third most common pre impact
movement for all PTW’s was overtaking a moving vehicle on the left (14%) and going round a right or left hand bend (13%). The fourth most common movement was going round a roundabout (6%). Given that the most common first object interaction is with another car (Table 5) this would suggest that the most common cause of crashes concerns either a car moving into or stopping in the path of the PTW. Looking at PTW’s by individual type showed a broadly similar pattern to that for all PTW’s. There were, however, some differences between PTW types. Mopeds were generally less likely to be involved in crashes on bends compared to other PTW types and they were more likely to be involved in crashes going along a straight road. Sport bikes were the most likely to be involved in a crash on a bend (17%).
Table 6. Most Common Pre Impact Movement by PTW Type Pre Impact Movement All PTW’s N=461 Road bike N=183 Sport bike N=138 Moped N=69 Large scooter N=44 Going along a straight road 47% 44% 47% 58% 43% Overtaking a moving vehicle on the left
14% 18% 14% 12% 9%
Going round a right or left hand bend
13% 13% 17% 7% 9% Going round a roundabout 6% 6% 4% 4% 16% Other movements 20% 19% 18% 19% 23% Total 100% 100% 100% 100% 100%
2.3. Rider Characteristics
The 461 PTW’s in this study carried 491 riders. Therefore 30 PTW’s (7%) carried a pillion rider. Table 7 shows the gender distribution of the riders. The distributions were calculated from cases where gender was known.
Table 7. Rider Gender Distribution Gender All PTW’s N=484 Road bike N=196 Sport bike N=143 Moped N=69 Large scooter N=47 Male 90% 88% 94% 81% 96% Female 10% 12% 6% 19% 4% Total 100% 100% 100% 100% 100%
The largest majority of riders by far were males with Sport bikes and Large scooters showing the highest proportion of male riders (94% and 96% respectively). Mopeds were ridden by the highest proportion of females (19%).
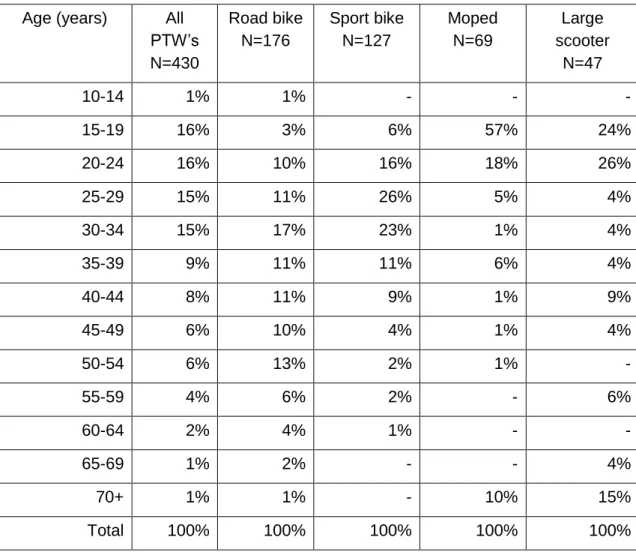
Table 8 shows the distribution of rider ages by PTW type. The distributions were calculated from cases where age was known.
Table 8. Rider Ages by PTW Type Age (years) All
PTW’s N=430 Road bike N=176 Sport bike N=127 Moped N=69 Large scooter N=47 10-14 1% 1% - - - 15-19 16% 3% 6% 57% 24% 20-24 16% 10% 16% 18% 26% 25-29 15% 11% 26% 5% 4% 30-34 15% 17% 23% 1% 4% 35-39 9% 11% 11% 6% 4% 40-44 8% 11% 9% 1% 9% 45-49 6% 10% 4% 1% 4% 50-54 6% 13% 2% 1% - 55-59 4% 6% 2% - 6% 60-64 2% 4% 1% - - 65-69 1% 2% - - 4% 70+ 1% 1% - 10% 15% Total 100% 100% 100% 100% 100%
Mopeds had by far the largest proportion of riders under 20 years old (57%) followed by large scooters (24%). Mopeds had the largest proportion of riders under 25 years old (75%)
followed by large scooters (50%). Road bikes had the largest proportion of riders over 40 years old (47%) followed by large scooters (38%). Sport bikes had the largest proportion of riders aged 20 to 39 (76%) followed by road bikes (49%) large scooters (38%) and then Mopeds (30%). It appears that Mopeds are ridden by younger riders whilst Roadsters and large scooters are ridden by older riders.
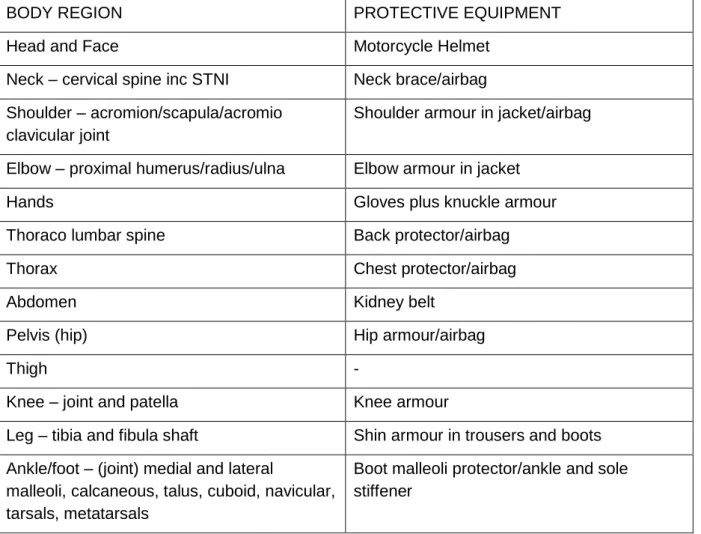
2.4. Use of Personal Protective Equipment.
Table 9 shows a summary of the personal protective equipment that is currently available and the body regions which are intended to be protected by each.
Table 9. Body Regions Protected by Personal Protective Equipment
BODY REGION PROTECTIVE EQUIPMENT
Head and Face Motorcycle Helmet
Neck – cervical spine inc STNI Neck brace/airbag Shoulder – acromion/scapula/acromio
clavicular joint
Shoulder armour in jacket/airbag
Elbow – proximal humerus/radius/ulna Elbow armour in jacket
Hands Gloves plus knuckle armour
Thoraco lumbar spine Back protector/airbag
Thorax Chest protector/airbag
Abdomen Kidney belt
Pelvis (hip) Hip armour/airbag
Thigh -
Knee – joint and patella Knee armour
Leg – tibia and fibula shaft Shin armour in trousers and boots Ankle/foot – (joint) medial and lateral
malleoli, calcaneous, talus, cuboid, navicular, tarsals, metatarsals
Boot malleoli protector/ankle and sole stiffener
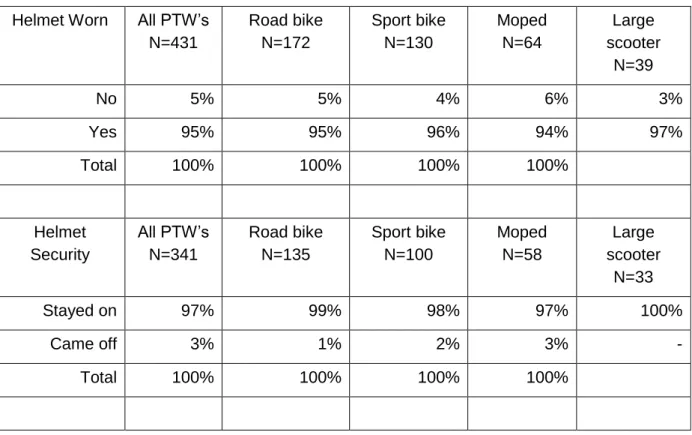
It should be noted that no PTW’s equipped with airbags were present in the data sample. In addition, most armour in dedicated motorcycle clothing is removable. The database did not contain details on whether armour was fitted to motorcycle clothing. There was, however, information on whether dedicated motorcycle protective equipment was in use at the time of the crash. Table 10 illustrates helmet use and security at the time of each PTW crash by type of PTW ridden. The distributions were calculated from cases where use and security was known.
Table 10. Helmet Use and Security Helmet Worn All PTW’s
N=431 Road bike N=172 Sport bike N=130 Moped N=64 Large scooter N=39 No 5% 5% 4% 6% 3% Yes 95% 95% 96% 94% 97% Total 100% 100% 100% 100% Helmet Security All PTW’s N=341 Road bike N=135 Sport bike N=100 Moped N=58 Large scooter N=33 Stayed on 97% 99% 98% 97% 100% Came off 3% 1% 2% 3% - Total 100% 100% 100% 100%
Use of an approved motorcycle helmet is a legal requirement in the UK and virtually all types of rider were wearing a helmet. The helmet stayed on the rider’s head in almost all cases. Apart from helmets, no other motorcycle protective equipment is mandatory in the UK. Nevertheless, dedicated motorcycle jackets, trousers, gloves and boots are readily available. In the case of jackets and trousers, these usually contain CE approved armour as illustrated in Table 9. Table 11 shows what, if any dedicated motorcycle clothing was employed by riders in this study. The distributions were calculated from cases where use or non use was known.
Table 11. Use of Dedicated Motorcycle Clothing Motorcycle Jacket Worn All PTW’s N=472 Road bike N=188 Sport bike N=139 Moped N=69 Large scooter N=45 No 58% 49% 42% 88% 87% Yes 42% 51% 58% 12% 13% Total 100% 100% 100% 100% 100% Motorcycle Gloves Worn All PTW’s N=483 Road bike N=194 Sport bike N=143 Moped N=69 Large scooter N=46 No 61% 55% 49% 86% 74% Yes 39% 45% 51% 14% 26% Total 100% 100% 100% 100% 100% Motorcycle Trousers Worn All PTW’s N=473 Road bike N=189 Sport bike N=140 Moped N=68 Large scooter N=45 No 70% 61% 60% 99% 89% Yes 30% 39% 40% 1% 11% Total 100% 100% 100% 100% 100% Motorcycle Boots Worn All PTW’s N=474 Road bike N=189 Sport bike N=141 Moped N=69 Large scooter N=45 No 68% 57% 55% 97% 96% Yes 32% 43% 45% 3% 4% Total 100% 100% 100% 100% 100%
It is clear that at least half the riders were not wearing dedicated motorcycle clothing but jackets and gloves were used slightly more often than trousers or boots. The highest rate of use of jackets and gloves were by Sports bike riders. By contrast, it is strikingly clear that very few Moped riders used any protective clothing whatsoever as is the case with Large scooter riders. It should be re-iterated here that Moped riders were by far the youngest riders
2.5. Injuries
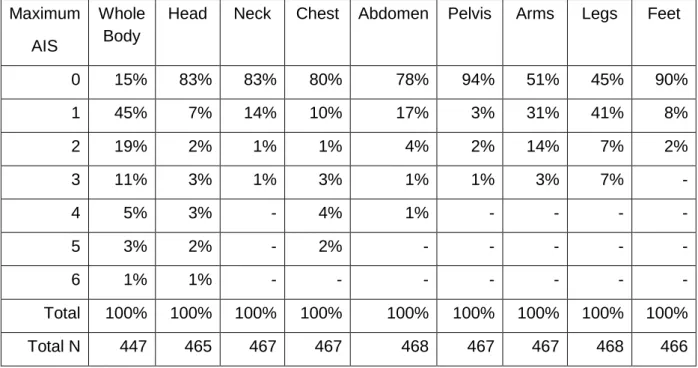
Table 12 shows the distribution of injury severity for all riders. It displays the data as the maximum injury severity for the whole body and then by individual body region. Injury severity in this study was classified according to the Abbreviated Injury Scale or AIS (AAAM 1990). This is an internationally recognised threat to life scale which assigns a severity score of 1 to 6 to an injury: 1 meaning very minor injury with no threat to life and 6 meaning a fatal injury (appendix B). In general, an AIS of 3 or more represents a serious threat to life. For arms and legs, an AIS of 2 or above usually indicates fracture. For some riders, maximum injury severity was unknown and the totals used to calculate percentages in Table 12 are based on known injury severity.
Table 12. Maximum AIS by Body Region Maximum
AIS
Whole Body
Head Neck Chest Abdomen Pelvis Arms Legs Feet
0 15% 83% 83% 80% 78% 94% 51% 45% 90% 1 45% 7% 14% 10% 17% 3% 31% 41% 8% 2 19% 2% 1% 1% 4% 2% 14% 7% 2% 3 11% 3% 1% 3% 1% 1% 3% 7% - 4 5% 3% - 4% 1% - - - - 5 3% 2% - 2% - - - - - 6 1% 1% - - - - Total 100% 100% 100% 100% 100% 100% 100% 100% 100% Total N 447 465 467 467 468 467 467 468 466
Table 12 demonstrates that 85% of riders in this sample were injured. 45% were injured at the AIS 1 level but 40% were injured at the more serious AIS 2+ level, with 20% being injured at AIS 3+. 6% of all riders were fatally injured.
The head and chest were the body regions most at risk of AIS 3+ injury (9% and 9% of riders respectively).
The neck was rarely injured seriously. 14% of riders sustained AIS 1 soft tissue neck injury, 1% sustained AIS 2+ and 1% AIS 3+ injury. The abdomen and pelvis rarely sustained life threatening injury, both body regions were injured to AIS 3+ in only 1% and 2% of riders respectively.
The arms and legs sustained the highest proportion of AIS 1 only injury (31% and 41% of riders respectively) and these were generally cuts, bruises and abrasions but 17% of riders sustained AIS 2+ arm injuries (94% of which were fractures) compared to 14% who
sustained AIS 2+ leg injuries (80% of which were fractures). The feet were at low risk of sustaining fractures (2% of riders).
AIS 2+ injuries are the injuries which are considered to be most important in terms of
impairment of function and threat to life. Appendix C displays the AIS 2+ injuries sustained by all PTW riders in this study. The most important within each body region, in terms of
frequency, are summarised below.
AIS 2+ Head Injuries (N=104) – subarachnoid haemorrhage (15%), Cranium fracture (22%), diffuse brain injury (11%), facial fracture (8%)
AIS 2+ Neck Injuries (N=22) – fracture of C7, bottom of cervical spine (40%)
AIS 2+ Chest Injuries (N=89) – lung contusion (20%), rib and sternum fractures (45%) AIS 2+ Abdominal Injuries (N=40) – rupture,/contusion,/laceration of liver (43%)
AIS 2+ Thoraco/Lumbar Spine Injuries (N=32) – fracture of T3, top of thoracic spine (59%) AIS 2+ Arm Injuries (N=126) – wrist fractures (34%), clavicle fractures (19%), finger fractures (13%), upper arm humerus fractures (11%), lower arm radius/ulna fractures (9%)
AIS 2+ Pelvic Injuries (N=13) – simple fracture of pubic symphysis (62%)
AIS 2+ Leg Injuries (N=137) – lower leg tibia/fibula fractures (34%), femur fractures (20%), ankle fractures (14%), knee fractures (12%)
AIS 2+ Foot Injuries (N=8) – toe fractures (63%)
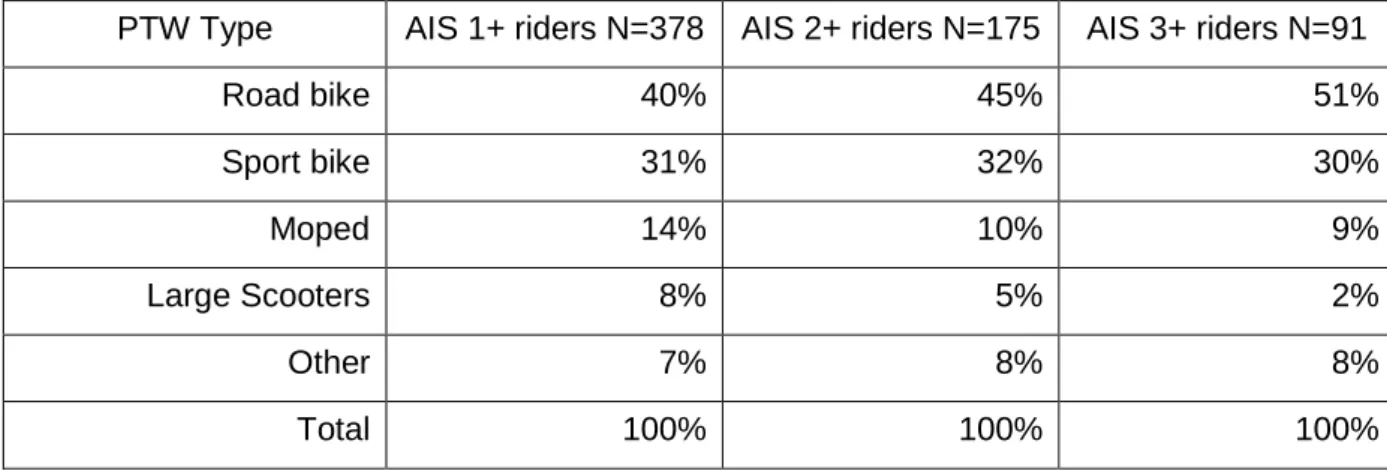
The accident data was interrogated to determine how whole body maximum injury severity was distributed between riders of different types of PTW. Table 13 shows the distribution of the Maximum Abbreviated Injury Score (MAIS) between riders of different machines. Distributions were calculated for riders with known injury severity.
Table 13. Distribution of Maximum Abbreviated Injury Score
PTW Type AIS 1+ riders N=378 AIS 2+ riders N=175 AIS 3+ riders N=91
Road bike 40% 45% 51% Sport bike 31% 32% 30% Moped 14% 10% 9% Large Scooters 8% 5% 2% Other 7% 8% 8% Total 100% 100% 100%
Table 14 shows the fatality rate for riders of different PTW types. Table 14. Fatality Rate for PTW’s Rider fatality All PTW’s N=491 Road bike N=199 Sport bike N=145
Moped N=69 Large Scooters N=47
Yes 6% 9% 8% - 2%
No 94% 91% 92% 100% 98%
Total 100% 100% 100% 100% 100%
Compared to the fatality rate of 6% for the whole sample, Road and Sport bikes showed fatality rates of 9% and 8% respectively, by contrast, the fatality rate for mopeds was 0%. Of all 491 PTW riders there were 31 fatalities. Road bikes accounted for (55%) of rider fatalities and 40% of all bikes. Sports bikes accounted for 35% of rider fatalities and 30% of all bikes. Thus the fatality rate in respect of exposure was much less for Sports bikes. The lowest risk exposure was for Mopeds which accounted for 25% of all bikes but with no fatalities. Tables 15 to 22 show the distributions of maximum body region injury severity between riders of different types of PTW. The distributions are based on riders where maximum injury severity was known.
Table 15. Distribution of Maximum AIS by Body Region – Head
PTW Type Head AIS 1+ (N=81) Head AIS 2+ (N=48) Head AIS 3+ (N=37)
Road bike 48% 48% 51% Sports bike 28% 35% 32% Moped 9% 2% 3% Large scooter 7% 6% 5% Other 8% 9% 9% Total 100% 100% 100%
Table 16. Distribution of Maximum AIS by Body Region – Neck
PTW Type Neck AIS 1+ (N=79) Neck AIS 2+ (N=12) Neck AIS 3+ (N=5)
Road bike 41% 67% 80% Sports bike 30% 25% - Moped 16% 8% 20% Large scooter 8% - - Other 5% - - Total 100% 100% 100%
Table 17. Distribution of Maximum AIS by Body Region – Chest
PTW Type Chest AIS 1+ (N=92) Chest AIS 2+ (N=46) Chest AIS 3+ (N=41)
Road bike 46% 57% 56% Sports bike 37% 41% 41% Moped 9% - - Large scooter 2% - - Other 6% 2% 3% Total 100% 100% 100%
Table 18. Distribution of Maximum AIS by Body Region – Arms
PTW Type Arms AIS 1+ (N=227) Arms AIS 2+ (N=82) Arms AIS 3+ (N=16)
Road bike 39% 35% 69% Sports bike 30% 32% 19% Moped 11% 7% 6% Large scooter 6% 1% - Other 14% 25% 6% Total 100% 100% 100%
Table 19. Distribution of Maximum AIS by Body Region – Abdomen PTW Type Abdomen AIS 1+
(N=105) Abdomen AIS 2+ (N=27) Abdomen AIS 3+ (N=10) Road bike 42% 56% 80% Sports bike 30% 30% 20% Moped 1% - - Large scooter 10% - - Other 17% 14% - Total 100% 100% 100%
Table 20. Distribution of Maximum AIS by Body Region – Pelvis
PTW Type Pelvis AIS 1+ (N=30) Pelvis AIS 2+ (N=14) Pelvis AIS 3+ (N=6)
Road bike 30% 36% 17% Sports bike 47% 50% 66% Moped 10% 7% 17% Large scooter 10% 7% - Other 3% - - Total 100% 100% 100%
Table 21. Distribution of Maximum AIS by Body Region – Legs
PTW Type Leg AIS 1+ (N=259) Leg AIS 2+ (N=66) Leg AIS 3+ (N=34)
Road bike 40% 42% 44% Sports bike 30% 27% 26% Moped 14% 15% 15% Large scooter 8% 3% 6% Other 8% 13% 9% Total 100% 100% 100%
Table 22. Distribution of Maximum AIS by Body Region – Foot
PTW Type Foot AIS 1+ (N=46) Foot AIS 2+ (N=7) Foot AIS 3+ (N=0)
Road bike 52% 57% - Sports bike 33% 29% - Moped 9% 14% - Large scooter 2% - - Other 4% - - Total 100% 100% -
The majority of serious head injuries (AIS 2+ and AIS 3+) were sustained by Road bike riders, followed by Sport bike riders. Serious head injuries for Moped riders were rare. Road bike riders accounted for the majority of AIS 2+ and 3+ neck injuries. Moped riders sustained around a fifth of the AIS 3+ neck injuries whereas Sports bike riders sustained no AIS 3+ neck injuries at all. It should be re-emphasized that serious neck injuries were rare overall.
Road bike riders sustained the most AIS 2+ and 3+ chest injuries followed by Sport bike riders, whereas no Moped or Large scooter riders sustained chest injuries at those levels. AIS 2+ arm fractures were sustained by roughly equal numbers of Road and Sport bike riders but again, very few by Moped riders.
The majority of serious abdominal injuries were sustained by Road bike riders and none by those on Mopeds and Large scooters.
Although pelvic fracture was rare, most were sustained by Sports bike riders followed by Road bike riders. Serious pelvic injuries for Moped riders were rare.
The majority of leg fractures were sustained by Road bike riders although about a fifth of these injuries were accounted for by those riding Mopeds.
Foot fracture was again mostly accounted for by Road bike riders (57%). About a third of foot fractures occurred to Sport bike riders with Moped riders sustaining 14% of those injuries.
2.6. Performance of Personal Protective Equipment
The protective properties of safety helmets have been well proven so it was decided to examine the performance of dedicated motorcycle jackets, trousers and boots. Since these are primarily designed to protect the upper and lower extremities (Table 9), rider injury rates for the arms, legs and feet were compared with and without the use of personal protective clothing. It should be noted that crashes where protective clothing works to the extent that no injury is sustained are generally not reported to the police and therefore will not be in this study sample of police reported incidents. So this analysis will not take into account the benefits of protective gear in such cases.
Nevertheless, within the confines of this sample, if protective clothing is effective in reducing injuries it would be expected that the injury severity distribution for riders with protective clothing would be different (less severe) than for those without. Table 23 shows the injury rates with and without protective clothing for all PTW riders where usage was known.
Maximum Arm AIS Without dedicated jacket N=262 With dedicated jacket N=186 0 55% 46% 1 31% 32% 2 11% 18% 3+ 3% 4% Total 100% 100%
Maximum Leg AIS Without dedicated trousers N=318 With dedicated trousers N=132
0 43% 46%
1 42% 39%
2 8% 5%
3+ 6% 10%
Total 100% 100%
Maximum Foot AIS Without dedicated boots N=307 With dedicated boots N=142
0 90% 90%
1 8% 9%
2 2% 1%
Total 100% 100%
The rate of AIS 1 surface injury was similar with and without protective clothing for the arms, legs and feet. The AIS 2 injury rate was actually somewhat higher for the arms when a dedicated jacket was worn. The rate of AIS 2 leg injury was lower when motorcycle trousers were used but the AIS 3+ rate was higher. There was no clear pattern in the distribution of injury severity for riders with and without protective clothing, however, certain confounding factors could have contributed to this result. For example, most moped riders wore no protective clothing but were generally involved in less severe crashes than other types of PTW. In that respect, the injury severity outcome for riders wearing no protective clothing could have been biased by the type of crash.
In order to control for these factors, the analysis was run a second time using only Road and Sport bike riders. The results are shown in Table 24, again calculated from cases where use of protective clothing was known.
Table 24. Rates of Injury with and without personal Protective Equipment – Road/Sports Bikes
Maximum Arm AIS Without dedicated jacket N=144
0 51% 44%
1 31% 33%
2 14% 19%
3+ 4% 4%
Total 100% 100%
Maximum Leg AIS % Without dedicated trousers N=190
% With dedicated trousers N=123 0 42% 48% 1 45% 37% 2 8% 6% 3+ 6% 10% Total 100% 100%
Maximum Foot AIS % Without dedicated boots N=177
% With dedicated boots N=136
0 86% 90%
1 11% 10%
2 3% 1%
Total 100% 100%
Again, there was no clear pattern in the distribution of severity of injuries sustained by those with and without dedicated clothing. The rate of arm fracture was actually higher when a dedicated jacket was worn. The rate of AIS 1 surface injury appeared a little lower for the legs when dedicated trousers were used, as did the AIS 2 rate but the AIS 3+ rate was higher. It should be noted that 52% of AIS 3+ leg injuries were femur fractures (Appendix C) which protective clothing would probably not prevent (Table 9). The foot fracture rate was a little lower where dedicated motorcycle boots had been used.
2.7. Injury Causation
Determining the causes of injury to motorcyclists is fraught with difficulty due to complex rider movement (kinematics) during a crash. The rider may remain on the PTW and receive
Because of the complexity involved in the causation of motorcyclists’ injuries, an accurate understanding of injury mechanisms and evaluation of protective measures for motorcyclists requires a case by case analysis of the in-depth data. An example of how this might be done is illustrated in the DfT report “Roadside Objects Struck by Powered Two Wheelers” PPRO 4/012/032 (LU Ref: J10301/005), 2010.
3. CONCLUSIONS
The OTS database was interrogated to facilitate a first look at the types of injuries sustained by UK motorcyclists and the use of personal protective equipment and its effectiveness. Preliminary analyses established the relationship between OTS Powered Two Wheeler (PTW) data and the UK national picture in terms of PTW types, crash circumstances and injury outcome.
UK national data shows that two thirds of all PTW accidents and three quarters of moped accidents occur in urban areas (Reported Road Casualties Great Britain, 2008). In the OTS sample, 68% of all PTW crashes occurred in a 30 or 40mph zone while 89% of Moped crashes occurred in a 30 or 40mph zone.
Mopeds were 11% of the national PTW fleet in 2008 and 15% of the OTS sample. Nationally, Moped riders make a relatively small contribution to PTW casualties - 4% of deaths, 11% of seriously injured and 18% of all PTW casualties. In the OTS sample, there were no fatalities on Mopeds and they accounted for 9% of seriously injured riders (AIS 3+ injuries) and 14% of all injured riders.
For all PTW’s, the most common pre impact movement was driving along a straight road and the most common first object interaction was with another car. This is in agreement with other studies using UK national data (Clarke et al, 2004) and suggests the most common cause of crashes concerns either a car moving into or stopping in the path of the PTW. The second and third most common pre impact movement for all PTW’s was overtaking a moving vehicle on the left and going round a right or left hand bend. However, Mopeds were less likely to be involved in crashes on bends than other PTW types. Man made roadside objects were not a common source of first interaction, although Sport bikes interacted with these more often than other PTW types. Sport bikes also showed the highest frequency of crashing while going around a bend.
The vast majority of motorcycle riders were male but Mopeds showed the highest proportion of female riders (19%). Mopeds had by far the largest proportion of younger riders, 57% were under 20 years old while Road bikes had the largest proportion of older riders, 47% were 40+ years old. Sport bikes had the largest proportion of riders aged 20 to 39 (76%). It appears that Mopeds are ridden by younger riders whilst Roadsters are ridden by older riders, perhaps coming back to biking after a lay-off.
Virtually all types of PTW rider wore a helmet and the helmet stayed on the rider’s head in almost all cases. It was clear however that at least half the riders were not wearing dedicated motorcycle clothing, although jackets and gloves were used slightly more often than trousers or boots. The highest rate of use of jackets and gloves were by Sports bike riders. In
of riders respectively). 17% of riders sustained AIS 2+ arm injury (mainly fractures) compared to 14% who sustained AIS 2+ leg injury (mainly fractures). The feet were at low risk of
sustaining fractures (2% of riders).
Road bikes accounted for the largest proportion of injured riders (40%) and those riders seriously injured to the MAIS 3+ level (51%). Compared to the fatality rate of 6% for the whole OTS PTW sample, Road and Sport bikes showed the highest fatality rates of 9% and 8% respectively. Road bikes accounted for 55% of rider fatalities and 40% of all bikes. Sports bikes accounted for 35% of rider fatalities and 30% of all bikes. Thus the fatality rate in respect of exposure was much less for Sports bikes. Mopeds formed 15% of the OTS sample with 0% fatality rate while Large scooters were 9% of the sample with a 2% fatality rate.
The majority of significant head injuries (AIS 2+ and AIS 3+) were sustained by Road bike riders, followed by Sport bike riders. Serious head injuries for Moped riders were rare. Road bike riders also accounted for the majority of AIS 2+ and 3+ neck injuries. Moped riders sustained around a fifth of the AIS 3+ neck injuries whereas Sport bike riders sustained no AIS 3+ neck injuries at all. It should be re-emphasized that serious neck injuries were rare overall. Road bike riders sustained the most AIS 2+ and 3+ chest injuries whereas no Moped or Large scooter riders sustained chest injuries at those levels. Arm fractures were sustained by roughly equal numbers of Road and Sport bike riders but again, very few by Moped and Large Scooter riders. The majority of serious abdominal injuries were sustained by Road bike riders but none by those on Mopeds or Large Scooters. Although pelvic fracture was rare, most were sustained by Sport bike riders. The majority of leg fractures were sustained by Road bike riders although 15% of leg fractures were accounted for by those riding Mopeds. Foot fracture was again mostly accounted for by Road bike riders (57%). About a third of foot fractures occurred to Sport bike riders with Moped riders sustaining 14% of those injuries. The data available to this study do not allow all of the factors relating to the effectiveness of protective clothing to be assessed. Any test of the effectiveness of an injury prevention measure should take into account that non-injury crashes (where injury prevention measures are successful) may not be reported to the police and therefore do not get into either the national statistics or in-depth studies. On the other hand, we may still gain some measure of the effectiveness of crash protection from in-depth samples by looking at the spread of injury severity with and without protection. In the OTS sample, Moped riders (the youngest riders in the sample) were most commonly involved in urban crashes and probably at low impact severities due to the speed restriction on their machines: the probable reason why most did not receive serious injuries despite their non-use of protective clothing.
There was no clear indication that the use of protective clothing had a major influence on injury severity distribution in this study sample, though other factors which may affect severity of injury (besides type of bike) were not controlled for, so these results should be treated with caution. Examining the injury rates by body region with and without protective clothing only for Road and Sport bikes showed that the proportion of riders sustaining a more serious arm injury did not differ to any large degree between those with and without a protective jacket. The rate of arm fracture was actually higher when a dedicated jacket was worn. The rate of AIS 1 surface injury appeared a little lower for the legs when dedicated trousers were used, as did the AIS 2 rate but the AIS 3+ rate was higher. Although 52% of AIS 3+ leg injuries were femur fractures which protective clothing would probably not have prevented. The foot fracture rate was a little lower where dedicated motorcycle boots had been used.
4. RECOMMENDATIONS
In order to further assess the benefits of protective clothing it is recommended that the issue of non-injury crashes be considered in more detail. This would allow examination of cases where protective equipment was successful and therefore excluded the rider from the sample or the national data since non-injury cases may not be reported to the police. Finding these types of crashes could be problematical however – perhaps insurance companies may be a possible source of that data.
There is still a need to determine why protective clothing did not appear to have a major effect on injury severity in this sample. One issue concerns the question of whether armour stayed in place during the crash or indeed whether it was fitted at all. This information would be important to collect in future studies.
It would appear that moped riders have a different attitude to the use of protective clothing compared to other PTW riders. An investigation into the reasons for this could be beneficial. We already know they are the youngest of all riders but perhaps the social and road
environments and cost constraints in which mopeds are operated are contributory factors. Further investigation of the types of rider kinematics related to particular injury mechanisms would be useful to determine future improvements to protective clothing and the possible protective potential of new airbag technologies. The complexity of motorcyclists’ injury mechanisms will likely require a case by case analysis of the in-depth data.
5. REFERENCES
The Abbreviated Injury Scale 1990 Revision. Association for the Advancement of Automotive Medicine, 1990.
ACEM. 2004. MAIDS - In-depth investigations of accidents involving two-wheelers - Final report 1.2. ACEM.
Ankareth, S. et al. 2002. Injury patterns associated with mortality following motorcycle crashes. Injury – International journal of the care of the injured. 33 473-477
APROSYS SP4. Motorcyclists: Accident national data. Deliverable AP-SP41-0001-C. European funded project TIP3-CT-2004-506503.
APROSYS SP4: Report on accidentology analyses for motorcycles/riders impacts against vehicles. State-of-the-art of motorcycle protective devices. Future research guidelines. Deliverable 4.1.2 AP-SP41-0002. European funded project TIP3-CT-2004-506503.
Chinn et al. 2001. COST 327 Motorcycle Safety Helmets - Final Report. European Commission.
Coben et al. 2007. Characteristics of motorcycle-related hospitalizations: Comparing states with different helmet laws. Accident Analysis and Prevention. Elsevier Ltd. 39 (1), 190.
Christmas, S., Young, D., Cookson, R and Cuerden, R. Passion, Performance, Practicality: Motorcyclist’s Motivations and Attitudes to Safety. TRL Research Report PPR442. Department for Transport, 29 October, 2009.
Clarke, D. D., Ward, P., Bartle, C., Truman, W. In-depth Study of Motorcycle Accidents. Department for Transport Road Safety Research Report No. 54. Department for Transport, London, November 2004.
De Rome & Stanford. Undated. Motorcycle protective clothing.
Elliott, M., Baughan, C., Broughton, C., Chinn, B., Grayson, G., Knowles, J., Smith, L. & Simpson, H. 2003. Motorcycle safety: A scoping study. TRL report 581. Department for Transport, UK.
Grant, R., Lenard, J., Frampton, R., Quigley. C. (2010). OTS Road Collision Research: Roadside Objects Struck by Powered two wheelers. Department for Transport (Project reference PPRO 4/012/032 LU Reference J10301/005).
Hill, J (VSRC) and Cuerden, R. (TRL). Development and Implementation of the UK On The Spot Accident Data Collection Study – Phase I. Department for Transport Road Safety Research Report No. 59. ISBN 1 904763 60X. November 2005.
HONDA. 2006. Honda Develops World’s First Production Motorcycle Airbag System.
http://world.honda.com/news/2005/2050908.html.
Huang, B. & Preston, J. 2004. A Literature Review on Motorcycle Collisions. Transport Studies Unit, Oxford University.
PISa (Powered two-wheeler Integrated) Project, 2006-2010. www.pisa-project.eu
Reported Road Casualties Great Britain: 2008. Annual Report. TSO (The Stationary Office). P.O. Box 29, Norwich NR3 1GN, UK.
Rogers, N, M. “Further Crash Tests of Motorcycle Leg Protectors as Proposed in the UK Draft Specification,”13th International Technical Conference on Experimental Safety Vehicles, Paris, November 1991.
Rogers, N, M., and Zellner, J, W. An Overall Evaluation of UKDS Motorcyclist Leg Protectors Based on ISO 13232. The 16th International Technical Conference on the Enhanced Safety of Vehicles (ESV) Proceedings - Windsor, Ontario, Canada, May 31- June 4, 1998
Runge, Jeffrey W. 1997. Commentary notes on McKnight and McKnight 1994. Annals of Emergency Medicine Volume. 29 (2), 283.
Shuaeib, F, M. et al. 2007. A new motorcycle helmet liner material: The finite element simulation and design of experiment optimisation. Materials and Design. Elsevier Ltd. 28 (1), 182.
6. APPENDIX A
Powered Two Wheeler - Type Definitions
Roadster – A machine with an upright seating position and no front fairing. Can be chain or shaft final drive with manual gearbox
Sports – A machine with a full fairing and semi prone riding position typical of the type of machines used in circuit racing. Final drive normally by chain with manual gearbox. Tourer – A machine with an upright seating position and full fairing. Typically large engine capacity. Manual gearbox and often with shaft final drive. Designed for long distance touring. Cruiser/Chopper – A machine with swept back handlebars, upright seating position and typically no fairing but with large windscreen. Can be chain or shaft drive with manual gearbox.
Adventure – A machine with upright seating position, no fairing or half fairing and high swept exhaust and high ground clearance.
Scooter – A machine with a full fairing, rear mounted engine and automatic gearbox. No foot control pedals or footrests.
Moped – A machine with engine capacity limited to 50cc and maximum forward speed of 45 km/h. May be of the scooter type or have traditional chain drive and manual gearbox.
7. APPENDIX B
Abbreviated Injury Scale
AIS Score Description Example of Injury
1 Minor Bruise or laceration
2 Moderate Fractured radius or Ulna
3 Serious Fractured femur
4 Severe Complex skull fracture
5 Critical (survival uncertain)
Perforation of major organ (e.g. liver)
8. APPENDIX C
AISCODE AIS F HEAD INJURY DESCRIPTION
110604 2 1 Lacerations to front of head 113000 6 1 Shattered skull
140204 5 2 Severe contusions to base of brain 140210 5 2 Haemorrhage around brain stem 140212 6 2 Tear of the medulla of the brain stem 140299 5 1 Injury to brain stem (NFS)
140454 3 1 Moderate oedema to brain & cerebellum 140499 3 1 Direct trauma to cerebellum
140602 3 3 Subarachniod frontal contusion 140604 3 1 Contusion on right temporal pole
140608 4 1 Large contusion frontal lobe to brain stem 140612 3 2 Small contusions in right frontal lobe 140620 3 2 Small contusions in right and left parietal 140628 5 1 Multiple perechial haemorrhage
140629 4 1 Midline haematoma
140642 4 2 Scattered tiny petechial haemorrhages 140652 4 1 Small subdural haematoma R cerebral cortex 140654 5 2 Small subdural haemorrhages right and left 140660 3 6 Brain swelling
140662 3 2 Mild general swelling to brain 140668 3 2 Diffuse oedema around brain stem 140678 4 3 Scanty intraventricular haemorrhage 140684 3 16 covering of subarachnoid haemorrhage 140688 4 4 Brain generally swollen with tears 150200 3 8 Hinge fracture through base of skull 150204 3 1 # R temporal bone, # skull base 150206 4 8 Skull # forming hinge # through base 150400 2 1 Minor #s of the occipital bone 150402 2 1 Linear skull # to vault
150404 3 2 Comminuted fracture involving orbital plate 150406 4 1 Compound comminuted # of skull
150408 4 1 Depressed and dislocated # of parietal 160202 2 3 Period of unconsciuosness< 1 hour 160214 5 1 Unconscious for 1 week
160410 2 6 Loss of memory 5 mins after accident 160899 3 1 Unconscious GCS3
210602 2 1 12 cm laceration anterior forehead 240402 2 1 L eye displaced
250608 2 1 # R condyle mandible
250800 2 2 Fracture of maxillary sinus (oblique) 251004 2 2 Multiple displaced nasal fractures 251200 2 2 Fracture through roof of right orbit 251800 2 1 Fracture to left zygoma
AISCODE AIS F NECK INJURY DESCRIPTION
320212 4 1 Transection of common carotid artery 320806 3 1 Transection of internal jugular vein 350200 2 1 Fracture of hyoid bone at it's greater horn 640272 6 1 # of the cervical spine between C1 &2 640276 6 1 # of C1 # skull -complete cord transection 650208 2 1 Disarticulation of atlanto-occipital joint 650209 2 1 C5/6 facet subluxation
650216 2 9 # of C7
650228 3 1 C2 vertical split of ondontiod 650230 2 4 Atlanto-occipital fracture dislocation 650234 3 1 Unstable T12 compression # (burst)
AISCODE AIS F CHEST INJURY DESCRIPTION
420216 5 1 complete aortic transection 420218 6 1 complete aortic transection
421004 3 1 Rupture of the base of the pulmonary artery 440810 5 2 Transected oesophagus
441008 3 2 3cm laceration posterior wall of R atrium 441012 5 3 Small tear in R atrium
441406 3 7 Pulmonary contusion to right lung 441410 4 11 Bilateral lung contusion - L 441430 3 3 Right lung laceration
441434 4 1 superficial laceration to L lung 441450 4 2 Multiple, bilateral lacerations to lungs 441602 2 2 Anterior rupture to pericardium 441800 2 1 Multiple perforations of pleural linings 442202 3 6 Bi-lateral haemothoraces
442204 3 2 Pneumomediastinum
442208 4 1 Haemomediastinum with 100mls of blood 442210 2 1 Tension pneumothorax
442610 5 2 Complete transection of the trachea 450203 3 1 Multiple #'s L 3 -6 posterior ribs 450214 3 2 R rib # with R pneumothorax 450220 2 4 Multiple rib fractures on left and right 450222 3 2 Right pneumothorax + 3 x rib fractures R 450230 3 9 # ribs: 1-6 L & 1-3 R
450232 4 7 Fractures to 2, 3, 4 & 5 ribs on left side 450240 4 6 Multiple bilateral comminuted rib fractures
AISCODE AIS F ABDOMINAL INJURY DESCRIPTION
520208 5 1 Transection of aorta in abdomen 540610 2 1 Bladder perienal haemorrhage
540640 3 1 Extensive damage and rupture to bladder 541299 2 1 Collapse to gall bladder NFS
541620 2 1 Multiple lacerations of the R kidney 541622 2 1 Small rupture close to hilum of R kidney 541628 5 1 Complete avulsion of right kidney 541812 2 1 Contusion R lobe of liver
541814 3 1 Liver shows severe contusional damage 541820 2 5 Numerous lacerations to liver anteriorly 541822 2 3 Small tear in liver
541826 4 5 Multiple deep lacerations to R liver 541840 4 1 Extensive ruptures of liver
541899 2 1 Gross blunt injury to liver 542010 2 2 Intraperitoneal haemorrhage 542022 2 1 Small mesenteric tear in the jejunum 543800 3 1 1.4 litres of fresh blood in peritoneum 544220 2 3 Single laceration of the spleen 544222 2 3 Lacerations across surface of spleen 544240 3 1 Extensive ruptures through splenic capsule
544299 2 2 Wrinkled capsule in spleen 544624 2 1 Ruptured testicle
544820 2 2 Tearing of left ureter
AISCODE AIS F THORACO/LUMBAR SPINE INJURY DESCRIPTION
640440 5 1 Complete transection of the spine T2/T3 650416 2 12 Fracture of thoracic spine affecting T3 650418 2 1 # T3 spinal process
650430 2 5 Fracture through T3 vertebral body 650432 2 2 Wedge compression fracture T11 spine 650434 3 2 Crushed T 7
650616 2 2 Spinal column # with displacement at T1 650620 2 5 Lumbar spine #L5 process transverse on L 650630 2 1 Crush # body L1
AISCODE AIS F ARM INJURY DESCRIPTION
710030 2 1 Anterior dislocation to left shoulder 730440 2 1 Complete lesion L median & ulnar nerves 750230 2 2 Subluxation acromio-clavicular joint 751030 2 3 Grade 3 dislocation to ACJ right shoulder 751230 2 1 R sternal dislocated clavicular joint 751430 2 4 # right scaphoid
751800 2 4 Fracture to right shoulder 752000 2 2 Open fracture to 2nd metacarpal 752002 2 13 Avulsion # right little finger metacarpal 752200 2 24 Fracture to right clavicle laterally 752402 2 1 Loss of pharynx 5th R finger 752451 2 1 Snuffbox fracture to right scaphoid 752600 2 4 Fracture to right humerus
752602 2 7 Closed fracture to right humerus 752604 3 2 Comminuted fracture of right humerus 752606 3 1 # midshaft L humerus
752800 2 10 Smith fracture to distal radius left wrist 752802 2 10 Undisplaced fracture to R radial styloid 752804 3 12 Fracture to distal radius left wrist 753000 2 6 Isolated fracture of scapula neck 753200 2 5 Fracture to left ulna styloid
753202 2 5 Simple transverse # distal 1/3rd R ulna 753204 3 6 Deforming compound comminuted # of R ulna 753206 3 1 # L ulnar styloid with nerve involvement
AISCODE AIS F PELVIC INJURY DESCRIPTION
852600 2 8 # of pubis with widening of the symphysis 852604 3 2 Extensive open book type fracture to pelvis 852606 4 2 Extensive #ing of the pelvis; # pubis symp 853000 3 1 # all 4 pubic rami
AISCODE AIS F LEG INJURY DESCRIPTION
810604 2 1 20 x 20cm open laceration back of R knee 815004 2 1 Deglove laceration to left lateral shin 821008 3 1 Divided posterior tibial R artery
840300 2 1 Horizontal cleavage tear of medial meniscus 840402 2 2 Lateral ligament tear R ankle
840404 2 7 Rupture to collar ligament L lateral knee 840406 3 2 Ligamentous injuries to R knee 840600 2 1 Small muscle tear lower left leg 840802 2 1 Tendon tear lower left leg 841002 2 1 Laceration to tendon,left knee 850210 2 1 Dislocation to left ankle 850610 2 3 Left femur externally rotated. 850806 2 1 Dislocation to left knee
850818 2 1 8 x 3 cm laceration into R knee joint 850826 2 3 sprain to right knee
851605 2 9 Comminuted # under 1/3 right fibula 851606 2 15 # Right fibula, midshaft, open, comminuted 851608 2 7 Fracture to lateral malleous right ankle 851610 2 2 Avulsion fracture to R lateral malleolus 851800 3 1 Closed fracture to right femur
851801 3 4 Open, comminuted # to midshaft right femur 851804 3 3 Compound # to femoral condyle
851808 3 1 # R hip
851814 3 12 Fracture of mid right femur
851815 3 6 # right femur, comminuted, open midshaft 851822 3 1 Supracondylar fracture to left femur 852400 2 7 Compound fracture to right patella 853200 2 3 Open # with dislocation to left ankle 853404 2 4 Fracture to left upper tibia at the knee 853405 3 9 Comminuted # under 1/3 right tibia 853406 2 2 Open tibial plateau # L knee
853408 3 3 Comminuted # lateral tibial plateau - left 853412 2 2 Oblique # R medial malleolus - ankle 853414 2 3 Weber A # medial malleolus right ankle 853416 2 2 Undisplaced # posterior L malleolus 853420 2 3 Left tibia, closed transverse midshaft # 853422 3 11 Right tibia, midshaft, open comminuted #
AISCODE AIS F FOOT INJURY DESCRIPTION
851398 2 2 Avulsion # R navicular (ankle) 851400 2 1 # R calcaneus - complete avulsion # 852200 2 5 Fractures to necks of metatarsals 3, 4 & 5