Basic Current Measurements
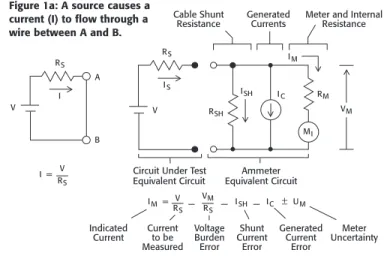
In a typical circuit (see Figure 1a), a source causes a current (I) to flow through the circuit. The goal of any electrical current measurement is to insert an ammeter in series with the circuit so that the current measured on the ammeter is identical to the cur rent originally flowing through the circuit. To do so, the circuit is broken between points A and B, and the meter is connected as shown in Figure 1b. In the ideal case, the meter would have absolutely no effect on the circuit. For practical measurements, however, several error sources may be present. These error sources can result in substantial uncertainty in the measurement, as we will now discuss.
Any ammeter can be modeled to consist of the three separate circuit elements shown in Figure 1b: a shunt resistance (RSH) caused by the input cable connected to the meter; a generator of unwanted current (IC), which represents mainly currents gener ated by interconnections; and an internal resistance (RM), which includes series cable resistance. Note that RM is in series with an ideal ammeter (MI), having no resistance or current source of its own.
When the ammeter is connected in the circuit to be meas ured, the current indicated on the meter is equal to the cur rent that would flow through the circuit without the ammeter inserted in the circuit, less errors caused by elements in the cir cuit model. These errors consist of current flowing through the model shunt resistance, currents generated by the interconnec
tions, errors induced by the voltage burden (or drop) across the entire ammeter model, and the uncertainty of the meter itself.
With measurements of currents in the normal range (typically >1mA), errors caused by ammeter voltage burden, shunt cur rents, and noise current are often small enough to be ignored. In these cases, the displayed current reading is simply equal to the actual current plus or minus inherent meter uncertainty, (UM). Meters designed to measure these normal currents generally con sist of a voltmeter circuit that measures the voltage drop across a shunt resistor inserted in the series with the circuit being meas ured. (See the discussion on shunt ammeters that follows.) The reading provided by the voltmeter is thus directly proportional to the current flow.
Unfortunately, the voltage burden (input voltage drop) pro duced by such meters usually ranges from 200mV to about 2V. This voltage drop is sufficient to cause errors with current meas urements below the normal range. To avoid such large voltage drops, picoammeters and electrometers use a high gain amplifier with negative feedback for the input stage. As a result, the voltage burden is greatly reduced—on the order of 200µV or less. This low voltage burden reduces both measurement errors and the minimum shunt cable resistance that must be maintained to pro vide a given meter accuracy. Consequently, no special measures need be taken to obtain unusually high cable resistance.
Typical picoammeters or electrometers that employ feedback ammeters generally provide sensitivities to 1fA (10–15A) or less and typical accuracy of 0.1% to 3%.
Shunt vs. Feedback Ammeters
There are two basic techniques for making low current measure ments: the shunt method, and the feedback ammeter technique. The shunt configuration is used primarily in DMMs (digital mul timeters) and in older electrometers where cable capacitance causes problems in the feedback mode. Picoammeters and newer electrometers use only the feedback ammeter configuration. The major difference between picoammeters and electrometers is that electrometers are multifunction instruments, while picoam meters measure only current. Also, a typical electrometer may have several decades better current sensitivity than the typical picoammeter.
Shunt Picoammeter
Shunting the input of an electrometer voltmeter with a resistor forms a shunt ammeter, as shown in Figure 2. The input current (IIN) develops an input voltage EIN across the shunt resistance (RSHUNT) as follows: RS A B V I RS IS V IM RM IC ISH RSH MI Cable Shunt Resistance
Circuit Under Test Equivalent Circuit RS V I = RS V IM = R S VM I SH IC ±UM Indicated Current Currentto be Measured VM Ammeter Equivalent Circuit Voltage Burden Error Shunt Current Error Generated Current Error Meter Uncertainty Generated
Currents Meter and InternalResistance
Figure 1a: A source causes a current (I) to flow through a wire between A and B.
Figure 1b: When an ammeter and connecting cable are used in place of a wire, a voltage burden (VM) is developed, which forces a shunt current (ISH)
through the shunt resistance (RSH) of the cable. Unwanted error currents
(IE) are also generated due to various phenomena discussed in the text.
Low Current Measurements
Number 1671Application Note
Se ries
EIN = IINRSHUNT
Note that the voltage sensitivity of the circuit is controlled both by the value of RSHUNT and the relative values of RA and RB. Thus, the output voltage (EOUT) is given by:
RA + RB RA + RB
EOUT = EIN _________ = IINRSHUNT _________
(
RB)
(
RB)
Although it might appear advantageous to use a larger value for RSHUNT, there are actually several good reasons why RSHUNT should be made as small as possible. First, low value resistors have better time and temperature stability, and a better voltage coefficient than high value resistors. Second, low resistor values reduce the input time constant and result in faster instrument response times. Finally, for circuit loading considerations, the input resistance RSHUNT of an ammeter should be small to reduce the voltage burden EIN.
However, using an electrometer (or any voltmeter) on its most sensitive range introduces noise and zero drift into the measure ment. In contrast, Johnson noise current decreases as the value of RSHUNT increases. Thus, some compromise between these two opposing requirements is usually necessary. Choosing a 1–2V fullscale sensitivity and the appropriate shunt resistance value is often a good compromise.
Feedback Picoammeter
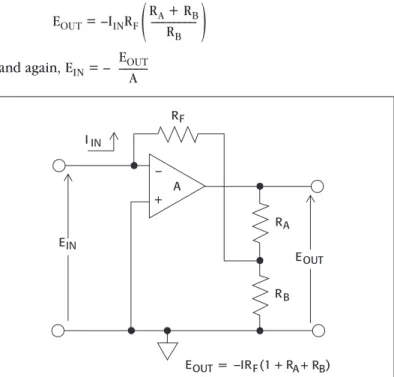
Figure 3 shows the general configuration of a feedback type ammeter. In this configuration, the input current (IIN) flows into the input terminal of the amplifier (A), and it also flows through the feedback resistor (RF). The low offset current of the amplifier changes the current (IIN) by a negligible amount.
Thus, the output voltage is a measure of the input current, and sensitivity is determined by the feedback resistor (RF). The low voltage burden (EIN) and corresponding fast rise time are achieved by the high gain operational amplifier, which forces EIN to be nearly zero.
Circuit analysis shows that:
EOUT
EOUT + IINRF = EIN EOUT = –AEIN, and EIN = – ______
A
EOUT
Thus, EOUT + IINRF = – ______
A
EOUT
Since A>>1, EOUT = –IINRF and |EIN| = ______ <<EOUT
A
Note that the amplifier gain can be changed as in the voltme ter circuit, using the combination shown in Figure 4. In this case, resistors RA and RB are added to the feedback loop, forming a multiplier. The gain of the circuit is determined by the feedback resistor and by the relative values of RA and RB and is given as follows: RA + RB EOUT = –IINRF ________
(
RB)
EOUT and again, EIN = – _____ A A + – RA RB EOUT EIN IIN RF EOUT = –IRF(1 + RA + RB)Figure 4: Feedback ammeter with selectable voltage gain
Sources of Current Errors
Errors in currentmeasuring instruments arise from extraneous currents flowing through various circuit elements. In the model circuit of Figure 5, the current (IM), indicated on the meter, is IIN EOUT = IINRSHUNT EIN RSHUNT EOUT RA RB RA + RB RB A + –
Figure 2: Shunt ammeter
IIN EOUT = –IINRF RF Input Output EOUT EIN A + –
actually equal to the current (I1) through the meter, plus addi tional meter uncertainty (UM). I1 is the signal current (IS), less shunt current (ISH) and the sum of all generated currents (IE).
The circuit model shown in Figure 5 identifies various noise and error currents generated during a typical current measure ment. The ISE current generator represents noise currents gener ated within the source itself. These currents could arise due to leakage, piezoelectric, or triboelectric effects, or through dielec tric absorption.
Similarly, the ICE current generator represents currents gener ated in the interconnection between the meter and the source circuit. The same sources that generate noise currents in the cir cuit under test may produce noise in the interconnection. IRE is generated by the thermal activity of the shunt resistance and the rms value of the noise current and is given by:
IRE = 4kTf/RSH
where: k = Boltzman’s constant (1.38 × 10⁻²³J/K) T = absolute temperature in K
f = noise bandwidth in Hz RSH = resistance in ohms
Since peaktopeak noise is about five times the rms value, the noise current can be ignored when measuring currents above 10–14A.
Finally, IIE is the specified sum of error currents in the meas uring instrument.
Noise Currents
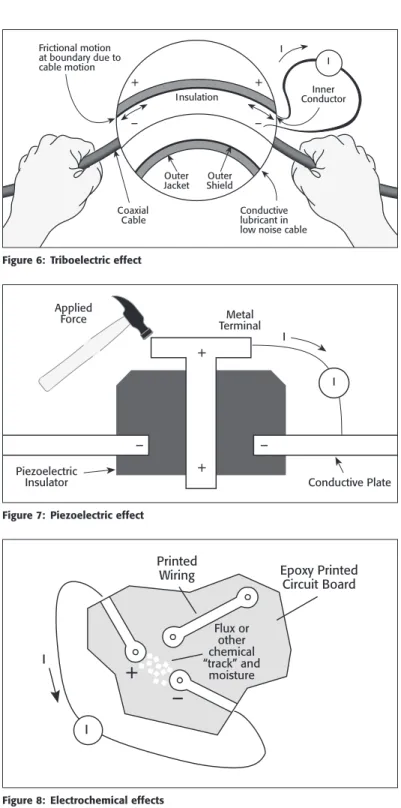
The noise current generators ICE, ISE, and IIE in the above model represent unwanted currents generated at a particular point in the circuit. These currents may arise from triboelectric, piezo electric, and electrochemical effects, or from resistive leakage or dielectric absorption.
Triboelectric currents (shown in Figure 6) are generated by charges created at the interface between a conductor and an insulator due to friction. Here, free electrons rub off the conduc tor and create a charge imbalance that causes a current flow. A typical example would be electrical currents generated by insula tors and conductors rubbing together in a coaxial cable. Special
low noise coax and triax cables are available to minimize this problem.
Piezoelectric currents (Figure 7) are generated when
mechanical stress is applied to certain insulating materials. These currents are generated in ceramics and other crystalline materi als used for insulating terminals and interconnecting hardware. Similar stored charge effects occur in many plastics.
Noise currents also arise from electrochemical effects, which are shown in Figure 8. Here, chemicals cause weak batteries between two conductors on a circuit board. For example, com monly used epoxy printed circuit boards can generate currents
RSH V IISESE ICE IRE IIE I1 I1= IS – ISH – IE IE= ISE + ICE + IRE + IIE Current Source IS IS ISE ICE = = = Source current Source noise current Interconnection noise current
RSH IRE IIE = = = Shunt resistance Shunt resistance noise Instrument error current
M
Figure 5: Sources of current errors
I Frictional motion at boundary due to cable motion + + – – Insulation Coaxial Cable Outer Jacket ShieldOuter
Conductive lubricant in low noise cable
Inner Conductor
I
Figure 6: Triboelectric effect
I + + Applied Force – – Piezoelectric
Insulator Conductive Plate
I Metal
Terminal
Figure 7: Piezoelectric effect
I Printed Wiring
+
–
I Epoxy Printed Circuit Board Flux or other chemical “track” and moistureof several nanoamps when not thoroughly cleaned of etching solution, flux, or other material. To prevent these error currents, all interconnecting circuitry should be thoroughly cleaned using a cleaning solvent such as methanol, and then be allowed to dry completely before use.
Dielectric absorption can occur when a voltage applied across an insulator causes positive and negative charges within that insulator to polarize. When the voltage is removed, the separated charges generate a decaying current through external circuitry as they recombine. The effects of dielectric absorption can be minimized by avoiding the application of voltages more than a few volts to insulators to be used for sensitive current measure ments. If this practice is unavoidable, it may take minutes or even hours in some cases for currents caused by dielectric absorption to dissipate.
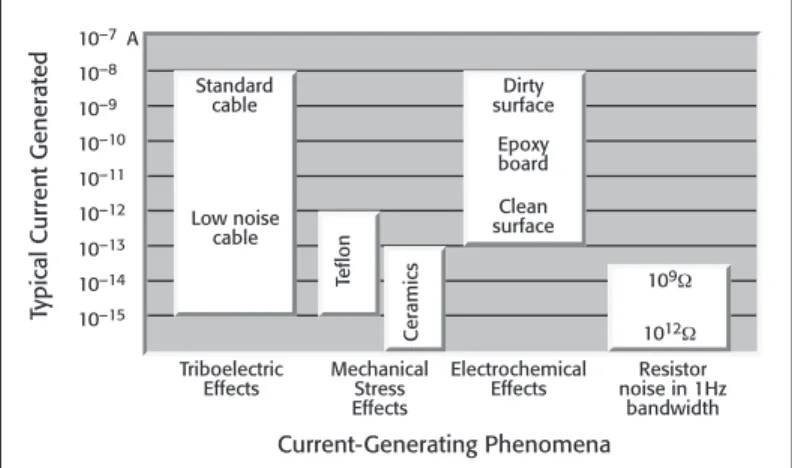
Figure 9 summarizes approximate magnitudes of the various currentgenerating effects.
Guarding
High resistance paths between low current conductors and near by voltage sources can cause significant leakage currents, which can be eliminated through guarding. Basically, guarding uses a conductor at the same potential as the sensitive current path to totally surround the input leads carrying the high impedance sig nals. This guard conductor is driven by a low impedance source, and maintaining the conductor at the same potential as the high impedance source results in drastically reduced leakage currents from those leads.
For example, assume that an ammeter is to be used to meas ure the reverse current ID through the diode shown in Figure 10a. If the meter (a picoammeter or electrometer ammeter) is connected in series with the diode (Figure 10b), it will measure not only the diode current (ID), but also the leakage current (IL) that flows through the leakage resistance path (RL). If RL has a value of 1GW (109W, a reasonable value for many insulators), the leakage current (IL) would be 15nA (assuming a 15V potential across the circuit, as shown).
Obviously, the large value of leakage current would obscure the actual diode reverse current (ID), which is typically much
lower than 15nA in modern diodes. One way to solve the prob lem is to increase the leakage resistance (RL) to 1TW, reducing IL to 15pA, which still may be large compared to ID.
Another way to reduce the effects of leakage currents is to guard the connection between the diode and the picoammeter so that it is completely surrounded by a conductor connected to the same potential (+15V in this example). The resulting con figuration is shown in Figure 10c. Since a typical feedback pico ammeter has a maximum voltage burden of only 200µV, the volt age across RL is reduced to that value, and the leakage current now becomes:
200µV IL≤ _______
1GW
IL≤ 2 × 10–13A (0.2pA)
Thus, IL is reduced by four decades and is likely to be insig nificant compared to ID.
The current flowing through RG is still 15nA, but it is now supplied by the low impedance +15V source, and it does not present a problem since it is not measured by the ammeter.
Another situation where guarding is beneficial is shown in Figure 11a. In this case, the leakage resistance of a coaxial cable whose shield is grounded will reduce the output voltage of a high resistance source, as shown in Figures 11a and 11b. Note that voltage actually measured by the high impedance voltmeter is attenuated by the voltage divider formed by the source resist ance (RS) and the leakage resistance (RL).
10–7 A 10–8 10–9 10–10 10–11 10–12 10–13 10–14 10–15 Clean surface Teflon Ceramics 109 1012 Triboelectric Effects Current-Generating Phenomena
Typical Current Generated
Dirty surface Epoxy board Standard cable Low noise cable Mechanical Stress Effects Electrochemical
Effects noise in 1HzResistor bandwidth
Figure 9: Typical magnitudes of currents generated by low current phenomena
+15V ID R1 R2 +15V ID R1 R2 1GΩRL= IL=1GΩ15V = 15nA I = I + I +15V ID R1 R2 1GΩRL= IL≤ 0.2pA GU ARD I = ID RG= 1GΩ IG=1GΩ15V = 15nA I I D L
Figure 10a: A diode whose reverse current ID is to be
measured.
Figure 10b: An ammeter measures both ID and IL, the
leakage current.
Figure 10c: By guarding the input to the picoammeter, IL is greatly reduced, and the picoammeter measures ID accurately.
If instead, the shield is connected to a low impedance source of the same potential as the high resistance source, such as the unitygain or preamp output of an electrometer voltmeter (Figure 11c), leakage from the center conductor to the shield will vanish, since there is essentially no potential across the insulator (RL). Leakage current (IG) from the outer guard shield to ground may be considerable, but it is of no consequence since the cur rent is supplied by the low impedance preamp output rather than by the high impedance source.
Although the main advantage of guarding is in the reduction of leakage resistance effects, another is the reduction of effective input capacitance. Measurement rise time depends both on the equivalent source resistance and the effective meter input capaci tance, which depends both on the electrometer input capacitance and the connecting cable capacitance. Thus, for high resistance measurements, even a small amount of cable capacitance can result in very long rise times. For example, an input capacitance of 1,000pF (including the input cable) and a resistance of 200GW results in a time constant (t = RC) of 200 seconds, and 1,000 seconds (more than 16 minutes) must be allowed for the mea surement to settle to within 1% of final value.
Modern electrometers, such as the Models 6514, 6517B, and 6430, have builtin provisions to take full advantage of guarding. In the guarded mode, the effective cable capacitance can be reduced to about 20pF, speeding up measurements by a factor of 50.
High Resistance Measurements
When resistances >1GW must be measured, an electrometer is usually required. An electrometer may measure high resistance by either the constant voltage or the constant current method. Some electrometers allow the user to choose either method. The constant voltage method utilizes the electrometer ammeter and a voltage source, while the constant current method uses the elec trometer voltmeter and a current source. A description of these techniques follows.
Constant Voltage Method
To make high resistance measurements using the constantvoltage method, an electrometer ammeter or picoammeter and a con stant voltage source are required. Some electrometers and pico ammeters have voltage sources built into the instrument and can automatically calculate the resistance. This section describes this method and ways to reduce the leakage resistance due to test fix turing when making these measurements.
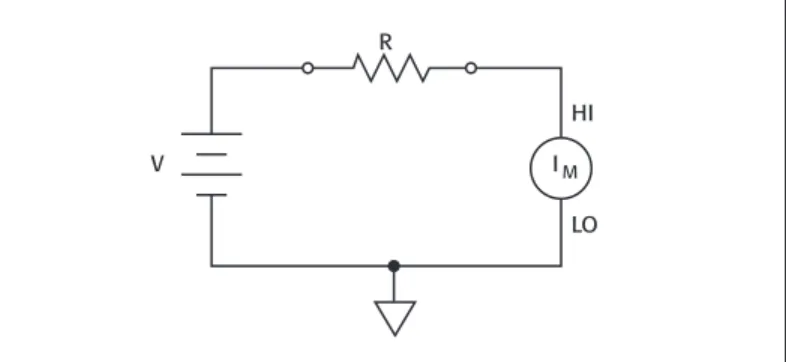
Basic Configuration
The basic configuration of the constant voltage method is shown in Figure 12. In this method, a constant voltage source (V) is placed in series with the unknown resistor (R) and an electrom eter ammeter (IM). Since the voltage drop across the ammeter is negligible, essentially all the voltage appears across R. The result ing current is measured by the ammeter and the resistance is calculated using Ohm’s Law (R = V/I).
V
R
IM HI
LO
Figure 12: Constant voltage method for measuring high resistance
Because high resistance is often a function of the applied volt age, this method is preferred compared to the constant current method. By testing at several voltages, a resistance vs. voltage curve can be developed and a “voltage coefficient of resistance” can be determined. Some of the applications that use this meth od include testing twoterminal high resistance devices, meas uring insulation resistance, and determining the volume and surface resistivity of insulating materials.
The constant voltage method requires using an electrometer ammeter, so all the techniques and errors sources apply to this method. One common error source when making high resistance measurements is due to the leakage resistance of the cables and fixturing. Two methods for eliminating fixture leakage are guard ing and baseline suppression.
HI EG + – HI LO LO EO RG IG RL RS ES ES RL RS RS EO EO= R L + RS RL Electr ometer Voltmeter X1 or Preamp Output RS ES RL EO HI LO High Impedance Voltmeter Source ES
Figure 11a: A high resistance source is to be measured by a high impedance voltmeter.
Figure 11b: Equivalent circuit of Figure 10a showing loading effect of the connecting cable resistance RL.
Figure 11c: A guarded configuration for the same measurement. No current flows through RL since EG = EO≈ ES.
Baseline Suppression
Although the constant voltage method is suitable for measuring very high resistance values and is quite fast, some care should be taken to suppress any leakage currents present in the system. Otherwise, any leakage current adds to the test current, reducing resistance measurement accuracy. Such leakage currents can be nulled out by using baseline suppression.
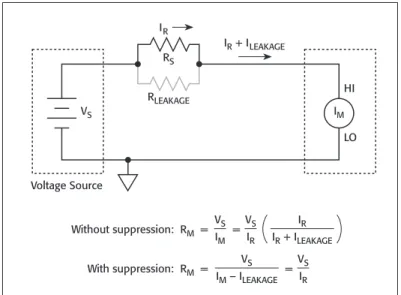
Consider the test circuit shown in Figure 13. In this instance, the test resistance is removed from the system, and any leakage current flowing through RLEAKAGE is measured by the meter as ILEAKAGE. At this point, the current suppression feature of the meter is enabled to null out the leakage current.
IM RLEAKAGE ILEAKAGE VS Voltage Source HI LO
Figure 13: Leakage resistance (RLEAKAGE) causes a current (ILEAKAGE) to flow. If we connect the DUT for measurement (Figure 14), the resistance can then be determined based on the present meas ured current and the suppressed leakage current previously determined:
VS
RS = _______________
IM – ILEAKAGE
Example: Assume that VS = 10V, IM = 11pA, and ILEAKAGE = 1pA. Without suppression, the measured resistance is:
10V
RS = ______ = 909GW 11pA
With suppression, the measured resistance is: 10V
RS = ____________ = 1T11pA – 1pA W
Thus, we see that suppression eliminates an error of about 9% in this example.
Guarding and Capacitive Effects
To minimize shunt currents, most electrometer amplifiers include a guard connection to their amplifier outputs. Since the guard output is a unitygain output, the voltage potential across insulators connected between the input terminal and guard is essentially zero. In general, the same techniques used to mini mize leakage current in low current measuring situations can minimize these effects in high resistance measurements.
One additional source of error in high resistance measure ments is parasitic capacitance, normally associated with cables
and connectors. At high resistance levels, even a few picofarads of stray capacitance can significantly affect circuit rise times and thus the settling time required for accurate measurements. For example, a 10TW (1013W) resistance and a cable capacitance of 100pF results in an RC time constant of 1,000 seconds. Since five time constants are required for the circuit to settle to within 1%, more than 80 minutes would be required for the circuit to settle adequately.
Guarding a high resistance measurement reduces the effects of stray capacitance considerably. The effective capacitance is reduced by a factor equal to the openloop gain of the ampli fier—typically from 104 to 106.
Low Current Measurement Applications
Application 1: Sub-Threshold Voltage Characterization One important lowcurrent application is characterizing the sub threshold voltage of a MOSFET. This test requires at least one picoammeter and two voltage sources. One voltage of the voltage sources sweeps a gate voltage, while the other provides a con stant DC bias to the drain of the MOSFET. The drain current and (optionally) the gate current are measured for each gate bias volt age value. Figure 15 shows the connections for this test.
Voltage Source (1) Voltage Source (2) Input LO (1) Input LO (1) HI (1) IM Input LO (2) HI (2) IM
Figure 15. MOSFET sub-threshold voltage test using picoammeters and voltage sources (such as the Model 6482 Dual Channel Picoammeter/Voltage Source).
Without suppression: RM = VS IM = VS IR IR IR + ILEAKAGE With suppression: RM = VS IM – ILEAKAGE = VS IR IM RLEAKAGE RS IR IR + ILEAKAGE VS Voltage Source HI LO
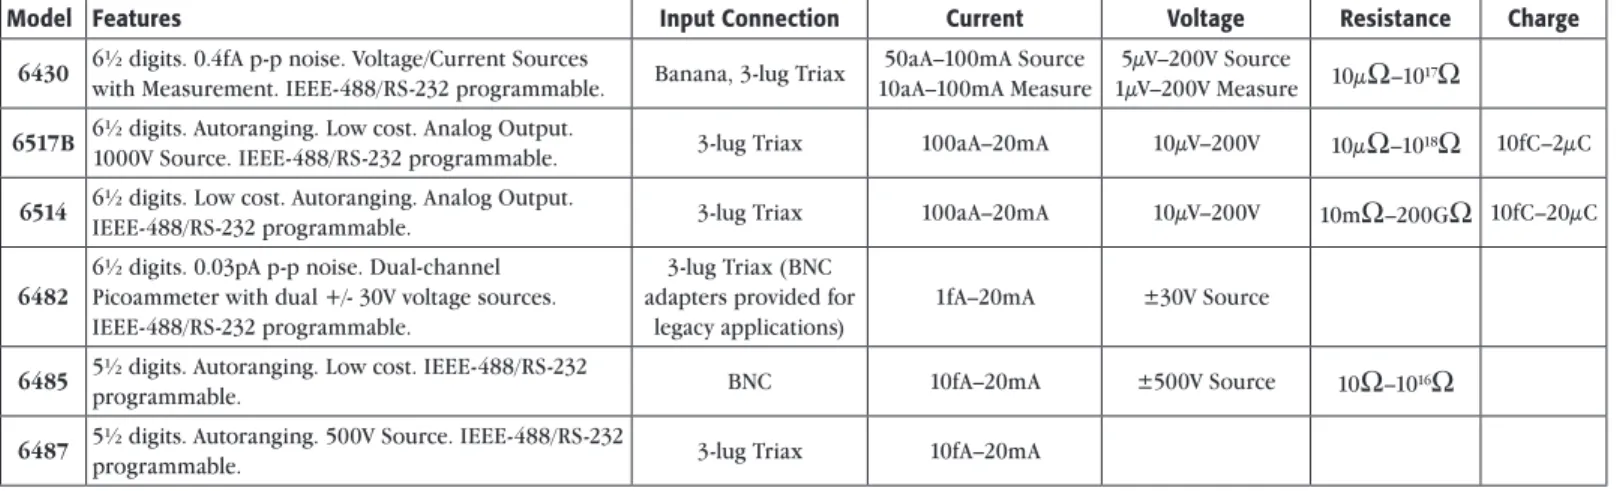
Electrometer/Picoammeter Selector Guide
Model Features Input Connection Current Voltage Resistance Charge
6430 6½ digits. 0.4fA pp noise. Voltage/Current Sources
with Measurement. IEEE488/RS232 programmable. Banana, 3lug Triax
50aA–100mA Source 10aA–100mA Measure
5µV–200V Source
1µV–200V Measure 10µW–1017W
6517B 6½ digits. Autoranging. Low cost. Analog Output.
1000V Source. IEEE488/RS232 programmable. 3lug Triax 100aA–20mA 10µV–200V 10µW–1018W 10fC–2µC
6514 6½ digits. Low cost. Autoranging. Analog Output.
IEEE488/RS232 programmable. 3lug Triax 100aA–20mA 10µV–200V 10mW–200GW 10fC–20µC
6482
6½ digits. 0.03pA pp noise. Dualchannel Picoammeter with dual +/ 30V voltage sources. IEEE488/RS232 programmable.
3lug Triax (BNC adapters provided for
legacy applications)
1fA–20mA ±30V Source
6485 5½ digits. Autoranging. Low cost. IEEE488/RS232
programmable. BNC 10fA–20mA ±500V Source 10W–1016W
6487 5½ digits. Autoranging. 500V Source. IEEE488/RS232
programmable. 3lug Triax 10fA–20mA
When properly biased, the drain current of the MOSFET during the subthreshold voltage test will vary from subpA to 1µA or so.
Application 2: Photodiode Dark Current
Another useful low current application is the characterization of the dark current of a photodiode. In this application, the pho todiode is reverse biased by a swept voltage source while the current is measured for each change in voltage bias. The dark current of a photodiode can vary from a few hundred fA to a few hundred pA as the bias voltage is changed. These current levels require the use of an accurate picommeter or electrometer. Figure 16 shows the connections for this test.
Voltage
Source ShieldLight
Input
LO HI
IM
Light shield and DUT connect to Input LO
Figure 16. Dark current characterization of a photodiode using picoammeter and voltage source (such as the Model 6482.)
Test System Safety
Many electrical test systems or instruments are capable of mea suring or sourcing hazardous voltage and power levels. It is also possible, under single fault conditions (e.g., a programming error or an instrument failure), to output hazardous levels even when the system indicates no hazard is present.
These high voltage and power levels make it essential to pro tect operators from any of these hazards at all times. Protection methods include:
• Design test fixtures to prevent operator contact with any haz ardous circuit.
• Make sure the device under test is fully enclosed to protect the operator from any flying debris.
• Double insulate all electrical connections that an operator could touch. Double insulation ensures the operator is still protected, even if one insulation layer fails.
• Use high-reliability, fail-safe interlock switches to disconnect power sources when a test fixture cover is opened.
• Where possible, use automated handlers so operators do not require access to the inside of the test fixture or have a need to open guards.
• Provide proper training to all users of the system so they understand all potential hazards and know how to protect themselves from injury.
It is the responsibility of the test system designers, integra tors, and installers to make sure operator and maintenance per sonnel protection is in place and effective.
Specifications are subject to change without notice. All Keithley trademarks and trade names are the property of Keithley Instruments, Inc. All other trademarks and trade names are the property of their respective companies.
KEITHLEY INSTRUMENTS, INC. ■ 28775 AURORA RD. ■ CLEVELAND, OH 44139-1891 ■ 440-248-0400 ■ Fax: 440-248-6168 ■ 1-888-KEITHLEY ■ www.keithley.com
BELGIUM Sint-Pieters-Leeuw Ph: 02-3630040 Fax: 02-3630064 [email protected] www.keithley.nl CHINA Beijing Ph: 86-10-8447-5556 Fax: 86-10-8225-5018 [email protected] www.keithley.com.cn FRANCE Les Ulis Ph: 01-69868360 Fax: 01-69868361 [email protected] www.keithley.fr GERMANY Germering Ph: 089-84930740 Fax: 089-84930734 [email protected] www.keithley.de INDIA Bangalore Ph: 080-30792600 Fax: 080-30792688 [email protected] www.keithley.in ITALY
Peschiera Borromeo (Mi) Ph: 02-5538421 Fax: 02-55384228 [email protected] www.keithley.it JAPAN Tokyo Ph: 81-3-6714-3070 Fax: 81-3-6714-3080 [email protected] www.keithley.jp KOREA Seoul Ph: 82-2-6917-5000 Fax: 82-2-6917-5005 [email protected] www.keithley.co.kr MALAYSIA Penang Ph: 60-4-643-9679 Fax: 60-4-643-3794 [email protected] www.keithley.com NETHERLANDS Son Ph: 040-2675502 Fax: 040-2675509 [email protected] www.keithley.nl SINGAPORE Singapore Ph: 01-800-8255-2835 Fax: 65-6356-4483 [email protected] www.keithley.com.sg TAIWAN Hsinchu Ph: 886-3-572-9077 Fax: 886-3-572-9031 [email protected] www.keithley.com.tw UNITED KINGDOM Bracknell Ph: 044-1344-392450 Fax: 044-1344-392457 [email protected] www.keithley.co.uk
© Copyright 2012 Keithley Instruments, Inc. Printed in the U.S.A No. 1671 Rev. 09.14.12