Increased subchondral bone thickness in hips with cam-type femoroacetabular
1impingement
23
Martina Bieri1, Martin Beck2*, Andreas Limacher3, Michael C Wyatt2, Michael Leunig4, Peter Jüni5 and
4
Stephan Reichenbach5,6
5 6
1Clinic of Paediatrics, Luzerner Kantonsspital Luzern, Switzerland
7
2Clinic for Orthopaedic and Trauma Surgery, Luzerner Kantonsspital, Luzern, Switzerland
8
3Clinical Trial Unit Bern, Department of Clinical Research, and Institute of Social and Preventive
9
Medicine (ISPM), University of Bern, Switzerland 10
4Schulthess Clinic, Department of Orthopaedics, Zürich, Switzerland
11
5Institute of Primary Health Care (BIHAM), University of Bern, Switzerland
12
6Department of Rheumatology, Immunology and Allergology, University Hospital and University of
13
Bern, Switzerland 14
15
*Corresponding author at: Martin Beck, Clinic for Orthopaedic and Trauma Surgery, Luzerner 16
Kantonsspital Spitalstrasse 4, 6004 Luzern, Switzerland. Email: martin.beck@luks.ch 17
18
Keywords: Cam, MRI, subchondral bone changes 19
source:
https://doi.org/10.7892/boris.123149
4 Tables and 4 Figures 20
Table 1: Comparison of attenders of MRI examination with non-attenders and non-invited
21
individuals. 22
Table 2: Comparison of measurements in hips with and without cam-type deformity.
23
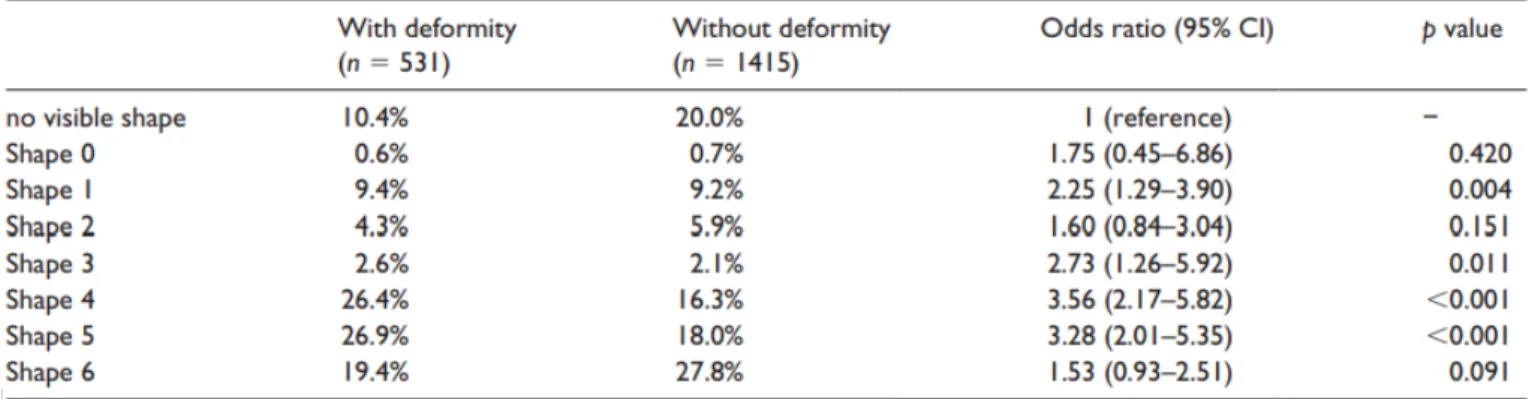
Table 3: Comparison of shapes of sclerosis in hips with and without cam-type deformity.
24
Table 4: Intra-rater ICC for the different parameters.
25
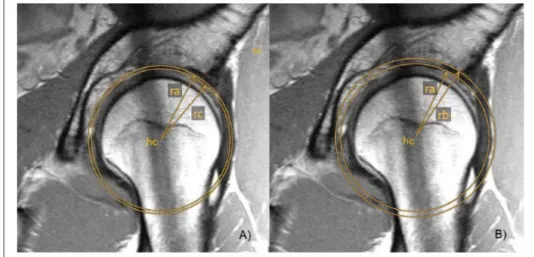
Figure 1: Segment with subchondral sclerosis/length (B) represents the border of the osseous
26
acetabulum without labrum and (C) the end of the subchondral sclerosis along the circle with Radius 27
ra 28
Figure 2: Thickness of the subchondral sclerosis
29
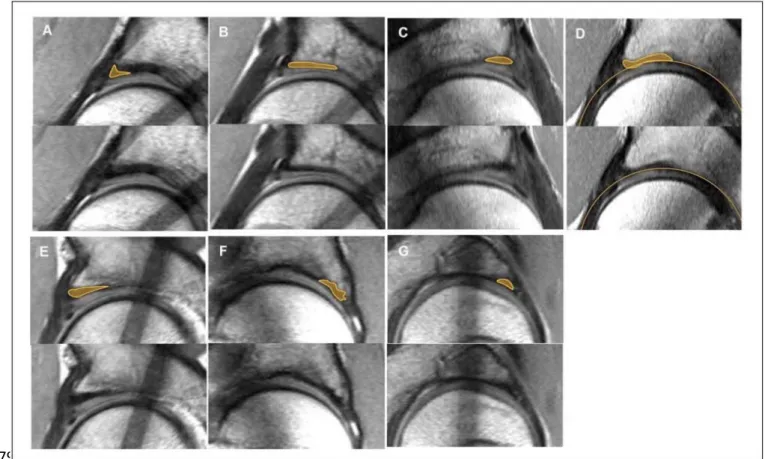
Figure 3: Shape of subchondral sclerosis.
30
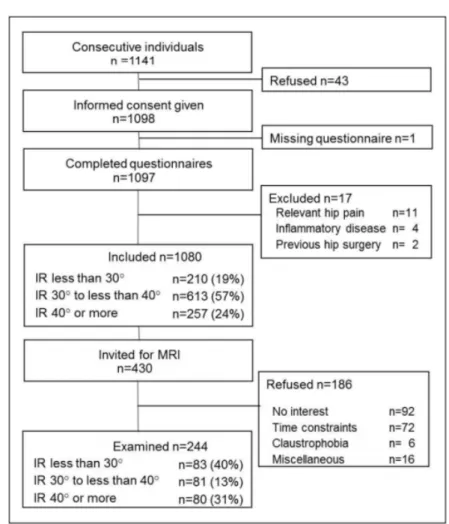
Figure 4: Study flow chart. Adapted from Reichenbach et al.10
ABSTRACT 32
Objectives: Increased thickness of subchondral acetabular bone with associated articular cartilage
33
thinning in hips with femoroacetabular (FAI) cam impingement has been observed on magnetic 34
resonance imaging (MRI). Dynamic attrition by the cam deformity moving into the acetabulum may 35
potentiate trans-articular shear stresses thus causing these subchondral bone changes. We aimed to 36
quantify the hypertrophic changes of subchondral acetabular bone in patients with cam-type FAI. 37
Methods: MRI studies were performed on an asymptomatic population of young Swiss army
38
recruits. Subjects underwent clinical examination and completed questionnaires before undergoing 39
an MRI of the hip. Cam deformities were graded and the dimensions of the acetabular subchondral 40
bone quantified. Univariate linear regression was used to determine the association between the 41
presence of cam deformities and the degree of subchondral acetabular sclerosis. 42
Results: There was a strong association between cam deformities and the thickness, area and shape
43
of subchondral sclerosis. The main increase in hypertrophy was observed in the antero-superior 44
acetabulum where impingement typically occurs. The subchondral sclerosis was 0.66 mm thicker in 45
cam-type deformities than in hips without cam-type deformities (95% CI, 0.38–0.93, p value < 46
0.001). 47
Conclusions: Mechanical stress in the antero-superior acetabular area is elevated in hips with a
cam-48
type deformity. The study supports the concept that cam-type deformity induced stress leads to 49
hypertrophy of subchondral acetabular bone in the area of impingement. This is collocated with the 50
clinically observed cartilage damage caused by the cam mechanism. 51
INTRODUCTION 52
Osteoarthritis (OA) of the hip is a degenerative joint disease involving the whole joint, but it was 53
defined primarily as a pathological process with focal and progressive hyaline articular cartilage loss. 54
The underlying cancellous bone becomes sclerotic and thickened. Concomitant development of 55
osteophytes is possible and soft-tissue structures in and around the joint are typically affected.1 The
56
aetiology of OA is multifactorial and several components such as age, gender, genetic factors and 57
biomechanical factors have been shown to contribute to its development and progression.2,3 OA is
58
considered secondary if aetiologic factors can be determined, and idiopathic if they cannot.4 Minor
59
developmental deformities of the acetabulum and/or proximal femur can cause a pathological 60
abutment of the femoral neck against the acetabular rim. These mechanisms have been termed 61
femoroacetabular impingement (FAI). In several recent studies FAI was shown to cause hip OA, and 62
many cases of hip OA that previously were classified as idiopathic can now be classified as secondary 63
to FAI.5,6 2 different types of FAI, called “cam-“and “pincer-” impingement, can be distinguished.
64
Cam-FAI is caused by an aspherical extension of the femoral head-neck junction. Pincer-FAI is 65
secondary to local or general over-coverage of the acetabulum. The 2 types of FAI are often 66
combined.7 The cam-FAI is more important because it leads to early and more extensive acetabular
67
cartilage damage,7 and chondral damage of the acetabulum is generally observed at surgery even
68
when the articular cartilage of the femur is unchanged.8,9 Cam deformities are frequent. In a recent
69
magnetic resonance imaging (MRI) study a cam deformity was present in a quarter of young 70
asymptomatic patients.10
71
In clinical practice sclerosis of the subchondral bone at the acetabular rim in the presence of cam-FAI 72
is observed, occasionally combined with a decrease in articular cartilage thickness. Recently, a study 73
explored bone mineral density around the acetabulum and showed increased subchondral bone 74
mineral density in a small group of patients with cam impingement.11
75
We hypothesised that the thickness of the subchondral acetabular bone correlates with the size of 76
the cam deformity. 77
MATERIALS AND METHODS 78
244 asymptomatic Sumiswald Swiss army recruits underwent hip MRI. The presence of a cam 79
deformity and relationship to the thickness, area and shape of the subchondral bone was measured. 80
The Sumiswald Cohort is a population-based cohort of consecutive young males being conscripted 81
into the Swiss army at a single recruitment centre in Sumiswald, Switzerland.10 Data from the
82
Sumiswald Cohort have already been previously published.12,13 The study was approved by the
83
Research Ethics Committee of the Canton of Bern. All of the participants provided informed consent 84
prior to data collection. 85
86
Magnetic resonance imaging (MRI) and cam-deformity grading 87
MRI studies used a flexible surface coil with high spatial resolution protocol, and were performed 88
with a 1.5 Tesla high-field system (Magnetom Avanto, Siemens, Erlangen, Germany). Scans were 89
performed with subjects supine with the hip joints in a neutral rotation. Radial proton-density-90
weighted sequences were acquired with all slices oriented parallel to the femoral neck axis, which 91
was used as the axis of rotation. Sequences were performed using a sagittal oblique localiser, which 92
was marked on the proton density-weighted coronal sequence and which ran parallel to the sagittal 93
oblique course of the acetabulum.13 For the turbo-spin-echo (TSE) pulse sequence, images were 94
obtained with a time to recovery of 2000 msec, time to echo (TE) of 15 msec, field of view of 260 × 95
260 mm, matrix of 266 × 512 and slice thickness of 4 mm. The acquisition time to complete a set of 96
16 slices was 4 min 43 sec. The resulting voxel size was 0.98 × 0.51 × 4 mm. In addition, we used a 97
transverse T1- weighted sequence (field of view (FOV) 200 × 200 mm, slice thickness 4 mm, 98
repetition time (TR) 650 ms, time of echo (TE) 20 ms); transverse fast low-angle shot sequence (FOV 99
120 × 120 mm, section thickness 2 mm, TR 650 ms, TE 20 ms, flip angle 90°); sagittal trueFISP 3D 100
sequence (FOV 130 × 130 mm, section thickness 1.5 mm, TR 8.87 ms, TE 3.23 ms, flip angle 28°); 101
sagittal inversion recovery sequence (FOV 180 × 180 mm, section thickness 3 mm, TR 4800 ms, TE 32 102
ms, time of inversion 160 ms); and coronal true FISP 3D sequence (FOV 180 × 180 mm, section 103
thickness 1.5 mm, TR 8.16 ms, TE 2.89 ms, flip angle 28°). Neither intraarticular nor intravenous 104
contrast was injected for ethical reasons. 105
To determine the presence of cam-type deformities, the maximal offset at the head-neck junction 106
on the radial sequences was graded using a semi-quantitative scoring system, in which grades 107
ranged from 0 to 3: 0 = normal, no evidence of cam deformity on any sequence; 1 = possible 108
deformity with cortical irregularity and a small decrease of anterior head-neck offset; 2 = definite 109
cam deformity with an established decrease of anterior headneck offset (cam deformity of less than 110
10 mm); 3 = severe deformity with a large decrease in the anterior head-neck offset (cam-type 111
deformity of more than 10 mm).10 This grading was already used in previous studies on this study
112
cohort.12,13
113 114
Quantification of subchondral sclerosis 115
Previous work has shown the good accuracy of measurements of bone structures on MRI.14–17 We
116
used a clock face system to specify radial planes. The 6 o’clock position was taken as the plane in the 117
middle of the tear drop figure and 12 o’clock opposite of the hip centre. 8 radial planes of the 118
anterior-superior area were analysed, starting with the plane directly posterior to that at the 12 119
o’clock position. 120
As a starting point for all the measurements, a circle was drawn from the centre of the femoral head 121
The circle was centred using the subchondral black line of the femoral head and enlarged until it 122
reached the subchondral sclerosis of the acetabulum. This circle (ra) was recorded and used as base 123
for further measurements. The circle was enlarged until it reached the peripheral border of the 124
subchondral sclerosis and the radius (rb) was measured. If subchondral bone extended into the 125
cartilage, the circle was placed at the central border of the sclerosis and the radius (rc) was 126
recorded. 127
In a 2nd step, the angle of the length of the sclerosis was 128
measured (Figure 1). The thickness of the sclerosis was calculated based on the difference between 129
the circle with radius ra and the radius rb of the circle extending to the end of the sclerosis within 130
the bone and/or (depending on which possibility was present) the radius rc of the circle touching the 131
beginning of the sclerosis within the cartilage (Figure 2(A) and (B)). The difference between the 132
circles’ radii defined the thickness of the sclerosis within the bone and the thickness of the 133
decreased cartilage. The sum of these 2 values defined the entire thickness of the sclerosis. Beside 134
the length and the thickness of the sclerosis, also its area was measured. Finally, the shape of the 135
sclerosis was qualitatively evaluated as shown in Figure 3 (Figure 3(A–G)). 136
137
Statistical analysis 138
Measurements of subchondral sclerosis were assessed on each plane and were aggregated taking 139
the maximal value per participant. Univariate linear regression was used to determine associations 140
between the presence of cam-type deformities and different measurements of sclerosis, with results 141
expressed as differences, including a 95% confidence interval (CI) and a corresponding p value. 142
A mixed-effects multinomial logistic model accounting for the correlation of data within subjects was 143
used to determine associations between cam deformity and dimensions of subchondral sclerosis as 144
measured in each plane. Associations are expressed as odds ratios, including a 95% CI and a 145
corresponding p value. The category ‘no visible shape of sclerosis was taken as reference. All 146
analyses were performed using Stata 14 (Stata Corporation, College Station, Texas). 147
Since this was not a diagnostic study only intra-rater variability was examined using the Pearson 148 correlation coefficient. 149 150 RESULTS 151
All participants were recruited between March and July 2005. A flow chart of subject progression 152
through the study is shown in Figure 4. The mean age of participants undergoing MRI was 19.9 years 153
(standard deviation [SD] ± 0.7), while the mean body mass index was 23.1 kg/m2 (SD ± 3.7). In 113 154
cases (46%) the left hip was imaged. 155
67 of the 244 hips had a definite cam deformity with an overall adjusted prevalence of 24% (95% CI 156
19–30%).14 The mean ± SD alpha angle for grade 0 deformities was 44.8° ± 8.4°, for grade 1
157
deformities 48.4° ± 10.1°, for grade 2 deformities 57.7° ± 12.7°, and grade 3 deformities 76.4° ± 9.7° 158
(p value = 0.001 for trend). Table 1 shows how the MRI features of the study subjects compared to 159
non-attenders and controls. 160
Hips with a cam deformity showed increased thickness and length of the subchondral sclerosis. The 161
BC-angle, representing sclerosis’ angular length, was 1.51° higher in subjects with compared to 162
subjects without a cam-type deformity (95% CI, –1.03–4.06, p = 0.242). The mean thickness of 163
sclerosis within bone was 3.25 mm (95% CI, 3.02–3.48) in the acetabulae of hips with a cam-type 164
deformity and 2.59 mm (95% CI, 2.45–2.73) in those without (difference 0.66, 95% CI, 0.38–0.93, p 165
<0.001). In hips without a cam deformity the mean area of sclerosis was 21.69 mm2 (95% CI, 20.02– 166
23.36), while in hips with a cam-type deformity the area increased by 5.05 mm2 (95% CI, 1.86–8.24, 167
p = 0.002) to a mean of 26.74 mm2 (95% CI, 24.02–29.45). 168
In cases where the sclerosis involved the cartilage, hips without cam-type impingement 169
demonstrated cartilaginous penetration that was 0.13 mm deeper (95% CI,–0.02–0.27, p = 0.081) 170
(Table 2). 171
4 shapes were significantly associated with cam-type deformity (Table 3). The odds of a triangular 172
shape instead of no visible sclerosis on a given plane were 3.56 times higher (95% CI, 2.17–5.82, p < 173
0.001) if a cam-type deformity was present. The odds of a hook-shaped sclerosis were 2.73 (95% CI, 174
1.26–5.92, p = 0.011) times higher, while the odds of a linear shape were 2.25 (95% CI, 1.29–3.90, p 175
= 0.004) higher and the odds of an irregular-shape were 3.28 (95% CI, 2.01–5.35, p < 0.001) higher in 176
subjects with cam-type deformity. 177
The intraclass correlation coefficient (ICC) for intra-rater variability for the different parameters was 178
excellent (Table 4). 179
DISCUSSION 180
This cross-sectional study of 244 asymptomatic Swiss Army recruits shows a strong correlation 181
between subchondral bone hypertrophy at the acetabular rim and the presence of cam-type 182
deformity. The antero-superior area was particularly affected and is where cartilaginous damage in 183
cam impingement is generally found in contrast to the circumferential damage in pincer 184
impingement.7,18
185
The dimensions of subchondral sclerosis differed between hips depending on the presence of cam 186
deformity. The thickness of sclerosis was significantly greater in hips with cam deformities 187
(difference 0.66 mm, p value < 0.001). If the hypertrophy involved the cartilage, there was a small 188
insignificant difference between hips with and those without cam-type deformities, with hips with 189
cam-type deformity showing less hypertrophy. The mean area of sclerosis was also significantly 190
greater in the presence of cam-type deformity (p value = 0.002). Triangular, irregular, linear and 191
hook-shaped sclerosis was significantly associated with a cam-type deformity. 192
The mean thickness of subchondral sclerosis in hips without cam-type deformity was 3.03 mm (95% 193
CI, 2.88–3.19) and represents the normal thickness of subchondral bone. This is the 1st study to 194
standardise values for subchondral bone in a young male population. This is important in future 195
research evaluating MR images. Our study is also the 1st to define the impact of cam impingement 196
on the thickness, volume and shape of subchondral sclerosis of the antero-superior acetabulum. A 197
computed tomography (CT) study on a small group of patients by Speirs et al.11 showed that subjects
198
with cam FAI have an increased bone mineral density in the antero- superior acetabulum. This might 199
be explained by the increased load transfer caused by the cam FAI and is corroborated by finite 200
element studies.19,20
201
In hip dysplasia the reduced contact area and hence static concentration of stresses at the 202
acetabular rim leads to increased sclerosis of the subchondral bone.21 In contrast, cam impingement
203
causes high shear stresses within the cartilage and adjoining subchondral bone via a dynamic, 204
attritional mechanism.19,20 Chegini et al.19 showed that stresses within the labrum and acetabular
205
cartilage depend highly on the geometry of the bony anatomy. 206
When FAI was purported to cause OA in young subjects, the primary source leading to the 207
development of OA was believed to be shear forces at the tidemark between cartilage and 208
subchondral bone, which then led to maceration and eventually to flap formation with subsequent 209
destruction of the cartilage.7 The location of the cartilage damage in cam FAI collocates with the
210
location of subchondral hypertrophy in this study.7,18
211
The cause of subchondral bone hypertrophy and its role in the development of OA has been 212
debated: Radin et al.22 observed a correlation between OA and thickening of subchondral bone
213
inferring that loss of elasticity leads to elevation of cartilaginous stress and subsequently to 214
degeneration. This hypothesis has been supported by various studies.23–25 Conversely Burr et al.26
215
suggested that mechanical overload initiates micro damage of subchondral bone which triggers a 216
biological response at the tidemark by a reactivation of the secondary centre of ossification and 217
hence enchondral ossification. This leads to thickening of the mineralised tissues and thinning of the 218
overlying hyaline articular cartilage. As described previously, this hypertrophy can be considered to 219
be a reaction to stress and is an effect rather than a cause of cartilage degeneration. Because the 220
concept of FAI explains the direct mechanical damage of the joint cartilage by the cam deformity, it 221
is less likely that cartilage damage occurs secondarily to stiffening of the hypertrophic subchondral 222
bone. However, the subchondral hypertrophy induced by the stresses caused by the cam mechanism 223
probably adds to the cartilage stress and damage secondarily as shown by Wei et al.27
224
It remains unclear why hypertrophy in hips with cam deformities extends less into the cartilage than 225
in those without. We would expect more thickening in cam-type deformities as the stress is 226
augmented. However, morphologic development of articular cartilage is influenced by biologic 227
adaption to functional demands.28 It was shown that advancement of the subchondral ossification
228
front towards the joint surface is inhibited by intermittent hydrostatic pressure.29 This may explain
why increased stress inhibits advancement of the tidemark and ossification of the uncalcified 230
cartilage layer. 231
Our study can be criticised as only young males were examined. The study group is a reasonable size 232
but is a very narrow proportion of the population and is only young males with a normal BMI. 233
Although these recruits are conscripted they still represent a narrow cohort. A further limitation is 234
that while the shape of the femur was assessed and classified, that of the acetabulum was not. The 235
definitions of acetabular cover and depth are based on standard radiographs and it is very difficult to 236
assess the shape of the acetabulum on MRI. In acetabular over-coverage the cam mechanism has 237
the same mechanical effect and would not influence our findings. Because of the decreased weight-238
bearing area in acetabular dysplasia, hypertrophy of the subchondral bone can be observed.21
239
However, dysplastic hips rarely present with a cam deformity and would have been classified into 240
the normal group, leading to an overestimation of subchondral sclerosis in this group. 241
Only 57% of our cohort consented for MRI. However, the analysis of the characteristics of 242
participants and nonparticipants did not show significant differences (Table 1). Compared to studies 243
with older individuals, the young age of participants makes it less likely that the osseous alterations 244
are caused by factors such as age, or osteoarthrosis. Nevertheless, long-term studies and 245
examination of children are required as it is still impossible to distinguish between developmental 246
disorders and alterations purely resulting from cam-type deformities. 247
A last limitation of this study is the difficulty in 248
clearly defining and demarcating the measured hypertrophy. Interfering factors such as published 249
recently,12 normal developmental differences and the angular intersection through the acetabular
250
and supraacteabular fossa, made a clear differentiation of the hypertrophy sometimes difficult. 251
However, the accuracy, reliability, inter-rater and intra-rater reliability of subchondral bone and 252
cartilage thickness measurement from MRI were shown to be excellent.14–17
DECLARATION OF CONFLICTING INTERESTS 254
The author(s) declared the following potential conflicts of interest with respect to the research, 255
authorship, and/or publication of this article: PJ: serves as unpaid member of the steering group of 256
trials funded by Astra Zeneca, Biotronik, Biosensors, St. Jude Medical, and The Medicines Company. 257
All other authors declare that there is no conflict of interest 258
259
FUNDING 260
The author(s) disclosed receipt of the following financial support for the research, authorship and/or 261
publication of this article: The study was supported by the Swiss National Science Foundation 262
(National Research Program 53 on Musculoskeletal Health grant 405340-104778) 263
REFERENCES 264
1. Kumar V, Abbas AK, Fausto N, et al. Joint, osteoarthritis. In: Schmitt W (ed.) Robbins basic 265
pathology. Philadelphia: Saunders, 2007, pp.818–820. 266
2. Harris WH. Etiology of osteoarthritis of the hip. Clin Orthop Relat Res 1986; 213: 20–33. 267
3. Busija L, Bridgett L, Williams SR, et al. Osteoarthritis. Best Pract Res Clin Rheumatol 2010; 268
24: 757–768. 269
4. Flores R. Definition and classification of osteoarthritis. Oxford: Oxford University Press, 270
2003. 271
5. Ganz R, Parvizi J, Beck M, et al. Femoroacetabular impingement: a cause for osteoarthritis of 272
the hip. Clin Orthop Relat Res 2003; 417: 112–120. 273
6. Ganz R, Leunig M, Leunig-Ganz K, et al. The etiology of osteoarthritis of the hip: an 274
integrated mechanical concept. Clin Orthop Relat Res 2008; 466: 264–272. 275
7. Beck M, Kalhor M, Leunig M, et al. Hip morphology influences the pattern of damage to the 276
acetabular cartilage: femoroacetabular impingement as a cause of early osteoarthritis of the 277
hip. J Bone Joint Surg Br 2005; 87:1012–1018. 278
8. Leunig M, Beck M, Dora C, et al. Femoroacetabular impingement: trigger for the 279
development of coxarthrosis. Der Orthopade 2006; 35: 77–84. 280
9. Beck M, Leunig M, Parvizi J, et al. Anterior femoroacetabular impingement Part II. Midterm 281
results of surgical treatment. Clin Orthop Relat Res 2004; 418: 67–73. 282
10. Reichenbach S, Juni P, Werlen S, et al. Prevalence of camtype deformity on hip magnetic 283
resonance imaging in young males: a cross-sectional study. Arthritis Care Res (Hoboken) 284
2010; 62: 1319–1327. 285
11. Speirs AD, Beaulé PE, Rakhra KS, et al. Increased acetabular subchondral bone density is 286
associated with cam-type femoroacetabular impingement. Osteoarthritis Cartilage 2013; 21: 287
551–558. 288
12. Reichenbach S, Leunig M, Werlen S, et al. Association between cam-type deformities and 289
magnetic resonance imaging-detected structural hip damage: a cross-sectional study in 290
young men. Arthritis Rheum 2011; 63: 4023–4030. 291
13. Leunig M, Jüni P, Werlen S, et al. Prevalence of cam and pincer-type deformities on hip MRI 292
in an asymptomatic young Swiss female population: a cross-sectional study. Osteoarthritis 293
Cartilage 2013; 21: 544–550. 294
14. Manske SL, Kontulainen S, Liu D, et al. Accuracy and reliability of MRI to measure human 295
bone geometry. Paper presented at 5th Combined Meeting of the Orthopaedic Research 296
Societies of Canada, USA, Japan and Europe, Banff, Alberta, Canada, October 10–14, 2004. 297
15. Manske SL, Liu-Ambrose T, de Bakker PM, et al. Femoral neck cortical geometry measured 298
with magnetic resonance imaging is associated with proximal femur strength. Osteoporos 299
Int 2006; 17: 1539–1545. 300
16. McGibbon CA. Inter-rater and intra-rater reliability of subchondral bone and cartilage 301
thickness measurement from MRI. Magn Reson Imaging 2003; 21: 707–714. 302
17. Woodhead HJ, Kemp AF, Blimkie CJ, et al. Measurement of midfemoral shaft geometry: 303
repeatability and accuracy using magnetic resonance imaging and dual-energy X-ray 304
absorptiometry. J Bone Miner Res 2001; 16: 2251–2259. 305
18. Tannast M, Goricki D, Beck M, et al. Hip damage occurs at the zone of femoroacetabular 306
impingement. Clin Orthop Relat Res 2008; 466: 273–280. 307
19. Chegini S, Beck M and Ferguson SJ. The effects of impingement and dysplasia on stress 308
distributions in the hip joint during sitting and walking: a finite element analysis. J Orthop 309
Res 2009; 27: 195–201. 310
20. Speirs AD, Beaulé PE, Ferguson SJ, et al. Stress distribution and consolidation in cartilage 311
constituents is influenced by cyclic loading and osteoarthritic degeneration. J Biomech 2014; 312
47: 2348–2353. 313
21. Pauwels F. Biomechanics of the locomotor apparatus: Contributions on the functional 314
anatomy of the locomotor apparatus. New York: Springer-Verlag, 1980. 315
22. Radin EL, Burr DB, Caterson B, et al. Mechanical determinants of osteoarthrosis. Semin 316
Arthritis Rheum 1991; 21:12–21. 317
23. Boyce TM, Fyhrie DP, Glotkowski MC, et al. Damage type and strain mode associations in 318
human compact bone bending fatigue. J Orthop Res 1998; 16: 322–329. 319
24. Brown TD, Radin EL, Martin RB, et al. Finite element studies of some juxtarticular stress 320
changes due to localized subchondral stiffening. J Biomech 1984; 17: 11–24. 321
25. Radin EL, Parker HG, Pugh JW, et al. Response of joints to impact loading. 3. Relationship 322
between trabecular microfractures and cartilage degeneration. J Biomech 1973; 6:51–57. 323
26. Burr DB and Radin EL. Microfractures and microcracks in subchondral bone: are they 324
relevant to osteoarthrosis? Rheum Dis Clin North Am 2003; 29: 675–685. 325
27. Wei HW, Sun SS, Jao SH, et al. The influence of mechanical properties of subchondral plate, 326
femoral head and neck on dynamic stress distribution of the articular cartilage. Med Eng 327
Phys 2005; 27: 295–304. 328
28. O’Connor KM. Unweighting accelerates tidemark advancement in articular cartilage at the 329
knee joint of rats. J Bone Miner Res 1997; 12: 580–589. 330
29. Carter DR and Wong M. Modelling cartilage mechanobiology. Philos Trans R Soc Lond B Biol 331
Sci 2003; 358: 1461–1471. 332
TABLES 334
Table 1: Comparison of attenders of MRI examination with non-attenders and non-invited
335
individuals. 336
BMI, body mass index; §WOMAC, Western Ontario and McMaster University Osteoarthritis Index 337
standardised to range from 0 to 10; §§ EuroQol, 338
European Quality of Life standardised to range from 0 to 10; MRI, magnetic resonance imaging. 339
Note: All data are reported as mean ± standard deviation. #p values for the comparison between the 340
3 groups derived from one-way ANOVA. 341
Adapted from Reichenbach et al.14
342
343 344
Table 2: Comparison of measurements in hips with and without cam-type deformity. 345
CI, confidence interval. 346
*For all values the maximum of any plane per patient was used for the analysis, therefore the values 347
may not necessarily add up. 348
349 350 351
Table 3: Comparison of shapes of sclerosis in hips with and without cam-type deformity.
352
353 354 355
Table 4: Intra-rater ICC for the different parameters.
356
FIGURES 358
Figure 1: Segment with subchondral sclerosis/length (B) represents the border of the osseous
359
acetabulum without labrum and (C) the end of the subchondral sclerosis along the circle with Radius 360
ra. Angle (0) is the angle between BC, defined by the arms B-hc and hc-C. 361
362 363
Figure 2: Thickness of the subchondral sclerosis
364
Example when the sclerosis located at the expense of cartilage and within the bone. The circle with 365
radius ra is placed on the subchondral bone. From there the circle is shrunk until it reaches the 366
beginning of the sclerosis in the subchondral bone, resulting in a circle with radius rc. Then the circle 367
ra is enlarged until it reaches just the end of the sclerosis in the acetabular bone (radius rb). The 368
difference between ra and rb or/and rc results in the thickness of the subchondral sclerosis. 369
370 371
Figure 3: Shape of subchondral sclerosis. 372
(A) Boomerang: 2 wings are divided from the angle near the labrum (B) linear/homogeneous: the 373
hypertrophy shows over the whole length l the same thickness (C) lenticular: the shape of the 374
sclerosis an ellipse (D) hook-shaped: an external part of the sclerosis protrudes or even overhangs 375
toward the surface of the cartilage (E) triangular: the sclerosis has the shape of a triangle (F) 376
irregular: the shape of the sclerosis cannot be classified into 1 of the described shapes A–E or G (G) 377
semicircular: the shape of the sclerosis semicircular. 378
379 380
Figure 4: Study flow chart. Adapted from Reichenbach et al.10
381