LINEAR-ALGEBRAIC
GRAPH MINING
Geoffrey Sanders, CASC/LLNL
New Applications of Computer Analysis to Biomedical Data Sets
QB3 Seminar, UCSF Medical School, May 28
th
, 2015
Lawrence Livermore National Laboratory, P. O. Box 808, Livermore, CA 94551
!
This work performed under the auspices of the U.S. Department of Energy by
Lawrence Livermore National Laboratory under Contract DE-AC52-07NA27344
LLNL and LDRD
•
LLNL is a DOE FFRDC
•
Center for Applied Scientific Computing (CASC)
•
Several of us work on Laboratory Directed Research and
Development (LDRD) projects in HPC and Data Analysis
•
Graph Analytics, Machine Learning, Network Analysis
•
We are ALWAYS looking for domain scientist collaborators
with
interesting datasets
or
new data mining tasks
•
DOE national labs have a history of building open HPC
software for PDE-related applications (Physic Simulation)
•
PETSc [H2], Trilinos [H4], Hypre [H3], Samrai [H1], etc.
Outline
1.
Introduction
2.
Analytics that Rank
3.
Analytics that Cluster
4.
Analytics that Approximate
Expensive Calculations
Graph Model Definitions
•
Graph G(V,E)
•
Vertices
i
,
j
in V
•
Edges (
i,j
) in E
•
Edge weights
•
Hypergraphs
•
(
i,j,k,l
) and (
p,q,r
) in E
•
Undirected vs Directed?
•
(
i,j
) and (
j,i
)
•
Attributes?
•
Vertex Labels
•
Height, Gender, Profession
•
Edge Labels
•
Timestamp, volume
i
Difficult Topologies
•
Scale-Free
•
Small-World
•
Community Structure
•
Hierarchical
•
Overlapping
•
Heterogeneous in size,
density, type, etc
•
Other Structure
Web Data Commons Hyperlink Graph
•
Crawled in 2014, directed [D1]
Spy Plot
•
Graphs have
natural sparse
matrix
representations
•
Linear algebra
applies
vertices
ve
rt
ice
s
Linear-Algebraic Kernels
•
Linear Solve
•
Matrix Factorization
•
Eigensolve
•
Tensor Factorization[T1]
=
L
x
b
L
x
=
λ
x
≈
L
F
G
t
A
≈
k
=
1
r
∑
u
k
v
k
w
k
Outline
1.
Introduction
2.
Analytics that Rank
3.
Analytics that Cluster
4.
Analytics that Approximate
Expensive Calculations
Ranking Calculations
•
Global Ranking?
•
Ordered list
•
Often only care about
top few of the list
•
Personalized PR [R2]
•
Supervised
•
PageRank [R1]
•
Centrality measure
•
Random walk
•
Connection Subgraph
[R3]
•
Solve for direction
•
Rank vertices
1
Exotic Ranking Calculations
•
My brother gets
•
My score
•
Worse than a buoy
Outline
1.
Introduction
2.
Analytics that Rank
3.
Analytics that Cluster
4.
Analytics that Approximate
Expensive Calculations
•
Spectral Clustering [O1,C4]
•
Recursive Bipartite SC
Clustering
•
Unsupervised?
•
Hard or Soft?
•
Agglomerative [C1]
•
Start with
n
groups
•
Make local grouping decisions
to maximize
Modularity:
ordered randomly
sign(v).*(log10(|v|+ε)+min{log10(|v|+ε)})
ordered by Fiedler vector
O R I G I N A L V E R T E X S E T
Reason split:
vector splitting
:
connected components:
Reason stopped:
minimum cluster size max clusters
cc 0
vec 1
cc 2
vec 3
Cc 4
0
1
2
3
4
5
6
7
8
9
10
1
1
12
13
!
"
#
#
$
%
&
&
comms
∑
−
!
"
#
#
$
%
&
&
Internal
edges
Expected
internal
edges
2 HAIFENG XU, HANS DE STERCK AND GEOFFREY SANDERS
3"
Feature'Matrix'F' Weighted'Bipar1te'Graph'A"
C"
B"
2"
6" 8" 10" 8"1"
3"
2"
A" B" C" D
D"
1"
9" 6" 1" 1"Figure 1. Feature matrixFand induced weighted bipartite graph. Red dots correspond to row variables of
F, and blue dots to column variables. The rows and columns may, e.g., represent LinkedIn users and skills, with the weights indicating how often a user’s skill was endorsed by the user’s connections. research groups, etc. These hierarchical structures are overlapping; for example, some professors may be active in multiple departments or faculties, and many skills (often even the more specialized ones) are taught in multiple degree programs. In a similar way, it is to be expected that many of the currently emerging online social networks also contain inherent overlapping hierarchical organization, in particular when they focus on a specific dimension of the human condition, like, e.g., the professional dimension. Consider for example the LinkedIn social network, where users connect to their business relations and acquaintances, and list user-defined ‘skills and expertise’ on their user profiles that can be endorsed by their connections. Similar to the case of universities, it is clear that in a social network like LinkedIn there must be hierarchical overlapping groups of users with similar skills and professions, and hierarchical overlapping groups of skill keywords that characterize professional groups.
Figure 2. Bipartite graph hierarchy obtained by the FMCC algorithms. The input feature matrix is located at the bottom of the diagram.
However, in contrast to the example of universities, in emerging social networks this hierarchy is not ‘hard-coded’ into the structure of the network; if it were, it would seriously impede the growth and dynamical evolution of these networks. Since the hierarchy is not explicitly hard-coded into the structure of the network but is nevertheless present, it is at once a very interesting and a challenging problem to try to automatically generate a representation of this hierarchy from the
Copyright c 2015 John Wiley & Sons, Ltd. Numer. Linear Algebra Appl.(2015)
Prepared usingnlaauth.cls DOI: 10.1002/nla
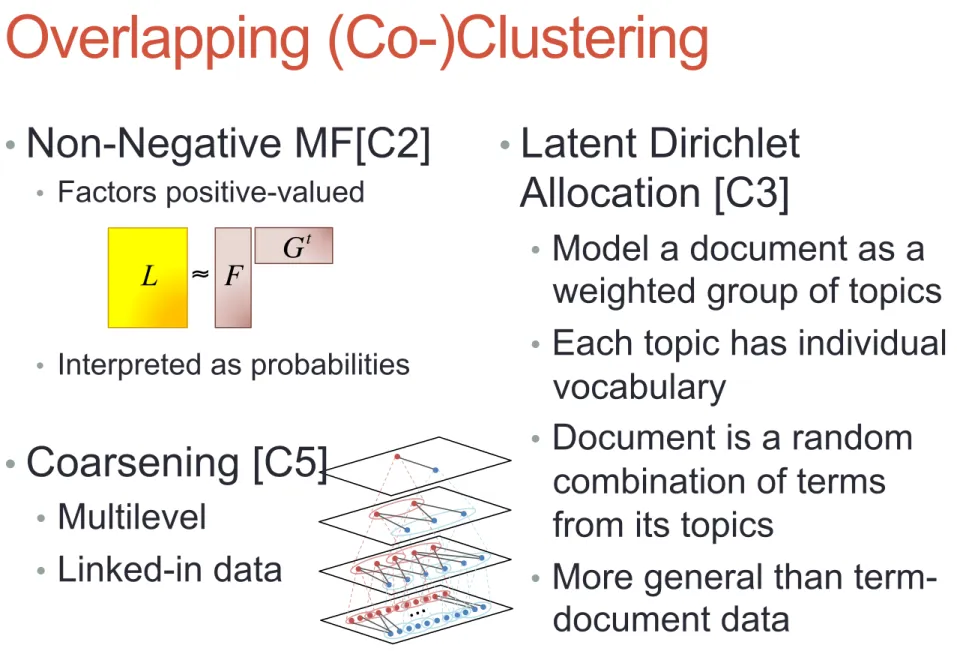
Overlapping (Co-)Clustering
•
Non-Negative MF[C2]
•
Factors positive-valued
•
Interpreted as probabilities
•
Coarsening [C5]
•
Multilevel
•
Linked-in data
•
Latent Dirichlet
Allocation [C3]
•
Model a document as a
weighted group of topics
•
Each topic has individual
vocabulary
•
Document is a random
combination of terms
from its topics
•
More general than term-
document data
≈
L
F
G
Outline
1.
Introduction
2.
Analytics that Rank
3.
Analytics that Cluster
4.
Analytics that Approximate
Expensive Calculations
Approximations to Expensive Calcs
•
Triangle Counting[O3]
•
Diagonal of
A
3
is 6 x (# triangles)
•
Estimate diagonal entries of
A
3
•
Trace(
A
3
) = sum [ eigenvalues(
A
)
3
]
•
Nearly-planar
coloring[O2]
•
Mincut [O1]
•
Maxcut [O4]
Outline
1.
Introduction
2.
Analytics that Rank
3.
Analytics that Cluster
4.
Analytics that Approximate
Expensive Calculations
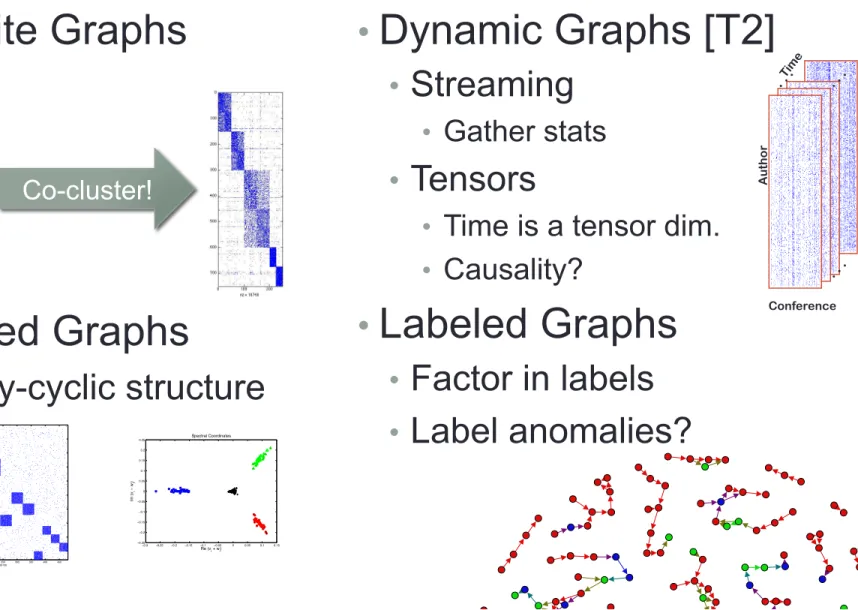
•
Bipartite Graphs
•
Directed Graphs
•
Highly-cyclic structure
Figure 12: Matrix sparsity structure for example 3 under the reordering given by the Fiedler vector (left) and associated ordering in of row and column variables (right). The purple line in the figure on the right shows the one-dimensional search space for row and column splittings considered by the out-of-box undirected method.
Figure 13: Original graph from example 4 (left), randomly reordered (middle), and bipartized (right).
15 Figure 12: Matrix sparsity structure for example 3 under the reordering given by the Fiedler vector
(left) and associated ordering in of row and column variables (right). The purple line in the figure on the right shows the one-dimensional search space for row and column splittings considered by the out-of-box undirected method.
Figure 13: Original graph from example 4 (left), randomly reordered (middle), and bipartized (right). 15
Important Extensions
•
Dynamic Graphs [T2]
•
Streaming
•
Gather stats
•
Tensors
•
Time is a tensor dim.
•
Causality?
•
Labeled Graphs
•
Factor in labels
•
Label anomalies?
"
"
"
A
uthor
Conference
Co-cluster!
whereM[ADD THE NECESSARY CONSTRAINTS TO M]. Then, the eigenpairs ofB( o,x)and
( o,x)can be used to define a mapping intoR2such that the nodes are mapped to [DETERMINE
PARAMETERS OF REGION] around vectors of length 1 at angles of⇡
3,⇡or53⇡. 0 50 100 150 200 250 300 350 400 450 0 50 100 150 200 250 300 350 400 450 nz = 26130 −1 −0.8 −0.6 −0.4 −0.2 0 0.2 0.4 0.6 0.8 1 −1 −0.8 −0.6 −0.4 −0.2 0 0.2 0.4 0.6 0.8 1 Spectrum of D−1 A Re Im Figure 2: . −0.3 −0.25 −0.2 −0.15 −0.1 −0.05 0 0.05 0.1 0.15 −0.25 −0.2 −0.15 −0.1 −0.05 0 0.05 0.1 0.15 0.2 0.25 Spectral Coordinates Re (v i + wi) Im (v i − wi ) −0.25 −0.2 −0.15 −0.1 −0.05 0 0.05 0.1 0.15 0.2 0.25 −0.25 −0.2 −0.15 −0.1 −0.05 0 0.05 0.1 0.15 0.2 0.25 Spectral Coordinates Re (vi + wi) Im (v i − wi ) Figure 3: .
4
General
c
-cyclic structure
Forp= 0, ..., c 1,✓p,c2 (Cc). Entries of the eigenvectorCv=✓p,cvarevi=✓ip,c.
Bc=B⌦Cc
5
Numerical Approximation
xk+1=f(B)xk
9
whereM[ADD THE NECESSARY CONSTRAINTS TO M]. Then, the eigenpairs ofB(o,x)and
(o,x)can be used to define a mapping intoR2such that the nodes are mapped to [DETERMINE PARAMETERS OF REGION] around vectors of length 1 at angles of⇡
3,⇡or53⇡. 0 50 100 150 200 250 300 350 400 450 0 50 100 150 200 250 300 350 400 450 nz = 26130 −1 −0.8−0.6−0.4−0.2 0 0.2 0.4 0.6 0.8 1 −1 −0.8 −0.6 −0.4 −0.2 0 0.2 0.4 0.6 0.8 1 Spectrum of D−1 A Re Im Figure 2: . −0.3 −0.25 −0.2 −0.15 −0.1 −0.05 0 0.05 0.1 0.15 −0.25 −0.2 −0.15 −0.1 −0.05 0 0.05 0.1 0.15 0.2 0.25 Spectral Coordinates Re (vi + wi) Im (v i − wi ) −0.25 −0.2−0.15−0.1−0.05 0 0.05 0.1 0.15 0.2 0.25 −0.25 −0.2 −0.15 −0.1 −0.05 0 0.05 0.1 0.15 0.2 0.25 Spectral Coordinates Re (vi + wi) Im (v i − wi ) Figure 3: .
4 Generalc-cyclic structure
Forp= 0, ..., c 1,✓p,c2 (Cc). Entries of the eigenvectorCv=✓p,cvarevi=✓ip,c.
Bc=B⌦Cc
5 Numerical Approximation
xk+1=f(B)xk