A REVIEW OF BANK PERFORMANCE
IN THE FIFTH DISTRICT, 1982
Ward McCarthy and John Walter
Fifth District Profile
The banking industry in the Fifth Federal Reserve District is characterized by both a moderate concen-tration of assets and a large number of small banks, reflections of the regional and local dimensions of banking in the District. At year-end 1982, there were 670 commercial banks in the District with total assets of approximately $108 billion, or 5 percent of nationwide banking assets. The largest 32 banks, 24 of which held assets of a billion dollars or more, accounted for 66 percent of Fifth District assets. By contrast, the 558 small banks, with average assets of less than $100 million, collectively held 18 percent of the banking assets in the District. Summary data on the size distribution of Fifth District banks are presented in table I.
Table I
SIZE DISTRIBUTION OF FIFTH DISTRICT COMMERCIAL BANKS AT YEAR-END 1982
Average Percent of
A s s e t s1 Number Average
($ millions) of Banks Assets
Less than 10 6 5 1 10-25 170 3 25-50 197 6 50-100 126 8 100-750 8 0 16 Over 750 3 2 6 6 Total 6 7 0 100
1 Average assets are based on fully consolidated volumes out-standing at the beginning and at the end of the year.
The authors acknowledge the considerable assistance of Martha Mangold, Research Department, Federal Re-serve Bank of Richmond, and Frank Fry, Division of Research and Statistics, Board of Governors of the Federal Reserve System, in the construction of the data base.
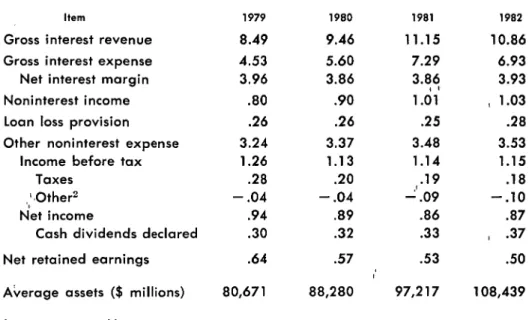
Table II summarizes the major components of income and expense relative to average assets for all commercial banks in the Fifth District for the years 1979 through 1982. The aggregate profitability of Fifth District banks increased marginally in 1982, after declining in both 1980 and 1981. Dollar profits rose more than 12 percent, and the .87 percent earned on average assets was a slight improvement over the .86 percent return for 1981. However, the rate of return on average equity capital increased 56 basis points, or 56/100 of 1 percent, to 13.12 percent, as asset growth exceeded equity growth for the second consecutive year.
In spite of a strong gain of 7 basis points in net interest margins, the pre-tax return on assets in-creased only 1 basis point from a year earlier. Rapid increases in net noninterest expenses and loan loss provisions contributed equally in offsetting most of the improvement in net interest margins. Cash divi-dends grew faster than assets, while the ratio of re-tained earnings to average assets declined 3 basis points. The rate of retained earnings and the rate of internal equity growth also declined. The 11.5 per-cent growth in assets was a 142 basis point increase over the comparable 1981 figure.
Interest Revenue
Gross interest revenue as a percent of average assets declined in 1982, after strong gains in both 1980 and 1981. This reduction in gross interest ratios was due primarily to falling market yields during the third and fourth quarters. As a conse-quence of the pattern of interest rate movements over the year, the ability to generate interest revenue was influenced by the composition of asset portfolios as well as the timing of asset acquisitions. In contrast with the previous two years, when strong gains in interest revenue were associated with a portfolio mix characterized by high yield sensitivity, banks with higher proportions of long-term and fixed-rate assets in their portfolios were likely to experience higher gross interest revenue relative to average assets.
Table II
INCOME AND EXPENSE AS A PERCENT OF AVERAGE ASSETS FIFTH DISTRICT COMMERCIAL BANKS, 1979-1982
Assets acquired in the first half of the year contrib-uted more revenue per dollar invested than did assets acquired in the third and fourth quarters.
Gross interest ratios declined an average of 60 basis points at the large banks, where bank loans and other assets with yields that are sensitive to movements in market interest rates dominate port-folios (see chart 1). However, not all banks were so vulnerable to the change in market conditions, and revenue gains were reported for other bank size categories. Gross interest ratios improved 50 basis points for the small bank group which benefited from average yields that typically adjust more slowly to changes in market conditions.
first and second quarters of 1982 than their counter-parts with declining or unchanged gross, interest ratios.
As indicated in table IV, which presents aggregate data on average yields of selected interest-earning assets, the average return on interest-earning assets declined 50 basis points in 1982. Net loan yields
Chart 1
GROSS INTEREST RATIO*
Percent Percent
As demonstrated in table III, the timing of asset acquisitions and the composition of asset portfolios were important determinants of gross interest ratios for Fifth District banks in 1982. Banks with in-creased gross interest ratios typically had a relatively higher rate of asset growth in the first half of the year when market rates were high, and a slower rate of growth over the second half of the year when market rates declined. These banks also benefited from a large inventory of high yielding long-term and fixed-rate assets, and enhanced their ability to maintain high average yields by acquiring a larger proportion of long-term and fixed-rate assets in the
Table III
CHANGES IN GROSS INTEREST INCOME RATIOS IN RELATION TO ASSET COMPOSITION AND ASSET GROWTH FOR SELECTED1 FIFTH DISTRICT COMMERCIAL BANKS IN 1982
Average Assets ($ millions) Less than 100 Increased ratio Others 100 to 750 Increased ratio Others 750 and over Increased ratio Others All Banks Increased ratio Others N u m b e r of Banks 4 1 8 120 4 9 31 10 2 2 4 7 7 173 Percent of Rate-Insensitive A s s e t s2 7 3 6 4 6 9 61 6 6 5 8 6 9 5 9 Percent
Asset Growth Change in
Interest Q 1 Q 2 Q 3 Q 4 Income Ratio 5.2 4 . 6 6.5 5.6 8.7 - 7 . 4 4.8 5.1 5.3 1.7 8.0 - 4.5 8.9 6.7 3.9 1.6 13.6 - 7.5 6.6 5.6 5.2 1.8 12.7 - 7.0 1
Does not include de novo entrants and merged banks.
2
Rate-insensitive assets include all assets except the following: Balances with depository institutions, federal funds sold and securities purchased under agreements to resell, U.S. and state and local securities with one year or less remaining maturity, loons to financial institutions, loans for purchasing or carrying securities, commercial and industrial loans.
declined 34 basis points in the aggregate. This The return from securities for all Fifth District aggregate figure, however, obscures the markedly banks increased 70 basis points in 1982. The timing different experience of large and small banks. Spe- of purchases during the year was also an important cifically, average net loan yields deteriorated quite determinant of average yields on securities. With rapidly at the large banks, but increased at small market rates relatively high and fluctuating over the banks. One reason for the improvement in loan first two quarters, average yields could be improved yields at small banks is that they were better posi- by rolling over maturing instruments or by expand-tioned to protect the high average yields of the first ing security holdings at yields that were above the two quarters with a relatively large share of fixed- average yield on the existing portfolio. With market rate and long-term loans. The typical small bank in rates declining steadily throughout the third and the Fifth District holds over 75 percent of its loan fourth quarters, however, the opportunity for in-portfolios in consumer and real estate loans. creasing average yields declined accordingly.
Table IV
AVERAGE RATES OF RETURN ON SELECTED INTEREST-EARNING ASSETS FIFTH DISTRICT COMMERCIAL BANKS, 1979-1982
Item 1979 1980 1981 1982
Gross loans 11.25 12.50 14.48 14.14 Net loans 11.37 12.63 14.64 14.30 Total securities 6.43 7.15 8.57 9.27 U. S. Government 8 . 1 4 9.16 11.22 11.79 State and local 5.17 5.56 6.11 6.68 Other 2.88 3.25 4.20 5.82 Total interest-earning assets 10.09 11.28 13.18 12.68
Interest Expense
After increasing in both 1980 and 1981, interest expense as a percent of average assets declined 36 basis points in 1982. This reduction in interest expense ratios reflected the downward movement of market rates over the second half of the year which lowered the average cost of short-term interest-bearing liabilities as much as 433 basis points (see table V). For example, the effective interest paid for large time certificates of deposit (CDs) was 230 basis points lower in 1982 than in 1981. On the other hand, the average cost of liabilities with rela-tively long maturities and fixed interest rates, such as subordinated notes and debentures, did not adjust as rapidly to the change in market conditions, and con-sequently increased slightly. As a result, banks with large shares of rate-sensitive liabilities were most successful in reducing the cost of funds. Interest expense as a percent of assets declined at 78 percent of the banks with over $750 million in assets, and decreased 71 basis points for that group as a whole (see chart 2). On the other hand, interest expense ratios increased 29 basis points for the small bank group.
Banks in all size categories reported an erosion of traditional demand deposits. These deposits declined 4 percent as a share of liabilities and funded only 21 percent of assets in 1982. As demonstrated in chart 3, demand deposits as a proportion of total Fifth
C h a r t 2
INTEREST EXPENSE RATIO*
Percent Percent
1979 1980 1981 1982
*Interest Expense Divided by Average Assets
District liabilities have fallen from over 33 percent to less than 23 percent since 1979. Motivating the shift from demand deposits was the ready avail-ability of interest-bearing alternatives, such as negoti-able orders of withdrawal (NOW), automatic trans-fer service (ATS) and cash management accounts, all of which enabled depositors to economize on non-interest-bearing demand deposits and earn a return on transactions balances.
T a b l e V
AVERAGE COST OF FUNDS FOR SELECTED LlABlLlTlES FIFTH DISTRICT COMMERCIAL BANKS, 1979-1982
Item 1979 1 9 8 0 1981
Time and savings accounts 7.15 8.68 10.63 Large time deposits 9 . 9 6 11.33 14.35 Deposits in foreign offices 10.28 13.17 15.18 Other deposits 6.16 7 . 5 4 9.23 Subordinated notes and
debentures 8.19 8.20 8.11 Federal funds and
repurchase agreements 11.94 13.34 15.54 Other 6.98 8.65 13.49 Total 7.60 9 . 1 3 11.23 E C O N O M I C R E V I E W , J U L Y / A U G U S T 1 9 8 3 1982 9.91 12.05 12.79 9.12 8.34 11.21 11.29 10.10
Chart 3
DEMAND DEPOSITS AS A
PROPORTION OF LIABILITIES
ALL FIFTH DISTRICT BANKS
The share of total liabilities with below-market, fixed-rate ceilings also declined again in 1982, con-tinuing the trend of recent years. As a group,. banks with assets of less than $750 million funded less than half of their total assets with ceiling rate deposits in 1982. However, many of these banks continued to utilize a relatively large share of liabilities with costs that do not adjust rapidly to changes in market con-ditions and, therefore, did not benefit from declining market rates in the second half of the year. In addi-tion, since market yields exceeded interest ceilings on regulated accounts, many of these banks increased the average cost of funds by restructuring liabilities with more market-rate deposits and fewer ceiling rate deposits. Consequently, interest expense grew more rapidly than assets at 78 percent of small- and medium-sized banks.
Net Interest Margins
The average net interest margin, interest income net of interest expense divided by average assets, rose 7 basis points in 1982. Small banks reported the most rapid expansion in net interest margins, while margins also improved for large banks as a group. The timing of asset growth and the composition of assets and liabilities were important determinants of net interest margins in 1982.
Margins at the large banks rose an average of 11
basis points (see chart 4), although nearly half of these banks reported either a decrease or no change in net interest margins from 1981. Because large lenders rely heavily on rate-sensitive assets and lia-bilities, and accumulated a larger proportion of assets in the second half of the year, they realized substan-tial reductions in both the average cost of liabilities and the average yield on portfolios. Large banks with increased margins managed to prevent revenues from falling as fast as expenses.
Over 60 percent of small banks reported expanded net interest margins in 1982, and the average margin for banks in this size category rose 21 basis points. In contrast to the large banks, which improved their margins by preventing revenues from falling as fast as expenses, small banks improved interest margins because interest income grew more rapidly than in-terest expense. Asset growth at small banks was fairly evenly distributed over the year.
Within a given bank size category, the two balance sheet characteristics that were likely to distinguish banks with improved margins from banks with un-changed or depressed margins were ( 1) the relative proportions of rate-sensitive assets and liabilities, and (2) the timing of asset growth within the year. As table VI demonstrates, banks with improved margins typically had larger shares of rate-insensitive assets and rate-sensitive liabilities and, consequently, were able to benefit from the declines in market yields over
Table VI
CHANGES IN NET INTEREST MARGINS IN RELATION TO ASSET AND LIABILITY COMPOSITION AND GROWTH RATES FOR SELECTED1 FIFTH DISTRICT COMMERCIAL BANKS IN 1982
T o t a l Assets ($ millions) Less than 100 increased margin Others 100 to 750 Increased margin Others 750 and over Increased margin Others All banks Increased margin Others 1 S e e f o o t n o t e 1 , t a b l e I I I . 2 S e e f o o t n o t e 2 , t a b l e I I I . Percent of Percent of Number Rate-Insensitive Rate-Sensitive of Banks Assets2 Liabilities3
337 73.63 30.77 5.2 4 . 6 11.6 201 67.64 28.00 5.5 6.8 - 7 . 8 53 68.13 31.74 3.7 3.7 11.5 2 7 60.47 34.90 2.7 11.5 - 7 . 4 17 60.76 42.82 4.1 10.6 7.1 15 59.01 38.80 1.5 14.5 - 8.6 4 0 7 64.10 39.09 4.2 8.5 8.6 243 60.52 36.61 2.3 12.8 - 8.4 Asset Growth Q 1 Q 2 Q 3 Q 4 Percent Change in Net Margin
3 Rate-sensitive liabilities include large time deposits, deposits in foreign offices, federal funds purchased, RPs, MMCs, interest-bearing
demand notes issued to the U. S. Treasury and other liabilities for borrowed money.
the year. Banks with increased net margins also tended to grow relatively faster in the first half of the year. Strong first half growth was especially profitable if high average asset yields were locked in but the average cost of funds adjusted rapidly to the decline in market rates.
Noninterest Revenue and Expenses
The ratio of provisions for loan loss to average assets expanded and accounted for a deterioration of 3 basis points in aggregate profitability. The increase in loan loss provisions as a percent of average assets was slightly larger for banks with over $100 million in assets.
Actual loan losses net of recoveries increased 1 basis point relative to average assets in 1982. The dollar amount of cash recoveries actually decreased by approximately half a percent, while loan charge-offs rose 15 percent.
Increases in noninterest revenue and noninterest expense again outpaced asset growth as they have in recent years. The expansion of noninterest expenses was 3 times the gain in noninterest revenue, and net
noninterest expense reduced the return on assets by 3 basis points. Wages and salaries expanded in excess of 11 percent throughout the District but did not affect aggregate expense ratios significantly. Operating costs such as occupancy expenses acceler-ated even more rapidly than employee expenses, and raised noninterest expense ratios by an average of 8 basis points.
Income from fiduciary activities increased at about the same rate as assets. Service charges on deposits as a fraction of average assets rose 3 basis points, as many banks throughout the District increased their revenue from the explicit pricing of services associ-ated with interest-bearing transactions accounts. The largest banks accounted for a disproportionate share of the gains from service charges and lease financing. Profits and Dividends
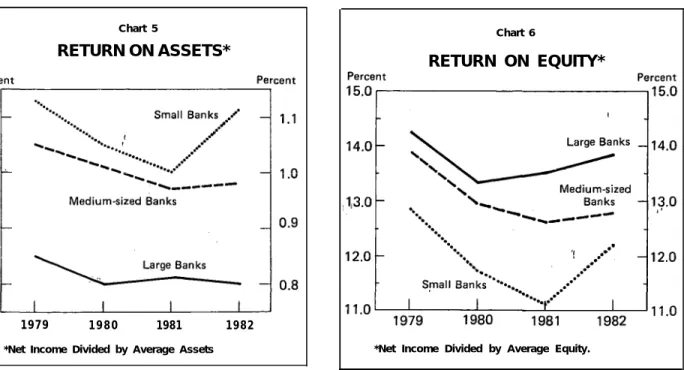
The average return for all Fifth District banks in 1982 rose 1 basis point to .87 percent of assets. A marginal decline in returns for the largest banks was offset by improved profitability at banks in other size categories (see chart 5). For example, the small
Chart 5
RETURN ON ASSETS*
1979 1980 1981 1982
*Net Income Divided by Average Assets
banks reported a sizeable gain of 11 basis points in the ratio of net income to average assets. The aver-age return on equity rose more rapidly than the return on assets (chart 6) due to an increase in leverage.
Cash dividends declared on preferred and common stock grew faster than assets, while retained earnings as a fraction of Fifth District assets declined to .5 percent. At large banks, net profits were divided about equally between dividends and retained earn-ings, as the dividend payout ratio-the ratio of divi-dends to net income-increased to 49 percent in 1982 from 40 percent in 1981. Consequently, retained earnings scaled to average assets were lower in 1982 than in 1981, and the rate of retained earnings de-clined to 51 percent of large bank income. With strong increases in net profit rates, the average small bank was able to increase dividends and raise re-tained earnings to .77 percent of assets and 75 percent of net income.
The increase in equity capital in 1982 was smaller than in 1981, and the 8 percent growth rate of capital failed to keep pace with asset growth. Consequently, the aggregate leverage ratio, defined as average assets divided by average equity, increased by 50 basis points. Increases in leverage were most pronounced at large banks. However, as a group, small banks were able to improve return, on equity and reduce
Chart 6
RETURN ON EQUITY*
*Net Income Divided by Average Equity.
leverage because of a relatively strong return on assets. Table VII demonstrates the relationship between the return on assets, leverage, and the return on equity for all Fifth District banks for the period 1979-1982.
Retained earnings contributed 82 percent of the increase in equity capital in 1982, compared with 74 percent in 1981 (table VIII). However, as demon-strated in table IX, the rate of internal equity growth declined 21 basis points in 1982 due to the sharp decline in the rate of retained earnings. Since 1979, the aggregate rate of internal equity growth has de-clined by an average of 58 basis points per year, while the rate of asset growth has increased each
Table VII
R A T E S O F R E T U R N A N D L E V E R A G E F O R FIFTH DISTRICT COMMERCIAL BANKS1
Year Return on Assets 1979 .94 x 1980 .89 X 1981 .86 X 1982 .87 X Return on Equity 14.37 = 14.35 = 14.56 = 15.06 = 1
The return is net income; assets and equity are averages. Dis-crepancies in calculations are due to rounding error.
T a b l e V I I I
RATE OF RETAINED EARNINGS AND SOURCES OF TOTAL EQUITY CAPITAL FOR FIFTH DISTRICT COMMERCIAL BANKS
Year 1979 1980 1981 1982 (1) Net Income ($000) 758,804 788,145 840,834 944,785 (2) (3) (4) (5) Increase in Net Retained Rate of Increase in Equity Capital
Earnings Retained Equity Capital from Retained ($000) Earnings1 ($000) E a r n i n g s2 517,398 .6819 757,411 .6831 505,872 .6418 573,805 .8814 514,278 .6116 694,273 .7408 538,068 .5695 655,340 .8210 1
The rate of retained earnings is calculated by dividing column (2) by column (1).
2
The increase in equity capital from retained earnings is calculated by dividing column (2) by column (4).
year and has exceeded internal equity growth by an average of 258 basis points per year. This disparity in growth rates is the primary cause of the 69 basis point increase in the aggregate leverage ratio that has occurred in the Fifth District since 1979.
Summary and Conclusions
In 1982 the profitability of commercial banks in the Fifth District improved slightly following reduc-tions in 1980 and 1981. The rate of return on assets rose from .86 to .87 percent and the rate of return on equity rose from 12.56 to 13.12 percent. Because of the sharp decrease in market yields, the posi-tioning of assets and liabilities and the timing of growth were important determinants of profitability. As a group, only small banks reported increased rates
of return on assets and equity as well as reduced leverage ratios. On a district-wide basis, leverage increased while the rate of retained earnings and the rate of internal equity growth declined.
Banks that held relatively more liabilities than assets carrying interest rates that are highly respon-sive to changes in market conditions tended to benefit from the decline in market yields. However, if the pattern of interest rate movements in 1982 had been the opposite-that is, had market yields moved up in the second half of the year-banks with this interest-sensitive asset-liability mix would have been vulner-able to rapidly rising interest expenses and more likely to experience decreased net margins and profit-ability. It should also be noted that the money market deposit account (MMDA), which was intro-duced in December of 1982, has increased the
sensi-T a b l e I X
INTERNAL EQUITY GROWTH RELATIVE TO ASSET GROWTH FOR FIFTH DISTRICT COMMERCIAL BANKS
Rate of Internal
Return on Retained Equity Asset
Y e a r E q u i t y1 E a r n i n g s2 G r o w t h G r o w t h 1979 13.51 x .6819 = 9.21 5.19 1980 12.79 X .6418 = 8.20 9.43 1981 12.56 X .6116 = 7.68 10.12 1982 13.12 X .5695 = 7.47 11.54 1
See footnote 1, table VII.
2
As defined in column (3) of table VIII, the rote of retained earnings is the ratio of net retained earnings to net income.
tivity of the commercial bank cost structure to changes in market rates. As a result, commercial bank performance in 1983 and in the future will be more responsive to changing market conditions and more vulnerable to rising market yields. For ex-ample, should market rates rise and remain at high levels due to a resurgence of inflation, then the reper-cussions for Fifth District banks could be severe.
References
Cole, Roger T. “Financial Performance of Small Banks, 1977-80.” Federal Reserve Bulletin (June 1981), pp. 480-85.
Lloyd-Davies, Peter R. “Measuring Rates of Return.” Research paper for the Board of Governors of the Federal Reserve System.
Negri-Opper, Barbara. “Profitability of, Insured Com-mercial Banks.” Federal Reserve Bulletin (August 1982), pp. 453-64.