QTYUIOP
GA–A25510
BENCHMARKING OF CODES FOR
ELECTRON CYCLOTRON HEATING AND
ELECTRON CYCLOTRON CURRENT DRIVE
UNDER ITER PARAMETERS
by
R. PRATER, D. FARINA, Yu. GRIBOV, R.W. HARVEY, E. POLI,
A.P. SMIRNOV, F. VOLPE, E. WESTERHOF, A. ZVONKOV,
and ITPA STEADY-STATE OPERATION TOPICAL GROUP
DISCLAIMER
This report was prepared as an account of work sponsored by an agency of the United States Government. Neither the United States Government nor any agency thereof, nor any of their employees, makes any warranty, express or implied, or assumes any legal liability or responsibility for the accuracy, completeness, or usefulness of any information, apparatus, product, or process disclosed, or represents that its use would not infringe privately owned rights. Reference herein to any specific commercial product, process, or service by trade name, trademark, manufacturer, or otherwise, does not necessarily constitute or imply its endorsement, recommendation, or favoring by the United States Government or any agency thereof. The views and opinions of authors expressed herein do not necessarily state or reflect those of the United States Government or any agency thereof.
QTYUIOP
GA–A25510
BENCHMARKING OF CODES FOR
ELECTRON CYCLOTRON HEATING AND
ELECTRON CYCLOTRON CURRENT DRIVE
UNDER ITER PARAMETERS
by
R. PRATER, D. FARINA,* Yu. GRIBOV,
†R.W. HARVEY,
‡E. POLI,
¶A.P. SMIRNOV,
‡F. VOLPE,
§E. WESTERHOF,
#A. ZVONKOV,
Δand ITPA STEADY-STATE OPERATION TOPICAL GROUP
This is a preprint of a summary paper to be presented at the 14th Joint Workshop on Electron Cyclotron Emission and Electron Cyclotron Resonance Heating, May 9-12, 2006, Santorini Island, Greece, and to be published in the Proceedings.
*Association Euratom-ENEA-CNR sulla Fusione, IFP-CNR, Milano, Italy.
†
ITER International Team, Naka Joint Work Site, Ibaraki-ken, Japan.
‡
CompX, Del Mar, California.
¶
Max Planck Institut für Plasmaphysik, EURATOM Association, Garching, Germany.
§
EURATOM/UKAEA Fusion Association, Culham Science Centre, Abingdon, United Kingdom.
#
FOM-Institute for Plasma Physics Rijnhuizen, Association EURASTOM-FOM, The Netherlands Δ
Nuclear Fusion Institute, RRC Kurchatov Institute, Moscow, Russia.
Work supported by
the U.S. Department of Energy
under DE-FC02-04ER54698 and DE-FG03-99ER54541
GENERAL ATOMICS PROJECT 30200
JULY 2006
Benchmarking of Codes for Electron Cyclotron
Heating and Electron Cyclotron Current Drive
under ITER Parameters
R. Prater
1, D. Farina
2, Yu. Gribov
3, R.W. Harvey
4, E. Poli
5,
A.P. Smirnov
4, F. Volpe
6, E. Westerhof
7, A. Zvonkov
8, and
ITPA Steady State Operation Topical Group
1General Atomics, P.O. Box 85608, San Diego, California 92186-5608, USA 2Associazione Euratom-ENEA-CNR sulla Fusione, IFP-CNR, Milano, Italy
3ITER International Team, Naka Joint Work Site, Ibaraki-ken, Japan 4CompX, Del Mar, California, USA
5Max Planck Institut für Plasmaphysik, EURATOM Association, Garching, Germany 6EURATOM/UKAEA Fusion Association, Culham Science Centre, Abingdon, UK 7FOM-Institute for Plasma Physics Rijnhuizen, Association EURATOM-FOM, Trilateral Euregio
Cluster, The Netherlands (www.rijnh.nl)
8Nuclear Fusion Institute, RRC ‘Kurchatov Institute’, Moscow, Russia
Abstract. Optimal design and use of electron cyclotron heating (ECH) requires that accurate and relatively quick computer codes be available for prediction of wave coupling, propagation, damping, and current drive at realistic levels of EC power. To this end, a number of codes have been developed in laboratories worldwide. A detailed comparison of these codes is desirable since they use a variety of methods for modeling the behavior and effects of the waves. The approach used in this benchmarking study is to apply these codes to a single case. Following minor remedial work on some codes, the agreement between codes is excellent. The largest systematic differences are found between codes with weakly relativistic and fully relativistic evaluation of the resonance condition, but even there the differences amount to less than 0.02 in normalized minor radius.
Email of R. Prater: [email protected]
INTRODUCTION
Electron Cyclotron Heating (ECH) and Electron Cyclotron Current Drive (ECCD) systems are planned for ITER. These systems may be used for plasma initiation and startup, electron heating, and current drive for the purposes of control of the equilibrium current profile and control of MHD instabilities like sawteeth and neoclassical tearing modes (NTMs). Theory and experiment have both shown that highly accurate placement of a narrow profile of ECCD can effectively suppress or reduce the size of NTMs. The ability to accurately predict the location and profile of ECH and ECCD is critical to an assessment of the power needed for these objectives in ITER. In this paper, several computational approaches to modeling ECH/ECCD
effects under ITER conditions are compared for a single case as a means of comparing the different physics models and implementations.
THE CODES USED
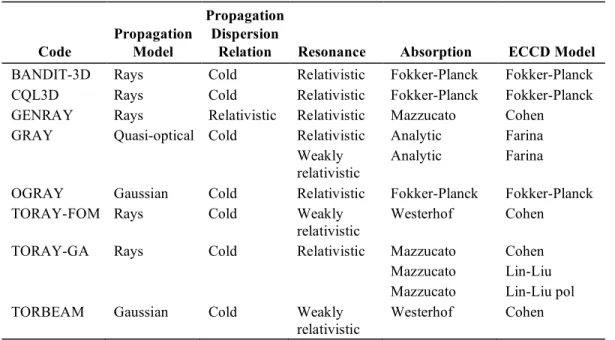
ECH codes are used to calculate the propagation of EC waves from the antenna to the plasma and within the plasma, the absorption of waves in the plasma, and current drive which may be generated by the waves.1 The codes may be divided into groups according to their model of propagation which may be described as ray tracing, Gaussian beam propagation, or quasi-optical propagation. The absorption of waves may be calculated in two basic ways. In the first, the absorption is found from an analytic model evaluated at points along the ray trajectory, and in the second the Fokker-Planck equation is solved in the quasi-linear approximation.2 Similarly, the current drive may be calculated by an analytic solution to the adjoint equation,3 or in Fokker-Planck codes the current is simply found from the first moment of the distribution function. The codes which were used in this study are representative but not exhaustive of the codes in use. Their properties are summarized in Table 1.
Table 1. ECH Codes Used in this Benchmarking Study
Code
Propagation Model
Propagation Dispersion
Relation Resonance Absorption ECCD Model
BANDIT-3D Rays Cold Relativistic Fokker-Planck Fokker-Planck
CQL3D Rays Cold Relativistic Fokker-Planck Fokker-Planck
GENRAY Rays Relativistic Relativistic Mazzucato Cohen
GRAY Quasi-optical Cold Relativistic Analytic Farina
Weakly relativistic
Analytic Farina
OGRAY Gaussian Cold Relativistic Fokker-Planck Fokker-Planck
TORAY-FOM Rays Cold Weakly
relativistic
Westerhof Cohen
TORAY-GA Rays Cold Relativistic Mazzucato Cohen
Mazzucato Lin-Liu
Mazzucato Lin-Liu pol
TORBEAM Gaussian Cold Weakly
relativistic
Westerhof Cohen
Ray Tracing Codes
In ray tracing codes, the propagation is based on the model of geometric optics in nonuniform media given most fully in Friedland and Bernstein.4 In this model, the ray trajectory and the ray wavenumber are advanced along the ray through derivatives of the dispersion relation. In the ray tracing model, the Gaussian beam is modeled as a number of rays arranged in space so that the spatially averaged power density along the ensemble is consistent with that of a propagating Gaussian beam. The rays propagate independently and do not interact; therefore, such effects as diffraction and
interference are not obtained in this formulism. The absorption along each ray is also calculated independent of other rays, so different rates of absorption will cause the radial profile of power in the beam to no longer resemble a Gaussian, which may be a real and important physical effect in some cases, particularly where the beam approaches the resonance at a steep angle. Typically 30 to 100 rays are adequate to simulate a beam.
TORAY
The TORAY code5 is an adaptation to tokamak geometry of earlier work done for mirror geometry. TORAY diverged into TORAY-GA, following work by Matsuda6 and many others, and into TORAY-FOM following work by Westerhof.7 These codes use the cold plasma dispersion relation for the ray tracing and various models may be chosen for the absorption. In this work the relativistic model by Mazzucato8 is used for absorption in the TORAY-GA calculations and a weakly relativistic model derived by Westerhof is used in TORAY-FOM.7 For ECCD, both codes may use the adjoint approach9 specialized to ECCD by Cohen.3 The Cohen approach has been reworked by Lin-Liu10 to generalize the square magnetic well used in Cohen’s approach, and this is alternatively called by TORAY-GA. In a third version of the ECCD calculation, Lin-Liu has added the effect of the wave polarization calculated from an externally evaluated dispersion relation (in the present case, that from Ref. 8) rather than the approximation used in Refs. 3 and 10 that the wave is right-hand circularly polarized, a condition that is not even approximately true for the ordinary mode as in the ITER design.
GENRAY
The highly modular GENRAY code11 was developed to simplify the use of different dispersion relations for the ray tracing and absorption. Derivatives of the dispersion relation may be done either analytically, if available, or numerically. In this benchmarking study, the ray tracing has been done using the fully relativistic dispersion relation.8 For ECCD GENRAY uses the Cohen formulation.3
CQL3D
The CQL3D code12 solves the Fokker-Planck equation in the quasi-linear approximation to obtain wave absorption and current drive. (For an excellent review of Fokker-Planck codes see Ref. 2.) The code accepts as input the ray trajectories calculated by other codes, presently TORAY-GA or GENRAY, and uses the local parameters along each ray as inputs to the Fokker-Plank solver, using the Stix formulation of EC-induced quasi-linear diffusion in velocity space.13 The Fokker-Planck approach permits a more sophisticated model for the collision operator than the high velocity limit of the collision operator commonly used in the adjoint approach. The collision operator used in CQL3D conserves momentum in electron-electron collisions which may be a significant effect in calculating current drive.
BANDIT-3D
The BANDIT-3D code14 is a Fokker-Planck code similar to CQL3D, but it contains its own ray tracing package using the cold plasma dispersion relation.
Gaussian Beam Codes
Gaussian beam codes were developed to address the shortcoming of the ray tracing codes when interference or diffraction are important. When a beam is launched with strong focusing, for example, the geometric optics of ray tracing codes may have the rays all crossing at a single point in space in an unphysical manner, while a Gaussian beam code would find a diffraction-limited waist of nonzero radius.
TORBEAM
The TORBEAM code15 uses the ray tracing formulism with a cold plasma dispersion relation to determine the trajectory for the beam center, but instead of tracing additional independent rays to find the beam cross-section, it uses a complex eikonal to describe the cross-section of the beam. Absorption of the beam is calculated as if all the power were in the central ray and then the decrement in power is spread across the beam cross-section. If the beam divergence is significant, the spread in
!
n|| in different parts of the beam can affect the absorption, or if the beam approaches the resonance at a small angle the side of the beam nearer the resonance would be preferentially absorbed. Calculating absorption using only the central values misses both of these effects, although only in special cases like highly oblique approach of the wave to the resonance are these effects significant. TORBEAM uses the Cohen formulation for current drive.
OGRAY
The OGRAY code16 combines Gaussian beam propagation with a Fokker-Planck solver. The FP equation is solved on flux surfaces where an analytic model indicates that absorption takes place. The weakly relativistic linear collision operator includes the effects of trapped particles.
Quasi-Optical Code
The quasi-optical GRAY code17 traces rays to simulate a Gaussian beam, but unlike the ray tracing codes an interaction between the rays18 is maintained to preserve interference and diffraction effects. Absorption is calculated independently along each ray. This approach reduces the limitations described above when the beam is forced to fit a Gaussian distribution even when the absorption and refraction are nonuniform across the beam. The ECCD is calculated in GRAY using the adjoint model described by Farina17 which avoids the square well and polarization assumptions of the Cohen model.
ECH/ECCD ON ITER
The ITER ECH system used in this benchmarking study was designed for control of MHD modes which require current drive at the
!
q=2 and/or
!
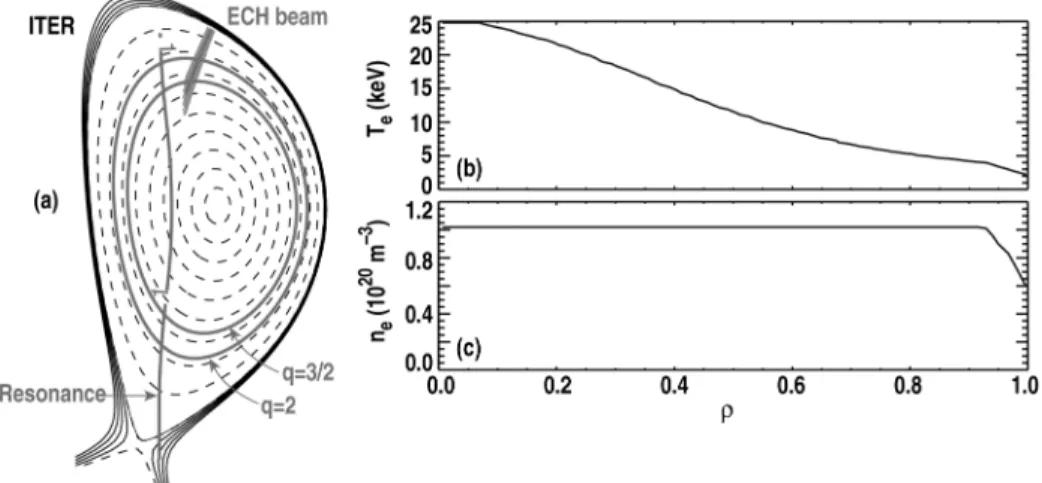
q=3/ 2 surfaces. The geometry and kinetic profiles are shown in Fig. 1. The plasma parameters correspond to the “Scenario 2”
!
Q=10 conditions, with toroidal field
!
Bt =5.3 T and plasma current
!
Ip =15 MA. The EC power is launched from a location at
!
R=6.48 m,
!
Z=4.11 m near the top of the plasma with a toroidal component which drives co-current and with a vertical component which places the co-current near the rational
!
q=3/2 at
!
"=0.66. The EC launch angles are characterized by the poloidal steering angle
!
" and the toroidal steering angle
!
". Then
!
" and
!
" are related to the polar angle
!
" and the azimuthal angle
!
", the conventional Euler angles used by some codes,
through the relationships
!
"=acos(cos#)sin$ and
!
"=#+asin(sin$/sin%).
FIGURE 1. (a) Cross-section of the ITER Scenario 2 plasma equilibrium used in this study. The solid flux surfaces are the rational surfaces
!
q=2 and
!
q=3/2. The ECH launcher is near the top of the plasma. Some typical ECH rays are shown for driving co-current at the
!
q=3/2 surface. The vertical line marked “1” is the fundamental resonance. The electron temperature profile (b) and plasma density profile (c) were provided by the ITER team.
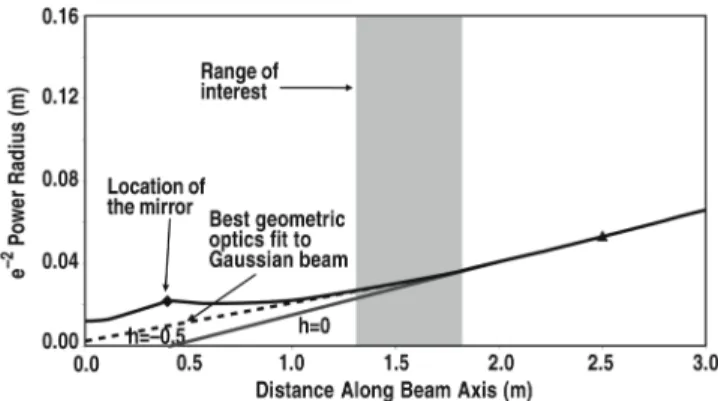
In this study, the remote steering concept is modeled following an early engineering design.1 The power from the waveguide reflects from a fixed focusing mirror 45 cm from the launch point at the end of the waveguide, which places a minimum in the radius of the beam about 35 cm from the mirror. This is shown in Fig. 2 which shows the beam waist radius as a function of distance along the wave path. The Gaussian beam codes described below can model the actual Gaussian beam, but the ray tracing codes which use geometric optics cannot. As an approximation, the divergence of the Gaussian beam can be fitted to a cone in the range of interest, which is 1 to 1.5 m from the final mirror for interaction with the
!
q=3/ 2 surface for a range of equilibria. This
cone has a divergence of 1.08 deg at
!
exp("2) in power with a starting point 0.5 m behind the final mirror (dashed line in Fig. 2). In this study, the ray tracing codes used this divergence but started the cone at the final mirror at
!
R=6.4848 m and
!
FIGURE 2. Waist radius of the EC beam at
!
exp("2) in power as a function of distance along the wave arc length, reprinted from Ref. 2. The light solid curve is the beam size without focusing and the heavy solid curve is the design which includes a focusing mirror. The focus mirror is considered the location of the ECH launcher. The shaded region has been added to the original figure to show the approximate range to the interaction locations of interest. The dashed curve, which was also added to the figure, is an approximate fit to the divergence of the beam in the region of interest.
EC WAVE STARTING CONDITIONS
In this benchmarking study, the EC beam starting conditions are chosen to be relevant to the objective of driving current at the
!
q=3/2 surface at
!
"=0.64. In order
to pick appropriate starting angles, the TORAY-GA code was used to survey the results of a scan over a range of the two launching angles. The normalized minor radius at the peak of the driven current and the value of the peak of the driven current are shown in Fig. 3. The values chosen for this study are
!
"=#63.5 deg and
!
"=22.0 deg, which maximize the peak current density on the rational surface.
FIGURE 3. Ray tracing results from TORAY-GA code using 48 rays, for the geometry shown in Fig.1, as a function of the poloidal steering angle
!
" and toroidal steering angle
!
". Shown are the normalized minor radius
!
" of the peak of the driven current (dashed contours) and the peak driven cur-rent in A/cm2/MW (solid contours). The diamond symbol represents the chosen angles for this study.
RESULTS
The codes described in Table 1 were run for the benchmarking case. The approach used in this study was as follows:
1. Verify that the codes are using the same starting angles (which may be defined in different ways in the different codes).
2. Verify that the equilibrium actually used is the same.
3. Verify that the profiles of electron temperature and density actually used are the same.
4. Compare the trajectories of the central ray or center of the beam. 5. Compare the rate of absorption along the central ray.
6. Compare the profiles of absorbed power and current drive.
After the codes were run, the data calculated along the central ray were assembled in tables as a function of ray arc length
!
s at increments of about 1 cm. The data included the values of ! R, ! Z toroidal angle !
", the normalized minor radius
!
" (square root of the normalized toroidal flux), the local electron density
! ne and temperature ! Te, the magnetic field !
B, the index of refraction, the parallel index of refraction
!
n||, the imaginary part of the wavenumber
!
ki, the normalized power remaining in the ray, and in some cases the effectiveness of the current drive
!
d IEC/d s. It should be noted that
Fokker-Planck codes may not calculate
!
ki or
!
dIEC/ds since absorption is calculated
using the quasi-linear diffusion operator averaged over a flux surface rather than along a ray.
Some of these objectives may seem trivial, but in fact it took a couple of iterations of the run/submit/compare cycle before items (1) to (3) were satisfied. The ray starting angles were tested by determining the launching angles of the beam or central ray from the spatial coordinates of the first two points along the ray. For all cases, the poloidal and toroidal angles of the ray were equal to the target starting angles within the uncertainty set by the numerical precision of the reported coordinates. The use of the same equilibrium was verified by comparing the values of
!
" and
!
B for each
!
(R,Z) point along the ray with that calculated independently from the equilibrium. Again, after a couple iterations, this agreement was within the numerical uncertainties of the location of the points. And the use of the same kinetic profiles was verified by comparing
!
ne["(s)] and
!
Te["(s)] from the codes with the values expected from the
profiles shown in Fig. 1, again with excellent agreement.
The ray trajectories are affected by refraction in general, but in the present case the density is low enough that refraction is minor. At the plasma boundary the density jumps from 0 to
!
5.6"1019 m#3, and codes either project a decreasing density outside
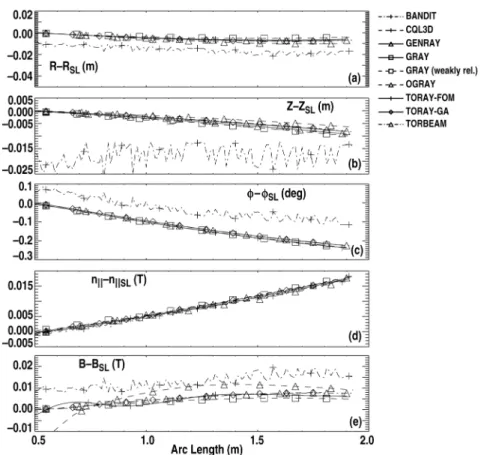
the plasma or more commonly apply Snell’s law at the boundary. Figure 4(a-c) show the ! R(s), ! Z(s), and !
"(s) of the ray points for all the codes as differences from a straight line starting at the antenna with the target launch angles. All the codes lie close to each other, but the points of Bandit are slightly offset from the others by 1 cm.
FIGURE 4. Quantities (a) ! R, (b) ! Z, (c) !
", plotted as the difference between the central ray and the values for a straight line with the target values of the launching angles and location, for the codes of Table1. (d) Difference between
!
n|| and the projection of a unit vector along the straight line on the magnetic field, and (e) the difference between
!
B and an evaluation of the magnetic field along the straight line. All quantities are plotted as a function of arc length from the nominal antenna location at
!
R=6.4848 m and
!
Z=4.11 m. The plasma edge is near 0.5 m arc length. The parallel index of refraction
!
n|| and the magnetic field
!
B are very important in the evaluation of the wave absorption since they determine the resonance condition. For
!
n|| all codes have values very close to each other and close to that of a straight line as shown in Fig. 4(d). Likewise, the magnetic field is very close for all codes and close to that along the trajectory of a straight line, as shown in Fig. 4(e).
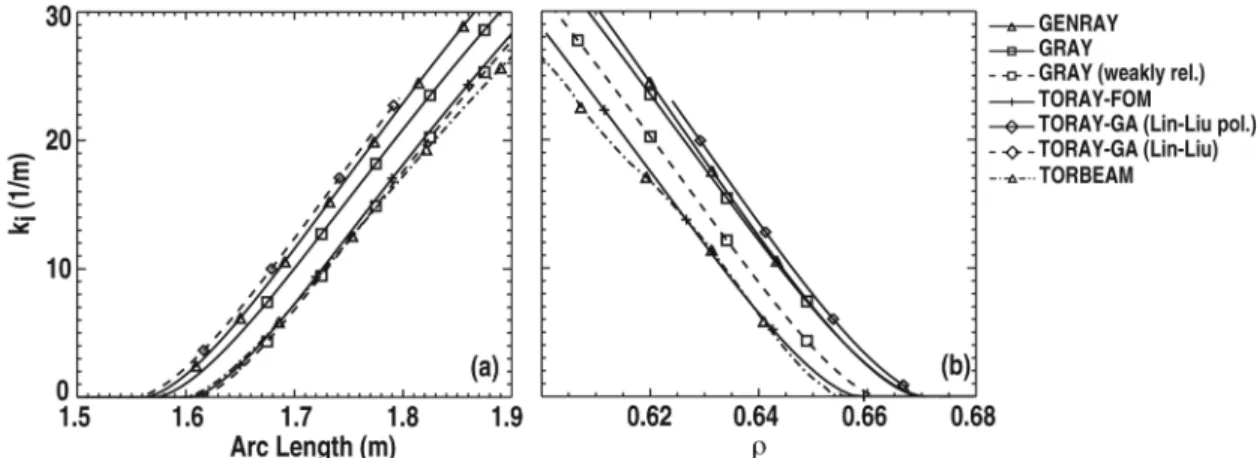
The rates of absorption of the central ray as it approaches the resonance are slightly different for the codes depending primarily on whether the code uses a weakly relativ-istic or a fully relativrelativ-istic calculation of the Doppler-shifted relativrelativ-istic resonance. Figure 5 shows the imaginary part of the wavenumber for the codes and the division into the two groups can be clearly seen. Figure 5(b) shows that the difference in
!
" is only about 0.015, which is small compared to the width of the heating profile. For some situations, these differences between the fully and the weakly relativistic codes can be significant.
FIGURE 5. Imaginary part of the wavenumber as a function of (a) arc length and (b) normalized minor radius.
The heating profiles for the codes are very similar for all codes as shown in Fig. 6(a). In all cases, the power is fully absorbed, but the curves differ a little in width. In this study, no careful comparison of the starting conditions for beam width for the codes has been done yet. It is hard to define an approach to comparing the width of the beam codes with the ray tracing codes since beam width quantities were not collected (and may not be available for some codes). The difference between the fully relativistic codes and the weakly relativistic codes seen in Fig. 5 is not so apparent in the net profiles of power density realized for a combined number of rays or Gaussian beam.
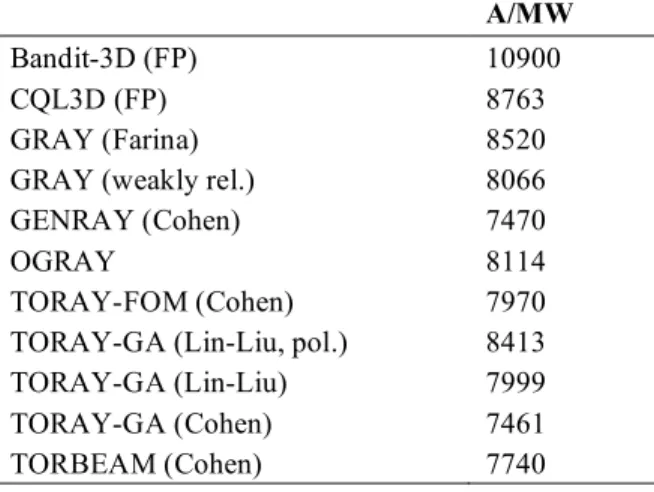
A similar result is obtained for the current density [Fig. 6(b)]. The small differences in the widths of the profiles results in moderate differences in the peak current densi-ties. The integrated currents are shown in Table 2. A good measure of the total current is obtained by the CQL3D code, which has an accurate model for the collision opera-tor (that is, an operaopera-tor which conserves momentum in electron-electron collisions and does not use the high velocity approximation). The current drive from the most sophisticated models which include polarization effects and accurate magnetic geometry is slightly smaller, and the Cohen model is even smaller. The current drive from the Bandit-3D code is such an outlier that it was not plotted in Fig. 6.
FIGURE 6. (a) Electron power density profile for the codes, and (b) electron cyclotron current density profile.
Table 2. Total ECCD for the codes.
A/MW
Bandit-3D (FP) 10900
CQL3D (FP) 8763
GRAY (Farina) 8520
GRAY (weakly rel.) 8066
GENRAY (Cohen) 7470
OGRAY 8114
TORAY-FOM (Cohen) 7970
TORAY-GA (Lin-Liu, pol.) 8413
TORAY-GA (Lin-Liu) 7999
TORAY-GA (Cohen) 7461
TORBEAM (Cohen) 7740
CONCLUSIONS
The codes give results for the benchmarking case which are quite similar. The total driven current is slightly underestimated by most codes compared with CQL3D, but the differences are fairly small. It should be noted that under other conditions, for example higher electron temperature and smaller magnetic well, the differences may be larger. The peak current density, a key parameter for stabilization of NTMs, is sufficiently sensitive to beam width that direct comparisons cannot be made without improved reporting of data from the codes.
Quasi-linear effects are not significant under ITER conditions. Since some of the codes have been well validated against experiment under conditions not too far from the ITER conditions,20,21 it seems that the fully relativistic codes are well qualified to predict the EC performance in ITER. The Gaussian beam codes are better suited in cases where the focus of the EC beam lies well inside the plasma.
ACKNOWLEDGMENTS
This work supported by the U.S. Department of Energy under DE-FC02-04ER54698 and DE-FG03-99ER54541.
REFERENCES
1. See review R. Prater, Phys. Plasmas5, 2349 (2003).
2. See review E. Westerhof, Conference Proceedings, 9th Joint Workshop on Electron Cyclotron Emission and Electron Cyclotron Heating, World Scientific, Singapore, 1995, p. 3.
3. Ronald H. Cohen, Phys. Fluids30, 2442 (1987).
4. L. Friedland and I. Bernstein, Phys. Rev. A22, 1680 (1980).
5. A. H. Kritz, H. Hsuan, R. C. Goldfinger, and D. C. Batchelor, Conference Proceedings, 3rd Intl. Symp. on Heating in Toroidal Plasmas ECE, Brussels, 1982, Vol. 2, p. 707.
6. K. Matsuda, IEEE Trans. Plasma Science17, 6 (1989).
7. E. Westerhof, “Implementation of TORAY at JET,” National Technical Information Service document no PB91-114819INZ (Rijnhuizen Report 89-183, 1989). Copies may be ordered from the National Technical Information Service, Springfield, Virginia 22161.
8. E. Mazzucato, I. Fidone, G. Giruzzi, Phys. Fluids30, 3754 (1987).
10. Y. R. Lin-Liu, V. S. Chan, R. Prater. Phys. Plasmas10, 4064 (2003). 11. R. W. Harvey (private communication).
12. R. W. Harvey and M. G. McCoy, IAEA Conference Proceedings, Technical Committee Meeting on Advances in Simulation and Modeling of Thermonuclear Plasmas, International Atomic Energy Agency, Vienna, Austria, 1993, p. 305.
13. T. H. Stix, Theory of Plasma Waves, 2nd ed. (Wiley, New York, 1992).
14. M. R. O′Brien, M. Cox, C. D. Warick, and F. S. Zaitsev, IAEA Proceedings, Technical Committee Meeting on
Advances in Simulation and Modeling of Thermonuclear Plasmas, International Atomic Energy Agency, Vienna, Austria, 1992, p. 527.
15. E. Poli, G. V. Pereverzev, and A. G. Peeters, Phys. Plasmas6, 5 (1999).
16. A. V. Zvonkov, A. Yu. Kuyanov, A. A. Skovoroda, A. V. Timofeev, Plasma Phys. Reports24, 389 (1998).
17. Daniela Farina, IFP-CNR Internal Report FP 05/1 (2005), http://www.ifp.cnr.it/publications/2005/FP05-01.pdf.
18. E. Mazzucato, Phys. Fluids B1, 1855 (1989).
19. M. Graswinckel, IAEA TM on ECRH Physics and Technology for ITER, 14-16 July 2003, Kloster-Seeon, Germany (IPP Garching, 2003).
20. C. C. Petty, R. Prater, J. Lohr, T. C. Luce, W. R. Fox, R. W. Harvey, J. E. Kinsey, L. L. Lao, and M. A.
Makowski., Nucl. Fusion 42, 1366 (2002).
21. T. Suzuki, S. Ide, K. Hamamatsu, A. Asayama, T. Fujita, C. C. Petty, Y. Ikeda, K. Kajiwara, O. Naito, M. Seki,