WORKING PAPER N° 2009 - 02
Work, jobs and well-being
across the Millennium
Andrew E. Clark
JEL Codes: J21, J28, J3, J6, J81, L26
Keywords: Employment, unemployment, self-employment, life satisfaction, job quality, job satisfaction
P
ARIS-
JOURDANS
CIENCESE
CONOMIQUESL
ABORATOIRE D’E
CONOMIEA
PPLIQUÉE-
INRA48,BD JOURDAN –E.N.S.–75014PARIS TÉL. :33(0)143136300 – FAX :33(0)143136310
www.pse.ens.fr
Work, Jobs And Well-Being Across The Millennium
Andrew E. Clark
*Paris School of Economics and IZA
January 2009
Abstract
This paper uses repeated cross-section data ISSP data from 1989, 1997 and 2005 to consider movements in job quality. It is first underlined that not having a job when you want one is a major source of low well-being. Second, job values have remained fairly stable over time, although workers seem to give increasing importance to the more “social” aspects of jobs: useful and helpful jobs. The central finding of the paper is that, following a substantial fall between 1989 and 1997, subjective measures of job quality have mostly bounced back between 1997 and 2005. Overall job satisfaction is higher in 2005 than it was in 1989. Last, the rate of self-employment has been falling gently in ISSP data; even so three to four times as many people say they would prefer to be self-employed than are actually self-employed. As the self-employed are more satisfied than are employees, one consistent interpretation of the above is that the barriers to self-employment have grown in recent years.
Keywords: Employment, Unemployment, Self-Employment, Life Satisfaction, Job Quality, Job Satisfaction
JEL Codes: J21, J28, J3, J6, J81, L26.
*
PSE, 48 Boulevard Jourdan, 75014 Paris, France. Tel.: +33-1-43-13-63-29. E-mail: Andrew.Clark@ens.fr. I am extremely grateful to CEPREMAP for financial support, and to Simona Baldi for research assistance. I also thank an anonymous referee for useful comments, and Sven Blondal, Bob Cummins, Ed Diener, John Helliwell, Ruut Veenhoven and seminar participants at “International Differences in Well-Being” Conference (Princeton), and the OECD Conference on “Is happiness measurable and what do those
measures mean for policy”? (University of Rome Tor Vergata) for helpful suggestions.
Work, Jobs And Well-Being Across The Millennium
“The hope of pleasure in the work itself: how strange that hope must seem” (William Morris, “Useful Work versus Useless Toil”, 1884)
1. Introduction
Subjective well-being has arguably been moving into the mainstream in Economics over the past ten years. One measure of the success of this insertion is the number of published articles in the domain. An ECONLIT search for journal articles with either 'Happiness', 'Life Satisfaction', 'Well-being' or 'Job Satisfaction' in the title, described in Clark et al. (2008b) identifies 614 published articles between 1960 and 2006. Of these 363 (59%) have been published since 2000. We have thus moved (in Economics) from a pre-2000 period where one "well-being" article (by this count) was published every two months to a new regime where more than one is published per week.
A number of these papers have addressed policy issues. Sometimes these concerned fairly specific problems, such as the rationality of smokers' choices (Gruber and Mullainathan, 2006) or the compensating differential for aircraft noise (Van Praag and Baarsma, 2005). A wider separate literature has broadly asked the question "What makes a good life"? Contributions along these lines include Di Tella and MacCulloch (2006), Layard (2005), and Kahneman et al. (2004).
This paper aims to contribute to this policy debate, but more particularly in the world of work. There have now been a number of papers using different datasets across different countries to answer the question: What matters in life? When individuals rank life domains such as income, family, marriage, leisure, housing, job, friendship and health, the category "job" often comes towards the top of this ranking. An early contribution is Glenn and Weaver (1981), and a recent careful econometric analysis is found in Ferrer-i-Carbonell and Van
Praag (2004). In addition, individuals spend a great deal of time at work: arguably almost more than they spend on "doing" any other particular thing (apart from perhaps watching television: see Benesch et al., 2006).
In the context of well-being at work, I ask three specific questions about OECD labour markets over the past twenty years, although the answers will concentrate on only one of them:
* How important is it to have a job (especially when you want one)? Or: How bad is unemployment?
* What job characteristics are most important for job satisfaction? And how have these characteristics been changing over the past twenty years in OECD countries?
* Is there anything particular about self-employment in OECD countries?
The approach taken here will be mostly subjective. To find out about workers' jobs and lives, and what it is that they like and dislike about them, I will use the answers given by individuals to questions asking them explicitly to evaluate these same jobs and lives. Specifically, the first question will mostly appeal to a measure of overall satisfaction to evaluate the harm from unemployment, while the second and third questions will be addressed using overall job satisfaction information.
Although it is probably fair to say that there is no unanimity on the usefulness of subjective well-being information in Economics, there is likely now greater willingness to pay attention to such measures than in the past. A mini-industry of validation studies has used panel data to show that what people say today is a strong predictor of what they will do in the future: links have been established between current well-being and future life expectancy, morbidity, productivity, quits, absenteeism, unemployment duration, and marriage duration. At the same time, a flourishing literature in Psychology has examined the links between measures of job
satisfaction or employee engagement, on the one hand, and firm performance on the other (where this latter includes profitability, productivity, turnover and absenteeism): see, for example, the meta-analyses in Harter et al. (2002 and 2006) and Judge et al. (2001). Were individuals’ responses purely idiosyncratic, then they could not be compared to each other and none of the above relationships would pertain.
I address the second and third of the above questions using the three separate waves of the International Social Survey Programme (ISSP) that cover the labour market and work orientations. However, will not be able to deal with the first question in this way. Here I would like to evaluate the effect of employment, and unemployment, on some measure of psychological well-being. Unfortunately, the ISSP, for all of its advantages, does not include a measure of life satisfaction or overall psychological functioning. To establish the relationship between work and well-being, I turn to European Community Household Panel (ECHP) and British Household Panel Survey (BHPS) data, both of which include well-being measures which are asked of both the employed and unemployed.
This paper is structured as follows. The next section considers the simple relationship between employment, unemployment and subjective well-being, and sets out the policy implications that result. Section 3 recalls that employment is nonetheless not a homogeneous state, and uses repeated ISSP data to track the movements in job quality in OECD countries from 1989 to 2005. Section 4 then distinguishes self-employment from employment, and asks: If the self-employed are so satisfied, what are the rest of us doing still being employees? Last, Section 5 concludes.
2. Working and Well-Being
We might imagine that one of the most important aspects of the labour market in terms of well-being is whether individuals are able to find a job, given that they want one. The relationship between individual well-being and unemployment (along with that with income)
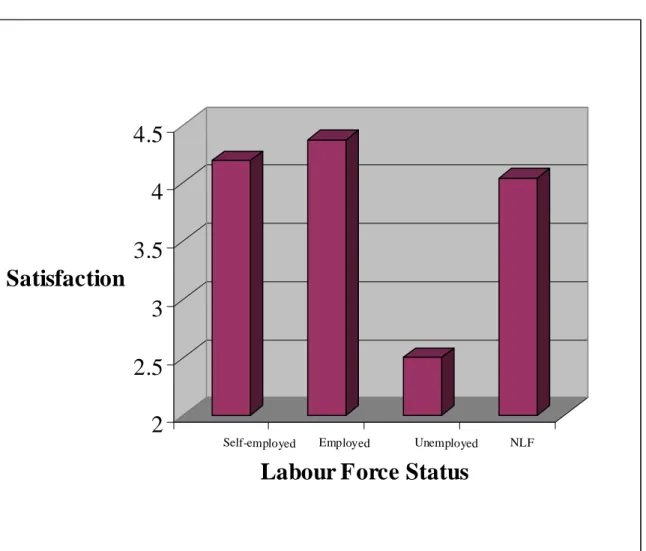
has been something of a mainstay in the literature. The very consistent result in empirical research is that unemployment is strongly negatively correlated with various measures of well-being. Figure 1 illustrates with data from the ECHP,1
from 1994 to 2001, where average satisfaction with work or main activity (on a 1-6 scale, with 6 being the most satisfied) is plotted against labour force status.
The self-employed have satisfaction scores that are only little different from those of the employed in this dataset (of which more below). Of most interest here is the well-being of the unemployed compared to those who are in work. The former report satisfaction scores which are, on average, two points lower than those for the employed and self-employed; this is a very large difference on a six-point scale. This negative relationship persists, with little change in its size, in multivariate regression analyses which control for the level of income as well as a variety of other explanatory variables (for example, Clark and Oswald, 1994, and Winkelmann and Winkelmann, 1998). As such, the main effect of unemployment on well-being would seem to be non-pecuniary: it would take a great deal of money indeed to make the unemployed as happy as the employed.
The satisfaction of the unemployed is lower than that of the employed in Figure 1. Can we therefore immediately conclude, for policy purposes, that ceteris paribus putting the unemployed into work will raise "National Well-Being"? There are three reasons to pause for thought at this juncture:
A) It is not unemployment that makes people unhappy, it is the unhappy who become unemployed.
In this reverse causality argument, putting the unemployed back into work may have little or no effect on their satisfaction: it is their inbuilt personality, or something else, that is causing their lower level of well-being, independently of their labour market status. This
1
See http://epp.eurostat.cec.eu.int for details of the ECHP data.
argument is behind the known idea of individual set-points in being: two well-known contributions are Diener et al. (2005) and Fujita and Diener (2005).
Panel data, where we follow the same individual over time, allows us to observe the same individuals as they find and lose jobs. If it is indeed unemployment that causes lower well-being, then the latter will fall sharply upon the individual’s entry into unemployment. However, if the low well-being observed amongst the unemployed is caused by the over-representation there of individuals with low well-being set-points (who wouldn’t have much higher well-being scores were they employed), then panel analysis, which is within-subject, will only pick up a small or null correlation between unemployment and well-being.
In practice, panel regression analysis consistently finds that well-being does rise when the unemployed find a job (and when the employed lose their jobs). While there is likely some truth to the argument that unhappiness causes unemployment, this composition or shift-share effect does not seem to entirely explain the unemployment well-being gap.
B) It depends when we put the unemployed back in work.
What if individuals "get used" to unemployment? A growing literature in Economics and Psychology tackles the question of whether individuals adapt over time to new circumstances. In our context, this implies that the longer-run effects of unemployment will be milder than their short-run effects, and in the case of complete adaptation the long-term unemployed will be just as happy as the employed. The policy conclusion is then that we should concentrate our fire on the short-term unemployed, where the well-being returns from employment are largest.
Clark et al. (2008a) look for evidence of habituation in twenty waves of German (GSOEP) panel data, considering marriage, divorce, widowhood, birth of child, layoff, and unemployment. They carry out a fixed-effect econometric analysis using panel data, which effectively follows the same individual over time before, during and after the event in
question. The dependent variable is overall life satisfaction. The results for unemployment, for men and women, are shown in Figure 2. These show the movements in life satisfaction for the employed before they move into unemployment (which occurs at time t=0, illustrated by the vertical line), and then their life satisfaction when unemployed. Note that these satisfaction movements are traced out only for those who remain unemployed, which seems a natural way to address the issue of adaptation. The results show that there is little evidence of adaptation to unemployment for men: those who have been unemployed for three years or more report just as low levels of satisfaction as those who are in the first year of unemployment. The picture is more mixed for women, although again the second and third years of unemployment do seem to be just as bad in life satisfaction terms as the first year of unemployment.
C) It depends which unemployed we put back in work.
The previous paragraph discussed potential adaptation to unemployment. This can usefully be thought of as a comparison to myself in the past: what I think of my current situation depends on the past situations that I have experienced. Adaptation thus concerns intrapersonal intertemporal comparisons (with respect to the same person, and over time).
A second kind of comparison is interpersonal but atemporal: I compare my current situation to that of other people around me at the same point in time. A lively literature across the social sciences has found evidence in favour of such comparisons with respect to income (Blanchflower and Oswald, 2004, Clark and Oswald, 1996, and Luttmer, 2005, to name just three). Social comparisons in other areas have also been investigated, such as health (Powdthavee, 2009) and weight (Blanchflower et al., 2009, and Clark and Etilé, 2008). Social comparisons with respect to unemployment imply that my own unemployment will hurt less the more unemployment there is around, broadly speaking. We should then concentrate on moving back into work those who live in low-unemployment regions (as they suffer the
most), effectively creating unemployment ghettos. Note that although this is anti-egalitarian with respect to unemployment, it is egalitarian with respect to subjective well-being.
There is empirical evidence of such unemployment comparisons. Clark (2003) used the first seven waves of the BHPS to show that unemployment does indeed seem to hurt less in high-unemployment regions. The graphs in Figures 3 and 4 illustrate the main results. The well-being score here is the 12-item version of the General Health Questionnaire (the GHQ-12). This consists of twelve individual questions, covering, for example, trouble sleeping, belief in self-worth, enjoying day-to-day activities, and playing a useful role. All of these questions are answered on a one-to-four scale. Two of the answers are negative and two are positive. For example, with respect to trouble sleeping, the positive answers are “Not at all” and “No more than usual”, and the negative answers are “Rather more than usual” and “Much more than usual”. The "caseness" measure of GHQ adds up the number of questions that are answered using one of the negative responses. We here invert this score, producing an index on a scale of 0 to 12, where higher numbers mean better psychological functioning. The precise form of the GHQ questions and their possible responses is available on the BHPS website (http://www.iser.essex.ac.uk/survey/bhps).
Figure 3 shows the bivariate relationship between this Caseness score and regional unemployment. The vertical axis measures the average difference in GHQ scores between the employed and the unemployed: this therefore shows how much worse off the average unemployed person is than the average employed person (or the average psychological cost of unemployment). This figure has been calculated per wave (7) and per standard British region (11: as listed in the note underneath the graph), producing 77 data points in all. The figure on the horizontal axis shows the LFS unemployment rate, again by region and by year. The scatterplot suggests that the psychological cost of unemployment is indeed lower in regions
where the unemployment rate is higher.2 The raw correlation between the two series is -0.32, significant at better than the one per cent level.
This analysis can be formalised by running multivariate regressions of individual GHQ scores on own unemployment, regional unemployment, and the interaction between the two, as well as a host of other standard socio-demographic control variables. The results of such regressions are summarised in Table 1, which presents the predicted well-being levels of individuals in different labour market situations. The actual figure refers to the predicted probability of having a “high” GHQ level (of 11 or 12 on the 0 to 12 scale). The top panel of Table 1 refers to the relationship between well-being and regional unemployment. The first line refers to an individual in work (E) in a region with a five per cent unemployment rate, who is predicted to have a 60 per cent probability of having a high level of GHQ. Moving this employed individual to a higher-unemployment (10%) region slightly reduces this probability.
This relationship between GHQ and regional unemployment is reversed for the unemployed. An unemployed individual in a region with a 5% unemployment rate is predicted to have a 31% chance of having high well-being; moving this unemployed individual to a region with higher unemployment actually increases their well-being (to a figure of 38%). This result concords with findings on suicide and para-suicide rates by the unemployed, which are highest in low-unemployment regions (see Platt and Tansella, 1992).3
The bottom panel of Table 1 repeats this analysis, but this time for a much-tighter reference group: the individual's spouse. The empirical analysis here covers couples who are
2
Similar results have been reported using German (Clark et al., 2008c) and South African (Powdthavee, 2007) data.
3
We might imagine that this reflects some kind of shift-share phenomenon: the unemployed in high-unemployment regions include a broad section of the population, whereas the few unemployed in low-unemployment regions may include a greater proportion of “difficult” people with lower GHQ levels. This automatically explains why the employed-unemployed gap in GHQ is smaller in high unemployment regions. To test this, I look at the GHQ score of those moving into unemployment in low- and high-unemployment regions. If shift-share holds, then those moving into unemployment in high-unemployment regions should have higher GHQ (before they became unemployed) than those moving into unemployment in low-unemployment regions. There is no evidence of this in the BHPS data.
both active in the labour market. There are then four possible couple labour-market outcomes, given by the combinations of employment and unemployment between the individual and her spouse. In the first line the probability that a worker with an employed spouse report high well-being is 58%; this probability falls slightly to 56% for an employed individual with an unemployed spouse. However, again, the worst situation is not when the individual and her partner are both unemployed, as perhaps might have been imagined, but rather when the individual is unemployed and her partner works.
The unemployed are therefore unhappy, and not only because it is the unhappy who are more at risk of unemployment. However, the unemployed are not necessarily all equally unhappy. In particular, social context seems to matter. The stronger is the social norm of employment, the less well the unemployed do, psychologically, as pointed out by Stutzer and Lalive (2004). Higher levels of regional unemployment may make those who are already unemployed better off. At the limit, being unemployed in a very high unemployment area may not be much worse in well-being terms than being employed in the same region.
While empirical evidence does point in favour of such a social-norm effect, the average effect of unemployment on the unemployed remains substantial and negative: in the datasets that social scientists typically analyse, unemployment remains one of most damaging events that we can identify. This suggests that while social norms may well apply, they mostly operate by changing the unemployment experience from something awful to something slightly less awful. In addition, we have found only little evidence of any habituation to unemployment.
Employment then continues to be a key element of individual and societal well-being for those who wish to work. This is not to say, however, that all jobs are the same. The following section uses repeated cross-section data from the ISSP to examine various job characteristics, and how they have changed over time. In particular, we can use these data (collected in 1989,
1997, and 2005) to evaluate the hypothesis that job quality has fallen secularly over the past twenty years.
3. Changing Job Quality over the Millenium
This section is concerned with the general issue of job quality, and how this has changed over time. Here I am able to appeal to repeated cross-section data from three waves of the ISSP (see http://www.issp.org/). Many different countries are present in the ISSP datasets, with the number of countries tending to grow over time. The analysis on job quality I present here is based on the OECD countries found in the three “Work Orientations” waves of the ISSP, which contain a great deal of both objective and subjective cross-country information about job quality: these took place in 1989, 1997 and 2005. Table 2 shows the distribution of OECD countries, together with the number of employees interviewed, in these three ISSP waves.4
The ISSP Work Orientations modules contain information on both job values (what workers think is important) and job outcomes (what they actually get). With respect to the former, the importance of eight different job characteristics is recorded, using five rankings from "Not at all important" to "Very Important": High income; Flexible working hours; Good opportunities for advancement; Job security; Interesting job; Allows to work independently; Allows to help other people; and Useful to society.
Very likely due to data restrictions, there has been a tendency in the empirical literature to summarise job quality by simple measures of earnings and hours (and perhaps job security). The answers to these job values questions will allow us to see if other, more neglected, work
4
The ISSP samples were mostly stratified, and designed to be representative of adults (aged 18 or over) living in non-institutional accommodation. The mode of administration was most often face-to-face. There are a number of differences between countries in this respect. Details regarding the questionnaire, sampling, and data collection are available in the Study Monitoring Report for each ISSP wave. That for 2005, for example, is available via the following web page: http://www.gesis.org/en/services/data/survey-data/issp/modules-study-overview/work-orientations/2005/.
domains might be equally (or even more) important. The results across the three ISSP waves are presented in Table 3. This table has five columns. The first three present job value information in 1989, 1997 and 2005 for employees in those five OECD countries which participated in all three ISSP waves (West Germany, Great Britain, USA, Hungary and Norway: see Table 2). The last two columns present analogous figures for the 15 countries which were present in both ISSP waves 1997 and 2005.
Job characteristics are ranked from "Not at all important" to "Very Important". Note that this is an absolute rather than a relative ranking: it is possible to class all eight characteristics as very important. Table 3 shows, separately for men and women, the (weighted) percentage describing each job characteristic as "Very Important". The asterisks show whether the changes from one ISSP wave to the next are significant.
The results are remarkably consistent between men and women. There is some movement in recent years towards the increasing importance of high incomes, flexible working hours, and promotion opportunities. The (much-discussed) aspect of job security is the most likely to be described as very important, but it is of interest that the percentage doing so has barely changed between the different waves of the ISSP, arguing against any sharp increase in concern over this aspect of the job. The percentage saying that independence is very important has increased a little (for men), but the largest movements come with respect to arguably the most difficult to measure aspects of a job: whether it is helpful and whether it is useful. It can be countered that these latter figures should be taken with a pinch of salt, as there is likely a social desirability imperative for respondents to agree that these categories are important. Even so, the percentage saying that having a helpful job is very important is less than half as large as that saying that job security is very important; and in any case, we are here looking at changes in these percentages over time.5
5
It could of course be countered that social desirability has increased over time also. We have no way of knowing this.
The conclusion from Table 3 is that men are overall similar to women in terms of what they find important in their job, and that there is broad stability in terms of what employees find important in a job. Perhaps most importantly for the current exercise, any evaluation of job quality based uniquely on income and hours risks missing out on many job domains that workers value.
We now move on to consider movements in actual job outcomes from 1989 to 2005 in OECD countries. We identify six broad classes of job outcomes:
* Pay;
* Hours of work;
* Future Prospects (promotion and job security); * How hard, stressful or dangerous the job is;
* Job content: interest, prestige and independence; and * Interpersonal relationships.
These job outcomes are mostly measured using subjective self-reports from workers, although we do have information on monthly net earnings and weekly hours of work. The details regarding the construction of the indices that are used here are found in Appendix A1. Last, as a summary measure of all of the aspects that workers appreciate or dislike about their job, some of which we explicitly measure here and some of which we don’t, the ISSP asks each employee “How satisfied are you in your (main) job”? Answers are on a one-to-seven scale, where one means completely dissatisfied, and seven means completely satisfied. The distribution of job satisfaction over the three waves of the ISSP is shown in Appendix A2.
The ISSP subjective job outcome information is summarised in Table 4. The different domains covered here are of course not exhaustive, but they do reflect a number of job characteristics that are not consistently found in other surveys. Any other unmeasured job
aspects will be picked up in the summary measure in the last row: overall job satisfaction. Table 4 shows the (weighted) percentage of employees in the ISSP data with the job outcome in question. Separate figures are presented for men and women, and for 1989, 1997 and 2005. Table 4 shows that (subjective) income rose, while the desire to reduce hours of work rose for women (in the fifteen OECD countries surveyed between 1997 and 2005) but stayed broadly the same for men. Promotion opportunities rose for both sexes, especially between 1997 and 2005. Job security is of great interest, given the amount of ink that has been spilled. Reported job security fell sharply from 1989 to 1997, but has then made a recovery. This recovery has been almost total for women, but only partial for men. Towards the bottom of the tables, job content has improved for women, and relations at work have improved for men.
Concentrating on the right-hand panel of Table 4, the overall picture looks fairly rosy between 1997 and 2005: everything that has changed significantly has done so for the better. This is reflected in the last line in the percentage reporting high job satisfaction (very or completely satisfied on the one-to-seven scale) which has risen significantly by three percentage points for men, but only insignificantly so for women.
Table 4 is based on the raw data, describing the experience of the average person in the economy; however, this average person may have changed over time. As such, movements in job outcomes can reflect composition effects (such as the aging of the workforce, with older workers being more satisfied than younger workers), rather than the changing nature of jobs. The key question is then whether job satisfaction and other measures of job quality have risen because of changes in the type of people doing jobs, or changes in the kind of jobs they do. Policy in this area is arguably about changing the latter rather than the former (although the former will undoubtedly respond to changes in the latter). We address this issue in a standard way, appealing to regression analysis with individual demographic controls, as well as
country and year dummies. These latter will pick up changes in job quality over the three waves of the ISSP surveys, conditional on the other right-hand side variables.
These regressions will reveal whether job quality has evolved over time, holding the structure of the workforce constant in terms of variables such as sex, age, and education. In the regression analysis, we will use two separate specifications: one without and one with earnings and hours. The latter analysis therefore asks whether an employee who kept the same hours of work and real earnings from 1989 to 1997 to 2005 would consider their job to have become more or less attractive over time. While this may sound like an artificial exercise, it does help to isolate the role of changing earnings and hours in explaining movements in job quality. While much work has insisted on the role of income in determining job quality, hours of work have been relatively neglected. Yet, as Harter and Arora (2008) show using both a measure of life satisfaction (the Cantril ladder) and experienced well-being (feelings and emotions over the past 24 hours), hours are an important component of subjective well-being in most regions of the world.
Table 5 shows the regression results for overall job satisfaction. The table is divided up into four columns. The two left-hand side columns consider changes from 1989 to 2005, and are thus estimated on the five countries which appear in all three waves. The two right-hand side columns analyse changes from 1997 to 2005 only, and are estimated a far larger sample of countries (see Table 2). Columns 1 and 3 do not control for earnings and hours as explanatory variables, while columns 2 and 4 do.
The estimated coefficients show that men are less satisfied with their jobs than women,
ceteris paribus,6 and that older employees and the married are more satisfied. A number of the country dummy variables are significant: employees in Hungary, Japan and France are relatively miserable; the “winners” are workers in Denmark (the omitted category), Switzerland, and the USA. What interests us perhaps the most in Table 5 are the estimated
6
See Clark (1997) and Sousa-Poza and Sousa-Poza (2000).
coefficients on the 1997 and 2005 dummy variables: these reveal whether the "average" employee found their job more satisfying in later waves than in 1989. In the left-hand panel, which shows the three-wave evolution, job satisfaction fell from 1989 to 1997, but had more than recovered by 2005. When earnings and hours are controlled for, satisfaction in 2005 is the same as in 1989 (in the five countries for which we can carry out this calculation). Part of rising job satisfaction then results from higher income and lower hours of work (this is why column 1 differs from column 2; and column 3 differs from column 4).7 Previous work on the first two Work Orientations modules of the ISSP (Clark, 2005b) had shown falling job satisfaction in OECD countries across the 1990s, and had suggested that hard work was partly behind this movement. Offer (2006, p. 244) suggests that demanding and challenging work was behind a longer-run downward movement in job satisfaction in the UK and the US. Green (2006) is a careful analysis of movements in job characteristics, pointing to greater work intensity and less worker discretion as a cause of flat if not declining job satisfaction in a number of countries. The new data in the third wave of the ISSP provides some evidence of a turning point in this decline,8 and it will be of great interest to track this evolution through both continuing panel studies such as the BHPS and the German SOEP, and the putative fourth wave of the ISSP Work Orientations module, due perhaps eight years after the third wave in 2005.
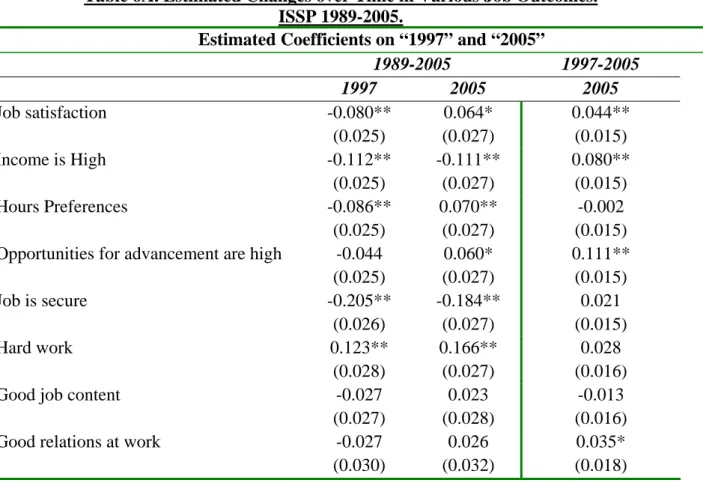
Tables 6A and 6B repeat the regression analysis in Table 5, but changing the dependent variable from overall job satisfaction to the seven “domain” measures of job outcomes presented in Table 4 and Appendix A1. This produces a lot of numbers. For ease of representation, and to keep the size of the tables down, only the estimated coefficients on the
7
The estimated coefficient on income is positive and significant, while that on hours of work is insignificant. Harter and Arora (2008) find a negative correlation between hours and their measures of both evaluative and experienced well-being. One explanation for the difference in the effect of hours is that we here consider job satisfaction, whereas Harter and Arora analyse global measures of individual well-being. They also find that the negative effect of hours of work is mitigated by the extent of “job fit” (defined as job satisfaction plus a measure of having the opportunity to do what they do best every day). The introduction of this kind of heterogeneity is a useful avenue for future research on job quality.
8
Gallie (2005) had already noted a plateau one component of job quality, work pressure, in EU countries between 1996 and 2001.
“1997” and “2005” wave dummies are shown for each of the regressions, which do however all include the same control variables as in Table 5. To set the scene, the first lines of Table 6A and 6B reproduce the estimated wave coefficients found Table 5’s overall job satisfaction regressions, showing the U-shaped pattern in job satisfaction between 1989 and 2005. The remaining lines summarise the changes in the other measures of job outcomes over the different ISSP waves.
In Table 6A, the last column shows how different measures of job quality have changed in 15 OECD countries between 1997 and 2005, without controlling for earnings or hours of work. The results here indicate that income and promotion opportunities have both improved. On the contrary, “hard work” has become more prevalent, and “job content” has become less good, although neither estimate is significant at the five per cent level. The overall net effect, as in Table 5 and the top line of Table 6A, is higher job satisfaction in 2005 than in 1997.
Table 6B repeats this analysis, but this time controlling for hours and income. Table 6A asked the question whether the average worker, given their demographic characteristics, has become more satisfied over time. Table 6B asks whether the average worker, given their demographic characteristics, and the same level of real net earnings and hours of work, has become more satisfied over time. As income has risen and hours of work have fallen in general across OECD countries over the time period analysed here, we expect the overall positive effects outlined in Table 6A to be more muted in Table 6B, and this is indeed the case.9 The positive trend on “income is high” in the last column of Table 6A becomes negative in the last column of Table 6B. Equally, the higher overall job satisfaction in 2005 than in 1997 in Table 6A disappears in Table 6B. In that sense, the improvements in job
9
There is a potential issue regarding the quality of the earnings information in the ISSP. This is one reason for carrying out the analysis of job quality both with and without earnings. Comparing the evolution of earnings in the ISSP data with OECD data casts some doubt on the reported earnings movements in France, Spain and the US. Re-estimating the key regressions (in Tables 5 and 6) without these countries did not change the qualitative conclusions regarding changing job quality over time.
satisfaction between 1997 and 2005 can be entirely explained by movements in real earnings and hours of work.
One obvious question that can be is asked here is the extent to which movements in job quality are cyclical. To investigate, we added measures of GDP growth, the unemployment rate and inflation to the regressions that are summarised in Tables 6A and 6B. The errors in these new regressions are clustered at the country-year level.
While it is probably wise to take the results as indicative, seeing as they are identified off of only a very few country-year points, the overall conclusion is that adding these Macro variables broadly changes only little the qualitative results. The Macro variables do explain the positive estimate on “2005” in the top-right corner of Table 6A. However, we already suspected that this was driven by higher incomes (which is why the corresponding estimate in Table 6B is insignificant). With respect to the different job domains, hours preferences, job security and hard work all seem to be significantly correlated with the economic cycle. Greater GDP growth increases job satisfaction and promotion opportunities, but also increases hard work and is associated with less good job content. Job security is reduced by higher unemployment, unsurprisingly. These results do suggest some role for aggregate variables in determining individual well-being at work, and this is likely a subject that warrants further research.
Table 7 presents separate results by country. These are perhaps less useful, mainly due to the small sample sizes in most countries. It is of interest to note that Hungary, despite its low “job quality” ranking in OECD countries, has shown improvement both 1989-2005 and 1997-2005. There has been, if anything, something more of a trend towards better quality jobs in Anglo-Saxon countries (Germany, USA, Canada, Great Britain) than elsewhere.
The paper so far has detailed movements in different job outcome variables. What it has not yet done is show how important these separate outcomes are for individual job satisfaction. Table 8 remedies this oversight. Here overall job satisfaction is regressed on the
various individual job quality measures (used in Tables 6A and 6B), as well as standard demographics and year and country dummies. The first column refers to the five countries observed over all three ISSP waves, and the second to the fifteen countries present in both 1997 and 2005. The estimated coefficients show that all of the domain variables are indeed correlated with overall job satisfaction; as such any changes in these domains will feed through to overall job quality (as measured here by overall job satisfaction).
It is however not straightforward to use the results in Table 8 to draw up a ranking of the different right-hand side variables. While research on the ranking of different life domains (health, job, marriage etc., as in Ferrer-i-Carbonell and Van Praag, 2004) is able to draw on standardised questions (“How satisfied are you with your X on a scale of one to seven”), we here have no such standardised scale for the explanatory variables which we can use to calculate the relative contributions of high income and job relations, for example, or of job content and hard work. Even so, we can be sure that all of them are significant correlates of overall job satisfaction.
4. The Changing Value of Self-Employment
This last topic emphasises the specific role of self-employment in determining job quality. The self-employed are something of an enigma, as they arguably do worse on many job domains. Specifically, they typically earn less but work more hours, are arguably more insecure and face greater risks. On the plus side, they do certainly enjoy more autonomy, but enjoy relatively less social contact (people don't like being with their co-workers very much, with their boss even less, but worst of all is being on your own: see Kahneman et al., 2004). Despite these apparent handicaps, the self-employed typically report higher levels of overall job satisfaction than do the employed, at least in OECD countries.
A natural interpretation of this satisfaction differential is that there are unmeasured aspects of jobs for which the self-employed score far higher than the employed. If this is so, the
question then arises of why more of the employed do not become self-employed, given that the latter seems to be a preferable status on the labour market.
This phenomenon is illustrated in Table 9. The left-hand panel of this table shows the change over time in the percentage of the ISSP sample who are self-employed (expressed as a percentage of all of those who are in work). As the ISSP samples are fairly small (see Table 1), so is the number of self-employed per country per wave, and these percentages should probably best be taken as illustrative. Although the percentage of self-employed has been rising in some countries in the ISSP data, the broad picture is of a small fall in the self-employment rate. This is consistent with the analysis of comparable LFS data in OECD (2005).
The right-hand side panel of Table 9 shows the evolution of the percentage of respondents who, in response to the question: “Suppose you were working and could choose between different kinds of jobs. Which of the following would you personally choose?” replied “Being self-employed” rather than “Being an employee”. This percentage has also been falling across the three waves of the ISSP. However, what is most interesting perhaps is that the percentage who express a preference for self-employment is systematically three or four times higher than the actual self-employment rate. Taking Table 9 at face value, there are substantial numbers of people who would prefer to be self-employed but who are currently employees.
The correlation between self-employment and overall job satisfaction is detailed in Table 10. This shows the estimated coefficients on various self-employment variables which have been added to our “standard” overall job satisfaction regressions detailed in Table 5. The results in columns 1 and 3 show that in both the long and the short dataset (1989-1997-2005 and 1997-2005 respectively) the self-employed are significantly more satisfied with their jobs. Columns 2 and 4 then add an interaction between self-employment and the year dummies to see if this positive relationship between self-employment and well-being at work has changed between 1989 and 2005. There is no significant evidence of any such evolution in the five
countries making up the long dataset between 1989 and 2005. However, for the 15 countries observed between 1997 and 2005, the interaction between self-employment and 2005 is positive and significant: in this larger sample of countries, self-employment is not only good, but is even getting better.
This might be thought to pose something of a problem. If job satisfaction is higher when self-employed, and increasingly so, why is the number of self-employed falling in parallel? One interpretation of the job satisfaction differential is in terms of matching on the labour market. Some people may really like autonomy but not dislike risk that much: they end up self-employed. Others like autonomy less, but really dislike risk: they end up employed. It is easy to parameterise utility functions such that those who choose self-employment are more satisfied than those who choose employment.10 However, in this matching or sorting story, the employed do not want to become self-employed: not only are the employed less satisfied than the self-employed, they would be even less satisfied than they are now if we forced them to change from employment to self-employment.
The matching story then does well in explaining why the job satisfaction of the self-employed might be higher than that of the self-employed in equilibrium. However, it does a much less good job of explaining the right-hand side of Table 9: the employed shouldn't want to be self-employed (because they have freely chosen employment), yet that is what it looks like they would prefer.
One interpretation that does fit is in terms of life satisfaction vs. job satisfaction. When individuals answer the preference question, they may well have only job satisfaction in mind. However, their actual choice of labour force status will be determined by life satisfaction, which might be lower for the self-employed. Working for yourself is typically associated with greater making, and Helliwell and Huang (2009) have shown that this
10
An example is given in Section 4.3 of Clark and Senik (2006).
making is positively correlated with job satisfaction but negatively correlated with life satisfaction.
A second alternative reading of Table 9 is that there are barriers to entry to self-employment: some people really want to be self-employed but can't. These barriers are often imagined in terms of difficulties in raising the necessary capital to start one's own business. This has been demonstrated by careful work showing that individuals are more likely to become self-employed after they have received a windfall gain (inheritance or lottery win): see Blanchflower and Oswald (1998). A consistent reading of Tables 9 and 10 is then that the barriers to self-employment entry have become greater over time. This would seem worthy of further research, both via subjective and objective data. Specifically, it would seem important to carry out careful country-by-country analysis to try and establish in which countries the "returns" to self-employment have risen, and see whether this ties in with what we know about differences in access to capital between countries.
5. Conclusion
This paper has analysed repeated cross-section data from a number of OECD countries to consider movements in some of the relationships between work and well-being. There are three main results. First, analysis of European data repeats the simple message that there is a wide gulf in well-being between employment and unemployment, which does not seem to result from reverse causality (whereby the intrinsically unhappy are more likely to end up unemployed). There is no evidence that individuals adapt to unemployment, which starts bad and stays bad. However, some work has uncovered empirical evidence consistent with social comparisons in unemployment: unemployment hurts less the more there is of it around. If this is the case, then greater equality in social welfare will go hand-in-hand with greater inequality in unemployment. However, despite any social comparison effect, the average
well-being gap between the employed and the unemployed remains very large. For the kind of unemployment rates that have prevailed in OECD countries over recent years, social comparison effects are arguably marginal compared to the sheer size of the psychological well-being impact of not having a job.
ISSP data from 1989, 1997 and 2005 shows that job values are quite stable over time, although there is some evidence of workers giving increasing importance to useful and helpful jobs. Regarding job outcomes, job quality mostly fell between 1989 and 1997. However the analysis of the latest 2005 wave of data reveals that job quality bounced back between 1997 and 2005. Overall job satisfaction in 2005 is actually higher than it was in 1989. Most of the different components of job quality (income, hours, promotion, relations at work, and job security) have improved in line with overall job satisfaction between 1997 and 2005. There are exceptions though: the percentage of employees who report that they work hard rose over this period, and a measure of good job content (picking up the extent to which employees think that their job is interesting, useful, helpful, and provides independence) fell over the same period, although neither estimate is significant. This latter movement is particularly interesting as “job content” picks up the job aspects that workers report as becoming increasingly important over recent years.
Last, the rate of self-employment has been falling gently in ISSP data; even so three to four times as many people say they would prefer to be employed than are actually self-employed. In job satisfaction analysis in OECD countries, the self-employed are more satisfied than are employees. Moreover, this job satisfaction "premium" from self-employment seems to be rising. One consistent interpretation of the above is that the barriers to self-employment have been growing.
Most generally, the analysis of repeated cross-section surveys across a variety of countries provides fascinating information on the evolution of the quality of workers’ lives. While the drop in job quality between 1989 and 1997 was more than reversed in 2005, more work needs
to be carried out to consider exactly how this reversal of misfortune came about. In addition, the current work has mostly considered aggregate analysis across many different countries. Yet, the movements in job quality are far from uniform: some countries have shown sharp improvements, while others have trodden water or even stagnated. Countries likely differ in many ways that are amenable to policy, including their education and employment institutions (see Davoine et al., 2008, and Gallie, 2007). The identification of just why some countries have done so well will surely help us to identify ways in which what remains an essential element of so many people’s lives can be improved.
Figure 1. Satisfaction with Work or Main Activity and Labour Force Status.
2
2.5
3
3.5
4
4.5
Satisfaction
Self-employed Employed Unemployed NLF
Labour Force Status
Source: ECHP, 1994-2001. Satisfaction measured on a one to six scale.
Figure 2. Unemployment and Life Satisfaction over Time in German Panel Data
Source: Clark et al. (2008a).
Figure 3. The Well-Being Gap between those in Work and the Unemployed (GHQE-GHQU)
and Regional Unemployment Rates.
BHPS Waves One to Seven. (Eleven Regions)
GHQ
Diff
erence
Regional Unemployment Rate
5 10 15 -1 0 1 2 3 GL91 GL92 GL93 GL94 GL95 GL96 GL97 RS91 RS92RS93 RS94 RS95 RS96 RS97 SW91 SW92 SW93 SW94 SW95 SW96 SW97 EA91 EA92 EA93 EA94 EA95 EA96 EA97 EM91 EM92 EM93 EM94 EM95 EM96 EM97 WM91 WM92 WM93 WM94 WM95 WM96 WM97 NW91 NW92 NW93 NW94 NW95 NW96 NW97 YH91 YH92 YH93 YH94 YH95 YH96 YH97 NT91 NT92 NT93 NT94 NT95 NT96 NT97 WA91 WA92 WA93 WA94 WA95 WA96 WA97 SC91 SC92 SC93 SC94 SC95 SC96 SC97
Key: GL = Greater London, RS = Rest of the South East, SW = South West, EA = East Anglia, EM = East Midlands, WM = West Midlands, NW = North West, YH = Yorkshire and Humberside, NT = North, WA = Wales, SC = Scotland.
Source: Clark (2003).
Appendix A1. ISSP Variable Definitions
1) Pay
Objective measure: Respondent’s monthly net earnings, converted to US dollars using
Purchasing Power Parities from the OECD (http://www.oecd.org/dataoecd/61/56/39653523.xls). All figures are expressed in real 1989
values by deflating for US CPI inflation (ftp://ftp.bls.gov/pub/special.requests/cpi/cpiai.txt). The following countries have their gross earnings converted to net:
1989 - GB, USA, Norway;
1997 - GB, USA, Norway, Sweden, New Zealand, Italy, Canada, Japan, France, Denmark, Switzerland
2005 - GB, USA, Norway, Sweden, New Zealand, Canada, Japan, France, Denmark, Switzerland.
These conversions are carried out using the OECD tax database
(http://stats.oecd.org/OECDStat_Metadata/ShowMetadata.ashx?Dataset=AWCOMP_OLD&S
howOnWeb=true&Lang=en). This provides data for 1997 to 2004. The 1997 tax rates were used to convert the 1989 and 1997 ISSP data from gross to net as necessary, and that from 2004 to convert the 2005 ISSP data.
Subjective measure: Income is High. "My income is high" - strongly agree or agree. 2) Hours of work
Objective measure: Weekly hours of work.
Subjective measure: Would Like to Spend Less or More Time in Job. “Suppose you could change the way you spend your time, spending more time on some things and less time on others. Which of the things on the following list would you like to spend more time on, which would you like to spend less time on and which would you like to spend the same amount of time on as now”?
- A bit less time or much less time in a paid job (overwork variable) - A bit more time or much more time in a paid job (underwork variable) 3) Future prospects- promotion and job security
Opportunities for Advancement are High: My opportunities for advancement are high - strongly agree or agree.
Job Secure. My job is secure - strongly agree or agree. 4) How difficult is the job?
Hard Work. Based on answers to the following four questions. How often do you:
- come home from work exhausted? - have to do hard physical work? - find your work stressful? - work in dangerous conditions?
All of which are coded as: 1. Always
2. Often 3. Sometimes 4. Hardly ever 5. Never
Cronbach’s alpha statistic is a way of evaluating the reliability of an additive scale created over a number items. It measures the correlation between the scale and the underlying factor. The alpha statistic over these four elements is 0.62. Dichotomous variables were created, with 1 representing Always, Often or Sometimes, and 0 representing Hardly ever or Never. The
sum of these four dummies (analogous to the Caseness scale of individual well-being in Psychology) counts the number of "bad" job outcomes with respect to difficulty. The value zero corresponds to no bad outcomes, and four to jobs which are at least sometimes unpleasant on all of the criteria above. A dummy variable was created for workers reporting three or more such bad outcomes. The stress at work question was not asked in the USA in 1997.
5) Job content: interest, prestige and independence
Good Job Content. Based on answers to the following four questions.
- My job is interesting
- In my job I can help other people - My job is useful to society
- I can work independently
All of these are coded as: 1. Strongly agree 2. Agree
3. Neither agree nor disagree 4. Disagree
5. Strongly disagree
Cronbach’s alpha over these four elements is 0.69. Dichotomous variables were created, with 1 representing Strongly Agree or Agree. The sum of these four variables is a measure of good job content. A dummy variable was created for workers reporting positive job content on all four aspects.
6) Interpersonal relationships
Good Relations at Work. Based on answers to the following two questions:
- Relations at the respondent's workplace: Between management and employees - Relations at the respondent's workplace: Between workmates / colleagues
Both of these are coded as: 1. Very good
2. Quite good
3. Neither good nor bad 4. Quite bad
5. Very bad
Cronbach’s alpha over these two elements is 0.66. A dummy variable was created for those reporting Very Good or Quite Good relations with both management and with colleagues.
Appendix A2. ISSP Distribution of Job Satisfaction Job Satisfaction Countries in 1989, 1997 and 2005 (5) Countries in 1997 and 2005 (15) 1 0.74 0.73 2 1.4 1.47 3 4.31 4.74 4 11.59 11.85 5 41.97 39.39 6 27.64 29.43 7 12.36 12.39
Table 1. Well-Being and a) Regional Unemployment, and b) Partner’s Unemployment.
Labour Market Situation
Predicted Probability of High GHQ (%)
Employed and 5% Unemployment Region 60.2 Employed and 10% Unemployment Region 57.6 Unemployed and 5% Unemployment Region 30.8 Unemployed and 10% Unemployment Region 38.4 Both Individual and Partner Employed 57.9 Individual Employed and Partner Unemployed 55.6 Individual Unemployed and Partner Employed 30.9 Both Individual and Partner Unemployed 40.0
Notes: These calculations are based on the regression results using BHPS data in Clark (2003). High GHQ means a score of 11 or 12 on the 0 to 12 GHQ scale.
Table 2. Number of employees interviewed in OECD countries: ISSP Module on Work Orientations. 1989, 1997 and 2005.
1989 1997 2005 West Germany 622 648 531 Great Britain 675 545 469 USA 838 800 961 Hungary 641 626 437 Netherlands 681 1018 Italy 586 475 Norway 1305 1366 846 Sweden 793 866 Czech Republic 526 667 Poland 564 New Zealand 695 812 Canada 546 520 Japan 607 428 Spain 387 556 France 700 1084 Portugal 843 1012 Denmark 600 1092 Switzerland 1727 662 Total 5348 13466 10943
Table 3. Job Values. ISSP 1989, 1997 and 2005
Job Values: Percentage Saying "Very Important" WOMEN
1989 1997 2005 1997 2005
High Income 20.5 19.9 21.1 18.9 ** 23.7
Flexible Working Hours 19.5 18.7 17.7 18.4 ** 21.4 Good Opportunities for Advancement 23.0 20.6 21.7 18.8 ** 22.7
Job Security 61.4 62.4 61.2 58.0 58.2
Interesting Job 48.2 49.7 50.1 52.7 * 55.2
Allows to Work Independently 28.7 31.0 28.7 31.7 32.2 Allows to Help Other People 22.7 * 25.5 ** 29.5 27.2 ** 30.9 Useful to Society 25.4 24.9 ** 31.2 24.5 ** 29.5
MEN
1989 1997 2005 1997 2005
High Income 24.4 22.8 24.7 20.7 ** 26.3
Flexible Working Hours 14.1 13.7 ** 17.6 15.0 ** 19.8 Good Opportunities for Advancement 22.4 * 19.5 ** 24.5 18.7 ** 23.2
Job Security 57.1 58.6 59.5 54.9 53.2
Interesting Job 45.6 47.0 48.2 50.1 * 50.9
Allows to Work Independently 31.6 30.8 * 34.0 32.1 33.9 Allows to Help Other People 15.4 15.3 ** 24.5 18.2 * 22.7 Useful to Society 22.1 ** 17.1 ** 26.0 20.3 ** 23.7 Notes: Weighted Data; ** (*) = significant difference by year at the one (five) per cent level.
Table 4. Job Outcomes. ISSP 1989, 1997 and 2005
Job Outcomes: Percentage Reporting the Characteristic in Question WOMEN
1989 1997 2005 1997 2005
Income is high 15.3 15.5 16.4 16.0 ** 19.0
Prefer to spend less time in their job 35.4 ** 42.4 ** 37.0 39.3 * 41.4 Prefer to spend more time in their job 13.7 ** 9.6 * 11.9 10.2 10.3 Opportunities for advancement are high 18.2 17.6 ** 23.4 17.7 ** 22.3
Job is secure 72.7 ** 66.8 * 70.7 63.6 ** 66.4
Hard work 37.5 ** 42.4 41.1 40.2 40.9
Good job content 42.3 * 45.9 49.3 43.7 * 45.9
Good relations at work 68.4 66.8 67.6 66.8 65.6
High job satisfaction 39.5 37.4 ** 45.9 41.1 42.0
MEN
1989 1997 2005 1997 2005
Income is high 25.8 * 23.6 ** 27.6 24.2 ** 29.5
Prefer to spend less time in their job 37.4 ** 41.5 ** 36.7 41.0 40.6 Prefer to spend more time in their job 12.2 10.9 12.2 8.9 8.8 Opportunities for advancement are high 23.0 * 20.2 ** 26.5 21.8 ** 27.5
Job is secure 70.1 ** 63.5 64.0 61.2 * 63.4
Hard work 54.2 52.1 55.2 50.6 51.4
Good job content 41.6 40.2 * 43.9 41.5 41.6
Good relations at work 67.3 64.6 ** 69.4 65.8 66.4
High job satisfaction 38.2 35.9 ** 44.7 40.3 ** 43.3 Notes: Weighted Data; ** (*) = significant difference by year at the one (five) per cent level.
See Appendix A1 for the definition of the ISSP job outcome variables.
Table 5. Overall Job Satisfaction Regressions. ISSP 1989, 1997 and 2005.
1989-2005 1997-2005
Standard With earnings
and hours
Standard With earnings
and hours 2005 0.064* 0.027 0.044** 0.026 (0.027) (0.030) (0.015) (0.017) 1997 -0.080** -0.079** (0.025) (0.029) Male -0.066** -0.136** -0.023 -0.066** (0.021) (0.025) (0.015) (0.017) 30 to 44 0.030 -0.008 0.026 -0.001 (0.028) (0.031) (0.021) (0.023) 45 to 65 0.123** 0.066* 0.123** 0.079** (0.030) (0.033) (0.022) (0.024) Married 0.094** 0.073** 0.129** 0.099** (0.023) (0.025) (0.016) (0.017) Years of Education 0.001 -0.007 0.006** 0.000 (0.004) (0.004) (0.002) (0.002)
Earnings ($000) per month 0.103** 0.089**
(0.015) (0.009)
Hours per week 0.001 0.001
(0.001) (0.001) West Germany 0.040 0.050 -0.269** -0.313** (0.032) (0.035) (0.042) (0.044) Great Britain -0.069* -0.063 -0.390** -0.432** (0.032) (0.034) (0.043) (0.045) USA 0.144** 0.133** -0.166** -0.229** (0.029) (0.031) (0.038) (0.040) Hungary -0.355** -0.236** -0.610** -0.619** (0.032) (0.047) (0.043) (0.049) Norway -0.343** -0.389** (0.036) (0.038) Sweden -0.399** -0.415** (0.038) (0.040) Czech Republic -0.493** -0.533** (0.042) (0.047) New Zealand -0.379** -0.440** (0.039) (0.049) Canada -0.393** -0.450** (0.044) (0.046) Japan -0.738** -0.771** (0.044) (0.047)
Spain -0.256** -0.278** (0.045) (0.053) France -0.568** -0.578** (0.038) (0.039) Portugal -0.316** -0.345** (0.038) (0.042) Switzerland -0.018 -0.117** (0.036) (0.039) Observations 10554 8853 21045 17834 Log-Likelihood -15245.09 -12791.12 -30706.47 -25944.07 Log-Likelihood at zero -15413.98 -12924.14 -31134.28 -26374.64 Notes: Standard errors in parentheses. * significant at 5%; ** significant at 1%.
Table 6A. Estimated Changes over Time in Various Job Outcomes. ISSP 1989-2005.
Estimated Coefficients on “1997” and “2005”
1989-2005 1997-2005 1997 2005 2005 Job satisfaction -0.080** 0.064* 0.044** (0.025) (0.027) (0.015) Income is High -0.112** -0.111** 0.080** (0.025) (0.027) (0.015) Hours Preferences -0.086** 0.070** -0.002 (0.025) (0.027) (0.015)
Opportunities for advancement are high -0.044 0.060* 0.111**
(0.025) (0.027) (0.015)
Job is secure -0.205** -0.184** 0.021
(0.026) (0.027) (0.015)
Hard work 0.123** 0.166** 0.028
(0.028) (0.027) (0.016)
Good job content -0.027 0.023 -0.013
(0.027) (0.028) (0.016)
Good relations at work -0.027 0.026 0.035*
(0.030) (0.032) (0.018)
Notes: Standard errors in parentheses. * significant at 5%; ** significant at 1%. Hours preferences: workers would prefer to work more hours, fewer hours, or the same hours. Fewer hours is coded as 1, the same hours is coded as 2, and more hours is coded as 3. The regressions include the same control variables as those reported in Table 5.
Table 6B. Estimated Changes over Time in Various Job Outcome Measures, Controlling for Earnings and Hours of Work. ISSP 1989-2005.
Estimated Coefficients on “1997” and “2005”
1989-2005 1997-2005 1997 2005 2005 Job satisfaction -0.079** 0.027 0.026 (0.029) (0.030) (0.017) Income is High -0.090** -0.207** -0.033 (0.029) (0.031) (0.018) Hours Preferences -0.090** 0.056 0.019 (0.030) (0.031) (0.017)
Opportunities for advancement are high -0.029 0.038 0.075**
(0.029) (0.031) (0.017)
Job is secure -0.162** -0.167** -0.012
(0.030) (0.031) (0.017)
Hard work 0.088** 0.197** 0.074**
(0.033) (0.031) (0.018)
Good job content 0.024 0.056 -0.009
(0.030) (0.032) (0.018)
Good relations at work 0.041 0.045 0.022
(0.035) (0.037) (0.020)
Notes: Standard errors in parentheses. * significant at 5%; ** significant at 1%. Hours preferences: workers would prefer to work more hours, fewer hours, or the same hours. Fewer hours is coded as 1, the same hours is coded as 2, and more hours is coded as 3. The regressions include the same control variables as those reported in Table 5.
Table 7. Change in Overall Job Satisfaction by Country. ISSP 1989-1997-2005. Country 1989-1997 1989-2005 1997-2005 West Germany - + (10%) + Great Britain - (10%) 0 + USA 0 0 + (10%) Hungary 0 + + Norway - 0 0 Sweden 0 Czech Republic 0 New Zealand 0 Canada + (10%) Japan 0 Spain - France - (10%) Portugal 0 Denmark - Switzerland +
Note: This table summarises the results from single-country estimation of the regression reported in Table 5. Significant rises in job satisfaction are indicated by a “+” and falls in job satisfaction by a “-”.
1989-2005 1997-2005
High Income 0.182** 0.149**
(0.014) (0.009)
Want to Spend Less Time In Job -0.315** -0.294**
(0.026) (0.018)
Want to Spend More Time In Job -0.068 -0.070**
(0.036) (0.027)
Good Promotion Opportunities 0.177** 0.158**
(0.013) (0.009)
Job Secure 0.108** 0.079**
(0.012) (0.008)
Hard Work -0.092** -0.112**
(0.012) (0.008)
Good Job Content 0.282** 0.283**
(0.011) (0.008)
Good Relations at Work 0.515** 0.481**
(0.019) (0.013)
N 8427 17696
Log Likelihood -10478.70 -22580.31
Log Likelihood at zero -12179.60 -25996.41
Pseudo-R2 0.140 0.131
Table 8. Overall Job Satisfaction and Job Quality Components (ISSP 1989, 1997 and 2005)
Table 9. Self-Employment in the ISSP 1989-1997-2005.
1989
1997
2005
1989
1997
2005
West Germany
11.0%
10.2%
10.4%
51.4%
61.7%
44.3%
Great Britain
11.7%
15.2%
12.9%
49.6%
46.2%
48.7%
USA
12.1%
13.4%
13.3%
63.5%
72.3%
64.4%
Hungary
5.9%
14.5%
9.0%
42.2%
58.8%
39.1%
Norway
5.1%
9.8%
10.9%
26.6%
27.5%
28.4%
Sweden
10.7%
10.3%
38.0%
31.8%
Czech Republic
10.6%
14.9%
42.8%
30.7%
New Zealand
9.2%
15.1%
63.4%
55.0%
Canada
15.2%
8.6%
58.7%
55.6%
Japan
16.8%
11.4%
42.7%
33.4%
Spain
3.4%
14.3%
42.9%
33.9%
France
8.9%
8.4%
42.7%
40.6%
Portugal
23.6%
14.1%
76.3%
51.8%
Denmark
6.5%
8.5%
26.1%
28.4%
Switzerland
12.1%
10.1%
65.6%
47.2%
Percentage of Working who
are Self-Employed
Percentage of Working who
Prefer Self-Employment to
Employment
Table 10. Self-Employment and Overall Job Satisfaction. ISSP 1989-1997-2005.
1989-2005 1989-2005 1997-2005 1997-2005 Self-Employment 0.327** 0.377** 0.352** 0.302** (0.034) (0.062) (0.023) (0.032) Self-Employment*1997 -0.062 (0.085) Self-Employment*2005 -0.076 0.105* (0.081) (0.046)
* = Significantly different from zero at the five per cent level; ** = Significantly different from zero at the one per cent level;
References
Benesch, C., Frey, B.S., and Stutzer, A. (2006). "TV Channels, Self Control and Happiness". University of Zurich, mimeo.
Blanchflower, D.G. and Oswald, A.J. (1998). "What Makes an Entrepreneur?". Journal of Labor Economics, 16, 26-60.
Blanchflower, D.G. and Oswald, A.J. (2004). "Well-Being over Time in Britain and the USA". Journal of Public Economics, 88, 1359-1386.
Blanchflower, D.G., Oswald, A.J. and Van Landeghem, B. (2009). "Imitative Obesity and Relative Utility". Journal of the European Economic Association, forthcoming.
Clark, A.E. (1997). "Job Satisfaction and Gender: Why are Women so Happy at Work?"
Labour Economics, 4, 341-372.
Clark, A.E. (2003). "Unemployment as a Social Norm: Psychological Evidence from Panel Data". Journal of Labor Economics, 21, 323-351.
Clark, A.E. (2005a). "What Makes a Good Job? Evidence from OECD Countries". In S. Bazen, C. Lucifora and W. Salverda (Eds.), Job Quality and Employer Behaviour. Basingstoke: Palgrave Macmillan.
Clark, A.E. (2005b). "Your Money or Your Life: Changing Job Quality in OECD Countries".
British Journal of Industrial Relations, 43, 377-400.
Clark, A.E., Diener, E., Georgellis, Y. and Lucas, R. (2008a). "Lags and Leads in Life Satisfaction: A Test of the Baseline Hypothesis". Economic Journal, 118, F222–F243. Clark, A.E. and Etilé, F. (2008). "Happy House: Spousal Weight and Individual Well-Being".
PSE, mimeo.
Clark, A.E., Frijters, P. and Shields, M. (2008b). "Relative Income, Happiness and Utility: An Explanation for the Easterlin Paradox and Other Puzzles". Journal of Economic Literature, 46, 95-144.
Clark, A.E., Knabe, A. and Rätzel, S. (2008c). "Unemployment as a Social Norm in Germany". PSE, Discussion Paper 2008-45.
Clark, A.E., and Oswald, A.J. (1996). "Satisfaction and Comparison Income". Journal of Public Economics, 61, 359-81.
Clark, A.E. and Senik, C. (2006). "The (Unexpected) Structure of "Rents" on the French and British Labour Markets". Journal of Socio-Economics, 35, 180-196.
Davoine, L., Erhel, C. and Guergoat-Larivière, M. (2008). "Monitoring quality in work: European Employment Strategy indicators and beyond". International Labour Review,
147, 163-198.
Di Tella, R. and MacCulloch, R. (2006). "Some Uses of Happiness Data in Economics".
Journal of Economic Perspectives, 20, 25-46.
Diener, E., Lucas, R. and Scollon, C. (2006). "Beyond the Hedonic Treadmill". American Psychologist, 61, 305-314.
Fujita, F. and Diener, E. (2005). "Life Satisfaction Set Point: Stability and Change". Journal of Personality and Social Psychology, 88, 158-164.
Gallie, D. (2005). "Work Pressure in Europe 1996-2001: Trends and Determinants". British Journal of Industrial Relations, 43, 351-375.
Gallie, D. (Ed.). (2007). Employment Regimes and the Quality of Work. Oxford: Oxford University Press.
Glenn, N. and Weaver, C. (1981). "The Contribution of Marital Happiness to Global Happiness". Journal of Marriage and the Family, 43, 161-168.
Green, F. (2006). Demanding Work: The Paradox of Job Quality in the Affluent Economy. Princeton: Princeton University Press.
Gruber, J. and Mullainathan, S. (2005). "Do Cigarette Taxes Make Smokers Happier?".
Advances in Economic Analysis & Policy, 5, Article 4.
Harter, J. and Arora, R. (2008). "The impact of time spent working and job fit on well-being around the world". The Gallup Organization, mimeo.
Harter, J., Hayes, T. and Schmidt, F. (2002). "Business-Unit-Level Relationship Between Employee Satisfaction, Employee Engagement, and Business Outcomes: A Meta-Analysis". Journal of Applied Psychology, 87, 268–279.
Harter, J., Schmidt, F., Killham, E. and Asplund, J. (2006). "Q12® Meta-Analysis". The Gallup Organization, mimeo.
Helliwell, J.F. and Huang, H.