Repositório ISCTE-IUL
Deposited in Repositório ISCTE-IUL:
2018-06-08
Deposited version:
Post-print
Peer-review status of attached file:
Peer-reviewed
Citation for published item:
Oliveira, M. D N. T., Ferreira, F. A. F., Pérez-Bustamante, G. O. & Jalali, M. S. (2017). A multiple criteria evaluation system for bankruptcy prediction of small and medium-sized enterprises. In
Enrique Claver Cortés, Diego Quer Ramón (Ed.), XXVII Jornadas Hispano-Lusas de Gestión-Científica. Benidorm: Universidad de Alicante.
Further information on publisher's website:
--Publisher's copyright statement:
This is the peer reviewed version of the following article: Oliveira, M. D N. T., Ferreira, F. A. F., Pérez-Bustamante, G. O. & Jalali, M. S. (2017). A multiple criteria evaluation system for bankruptcy
prediction of small and medium-sized enterprises. In Enrique Claver Cortés, Diego Quer Ramón (Ed.), XXVII Jornadas Hispano-Lusas de Gestión-Científica. Benidorm: Universidad de Alicante.. This article may be used for non-commercial purposes in accordance with the Publisher's Terms and Conditions for self-archiving.
Use policy
Creative Commons CC BY 4.0
The full-text may be used and/or reproduced, and given to third parties in any format or medium, without prior permission or charge, for personal research or study, educational, or not-for-profit purposes provided that:
• a full bibliographic reference is made to the original source • a link is made to the metadata record in the Repository • the full-text is not changed in any way
The full-text must not be sold in any format or medium without the formal permission of the copyright holders. Serviços de Informação e Documentação, Instituto Universitário de Lisboa (ISCTE-IUL)
STRATEGY
A MULTIPLE CRITERIA EVALUATION SYSTEM FOR BANKRUPTCY
PREDICTION OF SMALL AND MEDIUM-SIZED ENTERPRISES
MANUEL D. N. T. OLIVEIRA
ISCTE Business School, BRU-IUL, University Institute of Lisbon Avenida das Forças Armadas, 1649-026 Lisboa, Portugal
mdnto@iscte.pt
FERNANDO A. F. FERREIRA
ISCTE Business School, BRU-IUL, University Institute of Lisbon Avenida das Forças Armadas, 1649-026 Lisboa, Portugal
&
Department of Finance, Insurance and Real Estate
Fogelman College of Business and Economics, University of Memphis Memphis, TN 38152-3120, USA
fernando.alberto.ferreira@iscte.pt or fernando.ferreira@memphis.edu
GUILLERMO O. PÉREZ-BUSTAMANTE ILANDER Faculty of Economics and Business, University of Oviedo,
Avda. Del Cristo s/n, 33007 Oviedo, Spain
gperez@uniovi.es
MARJAN S. JALALI
ISCTE Business School, BRU-IUL, University Institute of Lisbon Avenida das Forças Armadas, 1649-026 Lisboa, Portugal
marjan.jalali@iscte.pt
ABSTRACT
The global financial crisis has shown the ability to predict bankruptcy to be a vital management skill, and that the methodologies used for that purpose should be as close to reality as possible. This study aims to develop a multiple criteria system to predict bankruptcy in small and medium-sized enterprises (SMEs). It combines cognitive mapping with the measuring attractiveness by a categorical based evaluation technique (MACBETH), resulting in a more complete and transparent process for evaluating SMEs (and their risk of bankruptcy). What differentiates this framework from previous ones is the fact that it is based on information obtained directly from managers and bank analysts who deal with this type of adversity on a daily basis. The results highlight the importance of financial and strategic aspects, among others; and demonstrate how cognitive mapping can improve the understanding of the decision situation at hand, while MACBETH facilitates the calculation of trade-offs among evaluation criteria.
KEYWORDS: Bankruptcy Prediction; Cognitive Mapping; MCDA; SMEs.
RESUMO
A previsão de falência tem, nos últimos anos, demonstrado ser uma funcionalidade vital no suporte à tomada de decisão e à gestão empresarial. A sua importância cresce associada à rápida atualização dos mercados e fruto da crescente exigência dos consumidores, que colocam as pequenas e médias empresas (PMEs) diariamente à prova. Tal cenário conduz à necessidade de desenvolver modelos de avaliação da performance o mais próximos possível da realidade e, neste sentido, a presente dissertação propõe-se a desenvolver um sistema de avaliação multicritério que suporte a previsão de falência em PMEs. Face à diversidade de modelos existentes para o mesmo fim, o fator diferenciador decorre do facto de, neste estudo, a informação provir diretamente de gestores e analistas bancários, que lidam no seu dia-a-dia com este tipo de adversidade. Na prática, dada a necessidade das metodologias utilizadas na previsão de falência serem o mais robustas
possível, de modo a que as classificações obtidas sejam bem-informadas, o presente estudo combina técnicas de cartografia cognitiva com a abordagem Measuring Attractiveness by a Categorical Based Evaluation Technique (MACBETH), tendo como finalidade tornar os processos de avaliação e de previsão de falência em PMEs mais completos e transparentes. Os resultados práticos e as implicações para a gestão são também objeto de análise e discussão.
PALAVRAS-CHAVE: Análise Multicritério; Apoio à Decisão; PMEs; Previsão de Falência;
Mapas Cognitivos; MACBETH.
1. INTRODUCTION
The economic developments of recent decades have put bankruptcies and their consequences for economic well-being under the spotlight; to the extent that it has been argued that the number of companies in default can be an indicator of a country’s development (Zopounidis and Dimitras, 1998; Ferreira et al., 2013; Gonçalves et al., 2016). This, in turn, has highlighted the need for mechanisms for the assessment of bankruptcy risk; particularly in the aftermath of the global financial crisis, and its effect on small and medium enterprises (SMEs).
The need for such assessment mechanisms notwithstanding, Gordini (2014) notes that the risk prediction models currently in use with regard to and within SMEs are often inaccurate or even non-existent, because the information systems underlying these models are not adapted to the characteristics and specificities of SMEs. In the absence of more tailored systems, SMEs are not able to reflect on their performance and results in as much detail or with as much regularity as large companies; nor is their performance as transparent to their parties. As such, several authors (e.g. Altman and Sabato 2007; Ciampi and Gordini, 2013; Zopounidis et al., 2015) have emphasized the need for more consistent models to assess the risk of failure of SMEs. Such models should allow both the number of bankruptcies and the information asymmetries between banks and companies to be reduced. This, in turn, can be expected to lead to greater levels of confidence, lower interest rates, higher financing facilities and better access to credit, thus potentially generating higher economic growth (Lopez and Saidenberg, 2000).
There are difficulties associated with the development of bankruptcy risk prediction models for SMEs, however. These relate to: (1) the fact that SMEs typically make less information publicly available than large companies (Ciampi and Gordini, 2013); and (2) the subjectivity of managerial decisions. Managers can influence company results through their leadership characteristics, management style, attitude toward consumers or even level of risk aversion, which makes it difficult to interpret managers’ choices and/or translate them into numbers (Morrison et al., 2003; Ciampi and Gordini, 2013). In addition, any such performance or bankruptcy predictions would also need to take into account more qualitative variables, such as managerial experience or competence, as well uncontrollable elements, such as external environment conditions (Zopounidis and Dimitras, 1998); which means we are dealing with highly complex and inherently subjective decision situations.
According to Bălan (2012), the ultimate goal of a risk of bankruptcy forecasting model should be to allow the manager to see if s/he will be able to obtain financing from banks or other financial institutions; or whether, on the other hand, s/he needs to rethink the company’s capital structure and/or adopt a new strategy in order to remain solvent. Thus, in using such models, managers reduce their risk of failure, and are able to more clearly identify the organizations’ strength and weaknesses, to either persist with their current financial strategies or adjust them. As such, the current study aims to identify and articulate the factors that can best contribute to the development of a bankruptcy prediction model tailored to the needs of SMEs.
From a methodological point of view, this is done through the integrated use of cognitive maps with the multiple criteria decision analysis (MCDA) approach. Indeed, the importance of cognitive maps in supporting the structuring of complex decision problems is widely recognized, as is their ability to represent and facilitate the understanding of the cause-and-effect relationships between decision criteria (Belton and Stewart, 2002; Tegarden and Sheetz, 2003; Eden, 2004; Canas et al., 2015). The MCDA approach, in turn, allows weights to be ascribed to those criteria, and trade-offs between them to be calculated (Roy, 1985; Bana e Costa et al., 2001; Belton and Stewart, 2002; Martins et al., 2015; Ferreira and Santos, 2016). The next section presents an overview of the relevant literature, followed in section three by a description of the methodological approach adopted. Section four then presents the key results, indicating the most common
and/or significant variables for the development of a bankruptcy prediction model. Finally, section five concludes the paper, presenting its limitations and suggestions for further research.
2. LITERATURE REVIEW
There are many interested parties in what pertains to an organization’s state of solvency or insolvency. It is therefore important to try to determine the underlying causes of such states. Watson and Everett (1998) and Han et al. (2012) identify the most frequently cited causes of bankruptcy in the literature as those relating to market elements, such as a fall in consumption levels or increased competition; and factors linked to the macro-level external environment, such as financial or political crises. Undoubtedly, however, there are many more variables underlying such outcomes.
The first bankruptcy prediction methods were multivariate models, initially developed using discriminant analysis (Bellovary et al., 2007). This allowed organizations to be classified as bankrupt or not bankrupt, based on the ratios that were analyzed. With the emergence, in the 1970s, of non-linear logistic regression analysis, bankruptcy prediction models underwent some changes. This type of analysis was different, because although it still classified companies as bankrupt or not, it did so based on the predicted probability of these events occurring. Over time, yet another change in the type of models used occurred, this time with the emergence of neural networks. According to Bellovary et al. (2007), these were built so as to replicate the human characteristic of pattern recognition. Designed as neurons, these networks analyze inputs and try to find patterns in order to develop models capable of generating decisions. The most common is the Multi-Layer Perceptron (MLP) network. Table 1 presents a set of studies and applications in this field, as well as their main contributions and limitations.
Table 1 – Contributions and limitations of bankruptcy prediction models.
AUTHOR METHOD CONTRIBUTIONS LIMITATIONS
Beaver (1966) Univariate Discriminant Analysis
Demonstrated the importance of studying bankruptcy predictions, and led to a “boom” in the development of such models.
Ambiguity arising from the individual analysis of data. Poor source of information.
Altman (1968) Multivariate Discriminant
Analysis Solved the problem of ambiguity in univariate analysis.
Used only financial data.
Calculation of coefficients through empirical tests. Poor source of information.
Ohlson (1980) Logit Bypassed the assumption of normality of the variables. Used only financial data. Lost precision.
Zmijewski (1984) Probit Overcame the problem of the influence of the sample on model development.
Was better at identifying organizations with financial difficulties than organizations at risk of bankruptcy. Frydman et al. (1985)
Recursive Partitioning Algorithm (RPA) –
Decision Tree
Reduced the cost of errors. Considered discreet groups.
Did not allow comparisons between organizations.
Ronald et al. (1986) ANN – Back-Propagation Network
Model in continuous learning. Did not assume normality of variables.
Lack of transparency with regard to the use of the variables in the net of correlations.
Shin et al. (2005) Support Vector Machines (SVM)
Good for generalizations. Generate excellent results.
Choice of the kernel function, which allows the sample to be reduced.
Slow development. Discreet data.
Hu and Chen (2011) MCDA – PROMETHEE II
Exceeded previous models in terms of precision for two and three years prior to bankruptcy.
Served as a good decision support for credit attribution.
Could not go beyond three years prior to bankruptcy. The cut-off points did not distinguish classes of risk.
Andrés et al. (2011)
Fuzzy c-means and Multivariate Adaptive Regression Splines (MARS)
Used hybrid methods able to generate better results. Repeated probability classifications for better results.
Did not assess organizations free of risk; only those in risk, and so could not generate ratings for credit concession to profitable businesses.
du Jardin (2015)
Discriminant analysis, logit, survival analysis and ANN
– MLP
Increased data reliability with a smaller number of indicators.
Divided organizations into groups and applied the methods accordingly.
Defined prototypical bankruptcy processes to differentiate between classes of risk, however, did not use these to evaluate organizations.
Iturriaga and Sanz (2015) ANN – MLP e Self-organized maps (SOMs)
Describes the critical characteristics of banks in trouble. Developed a visual tool.
Exceeded previous methods.
Required many complex calculations. Did not consider macroeconomic factors.
The studies described in Table 1 reflect the difficulties found in defining the variables in bankruptcy risk assessment models, which stem from the inherent complexity and subjectivity of such evaluations. In some cases, the models were not able to take into account potentially important variables for bankruptcy forecasting, and in other cases, such variables had to be excluded, despite the fact that they might have increased the models’ explanatory power. The other challenge apparent in Table 1 is that of assigning weights and calculating trade-offs between variables. There appears to be room, then, for the application of further methodological approaches. The one proposed in the current study encompasses the integrated use of cognitive mapping with multiple criteria decision support techniques. Although there is no such thing as a perfect methodology, such that new proposals should be seen as complementing rather than trying to replace previous models, we believe the combination of methodologies proposed here can help overcome some of the limitations of previous contributions (for discussion, see Smith and Goddard, 2002; Santos et al., 2008). In particular, cognitive maps not only allow for a comprehensive identification of variables (in this case, the determinants predictive of bankruptcy), but can also provide the basis for the definition of the variables to be included in an evaluation framework. The use of multiple criteria techniques, in turn, allows weights to be allocated to these variables, in order that they can be ranked. Indeed, it has been argued that combining methodologies can produce significant benefits, because real-world problems are inevitably multidimensional, and different methodologies are often more effective at different stages of the process of decision support (Mingers and Rosenhead, 2004; Howick and Ackermann, 2011). In addition, the application of different methods can allow the contributions of previous approaches to be integrated for the generation of new developments.
The next section presents the methodology used in the current study, namely: the combined used of cognitive maps with the measuring attractiveness by a categorical based evaluation technique (MACBETH).
3. METHODOLOGY
Figure 1 illustrates the articulation of the methodological procedures followed in this study.
Figure 1 – Structure of the methodological processes. Source: Ensslin et al. (2000, adap.).
Because they fall within the scope of MCDA (see Belton and Stewart, 2002), the methodological procedures followed in this study can be divided into three main stages: (1) the structuring phase, which corresponds to the problem definition stage, through the use of cognitive mapping techniques; (2) the evaluation phase, in which the MACBETH technique is applied to obtain value functions and calculate trade-offs between evaluation criteria; and (3) the recommendations phase, where the results obtained are considered and suggestions formulated accordingly.
3.1. Brief Background on Cognitive Mapping
The epistemological basis of this study is constructivist in nature. Constructivism is based on the idea that knowledge must be built by the learner, rather than shaped by the ideas of the person conveying it (Ben-Ari and Yeshno, 2006; Porcaro, 2010).
One of the tools that can aid the process of knowledge acquisition, and the consequent collaborative problem solving, is cognitive mapping. According to Eden (2004), cognitive maps draw what someone thinks about a particular problem. The result is a visual “network of nodes and arrows, where the direction of the arrow implies believed causality” (Eden, 2004: 673). Figure 2 illustrates the functional logic of a cognitive map, where the dots represent concepts and the arrows represent cause-and-effect relationships between those concepts.
Figure 2 – Functional logic of a cognitive map. Source: Eden (2004: 676).
The process of developing a cognitive map is based on the negotiation between the facilitator (i.e. the scientist or researcher) and the decision maker/s (Eden, 2004), and encompasses three stages: “eliciting the different views and belief sets as individual cognitive maps, drawing together this expert opinion in the form of a composite map and, using the composite map in a work-shop setting to explore the policy arena and the possible policy options” (Eden, 2004: 618).
As a methodology, cognitive mapping is characterized by its ability to: (1) deal with both qualitative and quantitative factors; (2) structure difficult or complex decision problems; and (3) provide support for the working group, so that it can be of use for the development and implementation of strategic directions. Cognitive maps thus allow subjectivity to be incorporated into the decision making process, and are able to identify cause-and-effect relationships between concepts.
3.2. The MACBETH Approach
The aim of the MACBETH technique is to measure the difference in attractiveness between choice alternatives, based on a series of non-numerical pairwise comparisons (Bana e Costa and Vansnick, 1994; Bana e Costa et al., 2012). The technique encompasses seven categories of difference of attractiveness, namely: C0 – null (indifference); C1 – very weak; C2 – weak; C3 – moderate; C4 – strong; C5 – very strong; and C6 – extreme; and uses qualitative judgments of difference in attractiveness to order the alternatives. This evaluation of alternatives or potential actions is one of the main stages of the decision process (“building interval value scales is a crucial part of multiple criteria decision analysis” (Bana e Costa and Chagas (2004: 323)), because it is where actions start being ordered according to preferences (Bana e Costa and Vansnick, 1994; Ferreira et al., 2011; Bana e Costa et al., 2012). From there, a model of local preferences can be built, and replacement rates (or trade-offs) determined (Bana e Costa et al., 2012); a procedure which consists of two phases. In the first, a model of local preferences for each of the evaluation references is developed; and in the second, local preference judgments are aggregated into an overall evaluation model.
The MACBETH methodology is based on the mathematical principles of Doignon (1984) and pertains to “numerical representations of semi-orders for multiple thresholds” (Ferreira et al., 2014b: 9). That is, based
on a point of view PVj, the numerical representation of preferences follows a structure of m binary relations [P(1), ..., P(k), ..., P(m)] (where P(k) is a preference which is the stronger the higher k). The MACBETH procedure then consists of associating each element of X (where X = {a, b, ..., n} is a finite set of n actions) to a value x (resulting from v(.): X → R); such that differences such as v(a) – v(b) (where a is more attractive than b (i.e. a P b)), are made as compatible as possible with the decision makers’ judgments.
In order to proceed with setting the intervals between consecutive categories of differences in attractiveness, the subsequent step is then to calculate the limits sk, which can be interpreted as transition thresholds (Ferreira et al., 2014a). Here, bearing in mind the issue of the numerical representation of multiple semi-orders by constant thresholds, multiple semi-semi-orders can easily be introduced by a function v, and the thresholds sk follow formulation (1):
(1) The definition of the intervals between the semantic categories of attractiveness is made easier, both because the sk thresholds are real positive values and, between the origin (i.e. s1 = 0) and sm, an infinite number of categories and boundaries can be set. To illustrate, if a decision maker considers an action a more attractive than b, and the difference between the two actions is weak, then (a, b) є C2.
The design of an evaluation system should therefore be based on these semantic categories and, for consistency, formulations (2) and (3) (see Junior, 2008; Ferreira et al., 2014b) should be analyzed based on decision-makers’ value judgments.
(2)
(3)
Next, linear programming is applied, in conformity with formulation (4) (cf. Junior, 2008; Ferreira et al., 2014b), in order to generate an initial scale, to be presented to decision makers for discussion.
. and between ness attractive of difference the and and between ness attractive of difference the between ness attractive of difference of categories of number minimal the is ) , , , ( ) ,...( , , : ,... , , that so of element an is ,... , , ) ( : ,... , , that so of element an is : where 0 ) ( ) , , , ( 1 ) ( ) ( ) ( ) ( : then , and between than bigger is and between ness attractive of difference the if , ) , ( ), , ( ) ( ) ( : , 1 ) ( ) ( : , : . . ) ( d c b a d c b a a I P c b a X c b a X a c b a I P n X c b a X n a v d c b a d v c v b v a v d c b a X d c b a b v a v aIb X b a b v a v aPb X b a T S n v Min
(4) This last formulation aims to minimize the value of n in order to reduce the basic scale. In practice, n represents the most attractive option of X, whereas a0 represents the least attractive alternative, which is associated to the zero of the scale (Bana e Costa et al., 2008). This process is repeated until a local preference scale for each descriptor has been defined and accepted by the decision makers. Then, a simple additive model can be applied, following formulation (5), to obtain an overall score for each of the alternatives under assessment. (5) ( ) 100 0 ) ( and 0 and 1 1 with 1 ) ( ) ( vi Goodi i Neutral i v i w n i i w n i a i v i w a V 1 ) ()
(
)
(
:
k
k ks
b
v
a
v
s
b
P
a
aPb
b
v
a
v
X
b
a
,
:
(
)
(
)
) ( ) ( ) ( ) ( 1 : ) , ( e ) , ( com , , , , 6 , 5 , 4 , 3 , 2 , 1 , * * * d v c v b v a v k k C d c C b a X d c b a k k k k In addition, it is common to use: (1) sensitivity analyses, to assess the framework’s sensitivity to changes in the weight of any given criterion; and (2) robustness analyses, to assess the impact of simultaneous changes in the weights of two or more criteria. These analyses form the basis of recommendations phase.
The next section presents our application of the methodologies described above for the development of a bankruptcy risk assessment framework, as well as the results obtained.
4. APPLICATION AND RESULTS
The aim of this study was to use a multiple criteria approach to develop a bankruptcy prediction framework. According to Zopounidis et al. (2015), this approach allows financial indicators to be combined with constructivist instruments, for an analysis that not only includes indicators of financial performance, but incorporates operational and strategic indicators as well. This allows diverse stakeholders to give their contribution to problem definition and resolution, helping generate greater clarity with regard to alternative actions and facilitating the establishment of a hierarchy of goals.
In order to ensure that the variables included in the SMEs bankruptcy prediction model and their respective coefficients could be as close to reality as possible, three framework development sessions were carried out, with the average duration of four hours each. The sessions were attended by an insolvency management expert (i.e. a credit risk analyst with senior responsibilities) from one of the largest banks operating in Portugal and five SME managers. Eden and Ackermann (2001a: 22), note that with such methodologies “the consultant [i.e. facilitator] will relate personally to a small number (say, three to ten persons)”; so while the number of participants is not large, it falls within the recommended guidelines for this type of study. The sessions were conducted by two trained facilitators, who coordinated the whole process.
4.1. Developing the Cognitive Map
This stage of the process was bound with structuring the decision problem and aimed to identify the determinants or criteria that decision makers considered important to assess an SME’s risk of failure. The session began with a brief presentation of the main objectives of the study and the basic elements of the methodological approach followed, after which the panel was presented with the following trigger question: “Based on your personal opinion and experience, what are the variables which increase an SME’s risk of bankrutpcy?”. This question served to kick start the exchange of ideas among the panel members.
In operational terms, the “post-its” technique was applied (Eden and Ackermann, 2001a). The experts (i.e. panel members) were asked to write the criteria being discussed (“the variables which increase an SME’s risk of bankruptcy”) on post-its, with the rule that each post-it should contain only a single criterion. If the causal relationship between a criterion with the issue at hand was negative, a negative sign (-) was added to the upper right corner of the post-it. This process was heavily discussion-based, with the panel members sharing ideas and professional experiences, as well as their reasons for identifying each criterion and its perceived influence on SMEs’ operational, financial and/or strategic stability.
Having identified the criteria, the participants were then asked to group the post-its into clusters (or areas of concern); and then to analyze each cluster individually in order to reorganize the criteria within it and identify the cause-and-effect relationships between them. Once this had been concluded, the Decision Explorer software (http://www.banxia.com) was used to create the group cognitive map, which served to support further discussion on how the problem had been structured. Following Eden and Ackermann’s (2001a and 2001b) guidelines, the decision makers were given the opportunity to adjust the map if they did not fully agree with its content or form. Figure 3 shows the final version of the group cognitive map, as validated by all the members of the panel.
Figure 3 – Group cognitive map. 1 Bankruptcy Prediction 2 Management Skills 3 Structure and Employees 4 Financial Aspects 5 External Factors 6 Strategic Aspects 7 Product, Marketing and Sales 8 Decision Making 9 Quality Management 10 Right timing 11 Manager's Experience 12 Market Analysis 13 Purposeless Investment 14 Leadership 15 Coordination 16 Lack of Manager's Preparation 17 Capability for Strategic Implementation 18 Succession Study 19 Absence of Mission/Vision 20 Dependency on the Owner 21 Communication Capability 22 Ability to Maintain a Balanced Busines 23 Centralization of Decision Making 24 Trust 25 Managing Emotional Issues vs ... Rational Issues 26 Resistance to Change 27 Lack of Critical Attitude 28 Qualifications 29 Lack of Delegation Capability 30 Excess of Confidence 31 Family Stability 32 Lack of Market Analysis for Decision Making 33 Divergence of Decision-Makers 34 Good Sales Strategy 35 Bad Stock Management 36 Lack of Adaptation Capability 37 Permissive Management 38 Lack of Internal Procedures 39 Manager's Age 40 Stagnation toward Success 41 Lack of Preparation to face New Markets 42 Act on Several Fronts 43 Human Resources 44 Size 45 Good Sellers 46 Exit of Key Employees 47 Excessive Concentration of Know-How on a Single Person 48 Production Capacity 49 Team Cohesion 50 Inappropriate Logistics 51 Workers' Dissatisfaction 52 Team Spirit 53 Lack of Hygiene
and Work Security
54 Lack of Motivation 55 Low Salaries 56 Automatization 57 Inadequate Tools 58 Lack of Work Conditions 59 Delayed Response
to Requests 60 Lack of Trainingof HR Teams 61 Malfunctions/Acciden ts 62 Wage Policy 63 Excessive Dependence on External Expertise 64 Unions
65 Absence of Structures and Equipment 66 Production Management on Industrial Facilities 67 Lack of Conditions 68 Lack of Sales 69 Business Margins 70 Sales Margin 71 Liquidity 72 Cost Structure 73 Tax Debts/Social Security 74 Payment Delays 75 Scale Economies
76 High Fixed Costs 77 Rate of Uncollectible Accounts 78 Energy Costs 79 Misappropriation/Und ercapitalization for Other Purposes 80 Inappropriate Financial Effort 81 Treasury Management 82 Lack of Equity to Adress Misapplication/Unfor eseen 83 Fiscal Management 84 Lack of Access to Credit 85 Levelof Indebtedness 86 Extraordinary Expenses 87 Secure Structure 88 Certifications Cost 89 Competition 90 Economic Market Situation 91 Comsumption Decrease 92 Financial Environment 93 Substitute Products 94 Fashion 95 Supplier Relocation
96 High Raw Material Costs 97 Delay on Product Supply 98 Competitive Dumping 99 Politic
Convulsions 100 Tax Increase 101 Religion 102 War 103 Weather 104 Political Instability 105 Environmental Regulation 106 Relevant Judicial Actions 107 Disease/Dead of
a Key Partner 108 Legislation 109 Accidents 110 Changes in Labor
Legislation 111 Partner Divorce 112 Investment
Partners 113 Client Proximity 114 Third-Party Dependence Internationalization115 116 Business Areas 117 Lack of Innovation 118 Proximity to Suppliers 119 Business Function Location 120 Value Chain Position 121 Unsustainable Growth 122 Supplier Dependence 123 Synergies 124 Resources Location 125 Innovation 126 Organizational
Model 127 Fast Overgrowth 128 Purchase of Alternative Markets 129 Type of Society 130 Incapability of Accomplishment 131 Costumer Dependence 132 Research and Development 133 Reinvention 134 Disinvestment Timing 135 Back-up Systems 136 Political Dependency 137 Absence of Social Responsibility 138 Product 139 Brand 140 Product Competitiveness 141 Brand Value 142 Reputation 143 External Image 144 Aggressive Marketing 145 Sales Force 146 Promotional Actions 147 Costumer Retention 148 After Sales Service 149 Aptitude 150 Product Rotation 151 Scandals with the Product
--
-
--
-
-
-
-
-
---
-
-
- -
-
--
-
-- --
-
-
-
--
-
-
-
-
-
-
-
-
--
-
-
-
-- --
-
-The next step in the structuring phase, in accordance with Keeney’s (1992) methodological guidelines, was to identify Fundamental Points of View (FPVs). Based on the cognitive structure developed by the panel members and represented in the map, they were able to identify the main areas of interest, which then gave rise to the following six FPVs: Management Skills; Product, Marketing and Sales; Financial Aspects; External Factors; Structure and Employees; and Strategic Aspects (Figure 4).
Figure 4 – Tree of fundamental points of view.
The FPVs represented in Figure 4 thus constitute the evaluation references which, from the expert panel members’ point of view, are the key elements for predicting an SME’s bankruptcy. FPV1 – Management Skills refers to factors related to a manager’s ability or level of responsibility, such as level of experience or qualifications. FPV2 – Product, Marketing and Sales – reflects the manner in which the company shapes the market’s perspective of the product (for instance, image, after-sales service or brand value). FPV3 – Financial Aspects – comprises indicators of the company’s financial position (e.g. cost structure, access to credit or fiscal management). FPV4 – External Factors – brings together factors reflective of the macroeconomic context in which the organization operates (e.g. legislation, financial background or political instability). PVF5 – Structure and Employees – comprises factors related to the organizational team, such as cohesion, motivation levels or automation. Finally, FPV6 – Strategic Aspects – includes characteristics relating to the organization’s strategy (e.g. research and development, reinventions or synergy).
Having identified the FPVs, mutual preferential independence tests were carried out between them, to ensure that the additive model presented in formulation (5) could be applied (for further discussion, see Bana e Costa et al. (2012) and Ferreira et al., 2014c). Having done this, and validated the tree of FPVs, the next step was then to build a descriptor, i.e. a set of ordered performance impact levels, for each of the FPVs. This process was carried out during the second group work session.
The descriptors created in this second session were intended to operationalize the FPVs. Fiedler’s scale (1967) was applied, in order to define levels of partial performance as well as reference levels (i.e. Good and Neutral) for each descriptor. Figure 5 illustrates one of the descriptors and its respective levels of impact, as built for the problem under consideration.
Figure 5 – Descriptor and levels of impact for FPV3.
As Figure 5 shows, FPV3 – Financial Aspects – was operationalized through a Financial Aspects (FA) index encompassing the five factors which, from the panel members’ point of view, are most important to assess the SME financial situation, namely: business margins; liquidity levels; debt levels; fixed costs; and cost structure. Five levels of impact were then defined for this descriptor, ranging from L1, which is the best possible performance; to Good and Neutral, the reference levels which define ranges considered good and neutral, respectively; and L4 and L5, which reflect the worst possible performance levels. Once descriptors
had been defined for all the FPVs in the framework, the structuring phase was considered concluded, and the process proceeded to the evaluation stage.
4.2. The Evaluation Phase
The evaluation phase began in the third group session, in which the MACBETH methodology was applied, both for the calculation of the weights of the FPVs and for the construction of local scales for each descriptor of each FPV. In order to obtain a preliminary ordering of the FPVs, the session began with pairwise comparisons between FPVs, taking into account their differences in overall attractiveness. Thus, panel members were asked, for each two FPVs, FPVi and FPVj, which from their point of view should be globally preferred. An ordering matrix was then filled in, by asking the panel members to attribute the value “1” whenever a FPVi was generally preferable to a FPVj (i ≠ j), and “0” otherwise. This generated further discussion among the decision makers and resulted in Table 2.
Table 2 – Matrix of overall preferences.
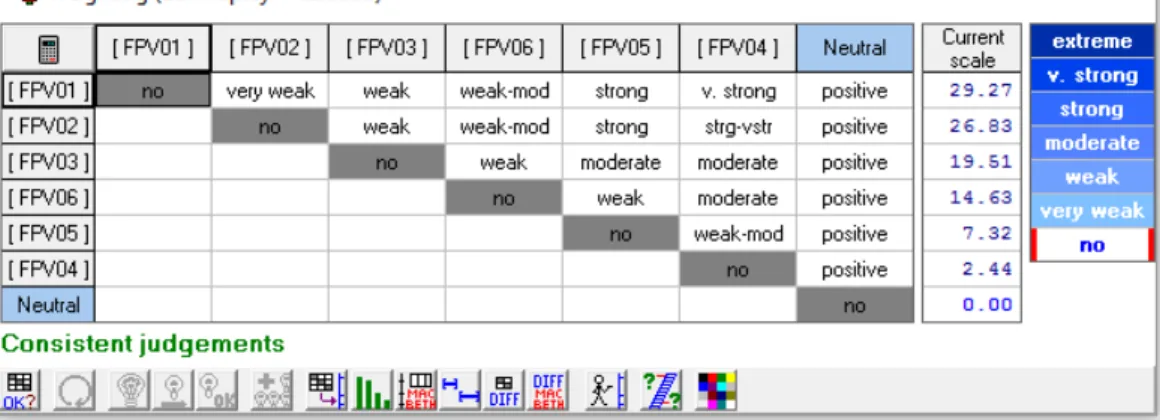
Having ordered the FPVs, the next step was to fill in a second matrix. This matrix used the semantic categories of difference in attractiveness associated with the MACBETH technique, to obtain the weights (or replacement rates) of the FPVs. Figure 6 illustrates the resulting matrix, obtained using the M-MACBETH software (www.m-macbeth.com/).
Figure 6 – Matrix of value judgments of the FPVs.
As can be seen in Figure 6, the FPV considered to most contribute to an SME’s bankruptcy risk was FPV1 (Managerial Skills), with a weight of 29.27%. This was followed by FPV2 (Product, Marketing and Sales) with a weight of 26.83%; FPV3 (Financial Aspects) with a weight of 19.51%; FPV6 (Strategic Aspects) with 14.63%; FPV5 (Structure and Employees) with 7.32%; and, finally, FPV4 (External Factors) with 2.44%. The calculation of these coefficients was required for the application of the additive formula shown in (5). It should be borne in mind that these values are based on semantic judgments and, therefore, should be analyzed with caution. In this sense, they were presented to the panel members for analysis, discussion and validation.
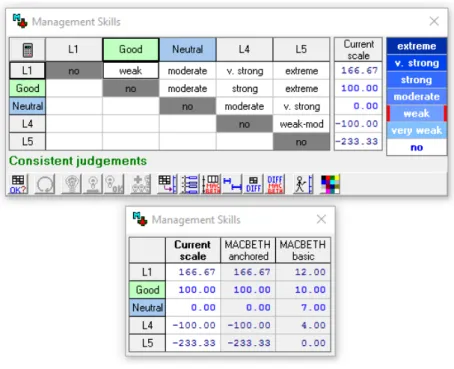
The subsequent step was to apply the same procedures to build local performance scales for each of the previously defined descriptors. As exemplified in Figure 7, FPV1 was assigned a value function which attributed 166.67 points to the highest level (L1). L2 was defined by the panel members as constituting the level Good, having been given 100 points. L3 was regarded as the neutral level, and obtained zero points. The L4 level was assigned -100 points, and the worst level (L5) obtained -233.33 points. The same procedure was followed for all the descriptors of all the FPVs.
Figure 7 –Value judgments and proposed scales for FPV3.
In order to test and legitimize the model, the panel members were asked to assess their own businesses and define a level of impact for it for each of the descriptors. These partial evaluations were then aggregated to get an overall score for each of the SMEs evaluated, as shown in Figure 8 (where the evaluated SMEs are identified as “Alphas”).
Figure 8 – SMEs’ partial and overall attractiveness scores.
As can be seen in Figure 8, among the evaluated SMEs, Alpha 3 stands out with an overall score which exceeds the level Good, and as such reflects an SME in very good standing. The worst score appears associated with Alpha 2. However, the firm cannot be classified as being at risk of bankruptcy, because its overall score is still higher than the neutral level.
Bearing in mind the posture of learning assumed in this study (see Smith and Goddard (2002) and Santos et al. (2008) for a deeper theoretical discussion), it is worth noting that the evaluation system created also allows for the identification of those FPVs in which improvements are crucial for the survival of each Alpha. Figure 9 exemplifies this through the partial performances of Alpha 05 and Alpha 06.
Figure 9 – Impact profiles of Alpha 05 and Alpha 06.
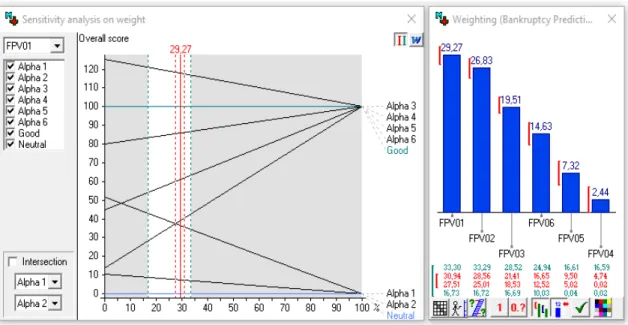
Sensitivity and robustness analyses were also carried out at this stage. According to Ferreira et al. (2011) and Bana e Costa et al. (2012), sensitivity analyses allow the impact of changes in individual FPVs on the overall framework to be assessed; while robustness analyses are used to analyze the impact of simultaneous changes to the framework. Figure 10 illustrates one of the sensitivity analyses carried out.
Figure 10 – Sensitivity analysis on the weight of FPV1 and FPVs’ coefficient variation intervals. The red line on the left hand side of Figure 10 represents the current weight of the FPV (i.e. 29.27%), and the dashed lines define a variation range for that FPV’s coefficient. The analyses confirmed the robustness of the evaluation framework developed, insofar as changes in the weights of the FPVs within the identified ranges do not compromise the Alpha’s ranking, nor the panel members’ value judgments.
In addition to the sensitivity analyses, several robustness analyses were also performed, as exemplified in Figure 11.
Figure 11 – Robustness analysis for the overall framework.
In the robustness analysis, the symbol indicates the presence of classical dominance, where Alpha X dominates Alpha Y globally and independently of the FPV coefficients. The symbol in turn indicates additive dominance, whereby Alpha X dominates Alpha Y in terms of the weights of the coefficients, but does not do so for all the FPVs (Bana e Costa et al., 2005). Various simulations were carried out to assess the robustness of the evaluation framework developed. As we can see in Figure 11, there can be simultaneous variations of +16% and +14% in the scores of FPV4 and FPV6, respectively, without changing the dominance relationships among the Alphas. Although the results are context dependent, meaning that any generalization should be carried out with due caution, this allowed the framework to be considered quite robust by the participating decision makers.
4.3. Final Validation, Recommendations and Managerial Implications
A consolidation meeting was held with an insolvency management expert, whose experience and perceptions were considered of great value for the practical validity of our framework. Specifically, in addition to being a senior insolvency manager in one of the largest banks in Portugal, she had first-hand knowledge of the current practices of bankruptcy prediction, and was able to serve as a neutral evaluator of the evaluation framework developed in this study. In this sense, this final session was important to: (1) strengthen the practical lessons and managerial implications obtained from the evaluation framework created; (2) increase understanding of the current assessment practices regarding bankruptcy prediction; (3) discuss the results obtained and the extent to which our methodological proposal could add value to the current practices; and (4) obtain overall feedback on the practical relevance of the evaluation system developed.
According to the expert interviewed, the assessment mechanisms currently in place for bankruptcy prediction are generally grounded on the same criteria used for SME credit appraisal and risk analysis. This suggests that there is no well-established mechanism to address bankruptcy prediction in particular, something our expert partially agreed with. Although cognitive mapping and MACBETH were new to her, the expert recognized that their integrated use facilitates interaction between stakeholders and allows cause-and-effect relationships between criteria to be identified and better understood. She also felt that the use of cognitive references – i.e. Good and Neutral – brought realism to the appraisal exercise, allowing the full potential of the framework to be reinforced. This feedback was extremely encouraging in terms of consolidating the results, namely because she also agreed with the rankings obtained, and noted that “the current practices of bankruptcy prediction used by the bank do not offer an assessment as complete and consistent as the one developed in this study”.
The results obtained are idiosyncratic, meaning that they cannot be extrapolated to other contexts without caution and proper adjustments. Notwithstanding, the framework proposed in this study was seen as more complete and consistent than the bank’s current assessment practices, which are generally grounded on the same criteria used for SME credit appraisal and risk analysis. Furthermore, the outcomes support previous studies that highlight the importance of integrating different operational research (OR) techniques when developing performance evaluation mechanisms (e.g. Santos et al., 2008; Filipe et al., 2015; Gonçalves et al., 2016; Jalali et al., 2016).
5. CONCLUSIONS
Given the global economic landscape, where bankruptcies are discussed on an almost daily basis, and bearing in mind the importance of SMEs for a country’s economy, this study intended to develop a multiple criteria framework for the assessment of the bankruptcy risk of SMEs. This was done through the combination of cognitive maps with the MACBETH technique, a methodological option which resulted from cognitive maps’ ability to comprehensively identify evaluation criteria, and the ability of the MACBETH approach to allow weights to be attributed to these criteria. According to Gumparthi et al. (2010: 364), “to avoid erroneous applications of bankruptcy prediction models in the future, it is necessary for researchers not only to understand the uses of prediction models, but also to understand the limitations of the models”.
Taking into account the results obtained, the approach proved useful and effective in evaluating SMEs’ risk of bankruptcy. The development of the cognitive map allowed the problem to be more clearly structured, and often overlooked criteria to be identified; while the MACBETH technique allowed key criteria to be ordered and weighted. The resulting framework was not only more comprehensive than many of the tools currently in use, but tailored to the issue of SME bankruptcy prediction in particular, which is often not the case.
Although developing such frameworks is not without its challenges, including the difficulty sometimes found in obtaining a consensus among the panel members, such discussions add to the learning such methodologies can create. Furthermore, the resulting framework is flexible enough to allow for the addition of new data as it arrives; and the process followed can be replicated with different groups of experts in different settings. In terms of future research, it would be of interest to conduct similar studies using other multiple criteria methods, such as Analytic Hierarchy Process (AHP), Multi-Attribute Value Function (MAVF) or the Technique for Order of Preference by Similarity to Ideal Solution (TOPSIS); as well as carrying out comparative studies (for further reading on different MCDA methods, see Belton and Stewart, 2002; Zopounidis and Doumpos, 2002; Zavadskas and Turskis, 2011; Zopounidis et al., 2015). Any such efforts can be seen as marking a step forward in supporting the prediction of bankruptcy risk in SMEs.
REFERENCES
Altman, E. (1968): “Financial ratios, discriminant analysis and the prediction of corporate bankruptcy”, The Journal of Finance, vol. 23, nº 4, pp. 589-609.
Altman, E. & Sabato, G. (2007): “Modeling credit risk for SMEs: Evidence from the US market”, Abacus, vol. 43, nº 2, pp. 332-357. Andrés, J., Lorca, P., de Cos Juez, J. & Sánchez-Lasheras, F. (2011): “Bankruptcy forecasting: A hybrid approach using fuzzy c-means
clustering and multivariate adaptive regression splines (MARS)”, Expert Systems with Applications, vol. 38, nº 3, pp. 1866-1875.
Bălan, M. (2012): “Stochastic methods for prediction of the bankruptcy risk of SMEs”, Procedia Economics and Finance, vol. 3, pp. 125-131.
Bana e Costa, C. & Chagas, M. (2004): “A career choice problem: An example of how to use MACBETH to build a quantitative value model based on qualitative value judgments”, European Journal of Operational Research, vol. 153, nº 2, pp. 323-331. Bana e Costa, C. & Vansnick, J. (1994): “MACBETH – An interactive path towards the construction of cardinal value functions”,
International Transactions in Operational Research, vol. 1, nº 4, pp. 489-500.
Bana e Costa. C., Corte, J. & Vansnick, J. (2012): “MACBETH”, International Journal of Information Technology & Decision Making, vol. 11, nº 2, pp. 359-387.
Bana e Costa, C., De Corte, J. & Vansnick, J. (2005): “On the mathematical foundations of MACBETH”, in Figueira, J., Greco, S. & Ehrgott, M. (Eds), Multiple criteria decision analysis: The state of the art surveys, Springer, New York, pp. 409-442.
Bana e Costa, C., Lourenço, J., Chagas, M. & Bana e Costa, J. (2008): “Development of reusable bid evaluation models for the Portuguese electric transmission company”, Decision Analysis, vol. 5, nº 1, pp. 22-42.
Bana e Costa, C., Silva, F. & Vansnick, J. (2001): “Conflict dissolution in the public sector: A case-study”, European Journal of Operational Research, vol. 130, nº 2, pp. 388-401.
Beaver, W. (1966): “Financial ratios as predictors of failure”, Journal of Accounting Research, vol. 4, nº 3, pp. 71-111.
Bellovary, J., Giacomino, D. & Akers, M. (2007): “A review of bankruptcy prediction studies: 1930 to present”, Journal of Financial Education, vol. 33, nº Winter, pp. 1-42.
Belton, V. & Stewart, T. (2002): Multiple criteria decision analysis: An integrated approach, Kluwer Academic Publishers, Dordrecht. Ben-Ari, M. & Yeshno, T. (2006): “Conceptual models of software artifacts”, Interacting with Computers, vol. 18, nº 6, pp. 1336-1350. Canas, S., Ferreira, F. & Meidutė-Kavaliauskienė, I. (2015): “Setting rents in residential real estate: A methodological proposal using
multiple criteria decision analysis”, International Journal of Strategic Property Management, vol. 19, nº 4, pp. 368-380. Ciampi, F. & Gordini, N. (2013): “Small enterprise default prediction modeling through artificial neural networks: An empirical analysis
of Italian small enterprises”, Journal of Small Business Management, vol. 51, nº 1, pp. 23-45.
Doignon, J. (1984): “Matching relations and the dimensional structure of social choices”, Mathematical Social Sciences, vol. 7, nº 3, pp. 211-229.
du Jardin, P. (2015): “Bankruptcy prediction using terminal failure processes”, European Journal of Operational Research, vol. 242, nº 1, pp. 286-303.
Eden, C. (2004): “Analyzing cognitive maps to help structure issues or problems”, European Journal of Operational Research, vol. 159, nº 3, pp. 673-686.
Eden, C. & Ackermann, F. (2001a): “SODA – The principles”, in Rosenhead, J. & Mingers, J. (Eds), Rational analysis for a problematic world revisited: Problem structuring methods for complexity, uncertainty and conflict, John Wiley & Sons, Chichester, pp. 21-41.
Eden, C. & Ackermann, F. (2001b): “Group decision and negotiation in strategy making”, Group Decision and Negotiation, vol. 10, nº 2, pp. 119-140.
Ensslin, L., Dutra, A. & Ensslin, S. (2000): “MCDA: A constructivist approach to the management of human resources at a governmental agency”, International Transactions in Operational Research, vol. 7, nº 1, pp. 79-100.
Ferreira, F. & Santos, S. (2016): “Comparing trade-off adjustments in credit risk analysis of mortgage loans using AHP, Delphi and MACBETH”, International Journal of Strategic Property Management, vol. 20, nº 1, pp. 44-63.
Ferreira, F., Santos, S. & Rodrigues, P. (2011): “Adding value to branch performance evaluation using cognitive maps and MCDA: A case study”, Journal of the Operational Research Society, vol. 62, nº 7, pp. 1320-1333.
Ferreira, F., Santos, S., Marques, C. & Ferreira, J. (2014a): “Assessing credit risk of mortgage lending using MACBETH: A methodological framework”, Management Decision, vol. 52, nº 2, pp. 182-206.
Ferreira, F., Santos, S., Rodrigues, P. & Spahr, R. (2014b): “Evaluating retail banking service quality and convenience with MCDA techniques: A case study at the bank branch level”, Journal of Business Economics and Management, vol. 15, nº 1, pp. 1-21. Ferreira, F., Santos, S., Rodrigues, P. & Spahr, R. (2014c): “How to create indices for bank branch financial performance measurement
using MCDA techniques: An illustrative example”, Journal of Business Economics and Management, vol. 15, nº 4, pp. 708-728.
Ferreira, F., Spahr, R., Gavancha, I. & Çipi, A. (2013): “Readjusting trade-offs among criteria in internal ratings of credit-scoring: An empirical essay of risk analysis in mortgage loans”, Journal of Business Economics and Management, vol. 14, nº 4, pp. 715-740.
Fiedler, F. (1967): A theory of leadership effectiveness, New York, McGraw-Hill.
Filipe, M., Ferreira, F. & Santos, S. (2015): “A multiple criteria information system for pedagogical evaluation and professional development of teachers”, Journal of the Operational Research Society, vol. 66, nº 11, pp. 1769-1782.
Frydman, H., Altman, E. & Kao, D. (1985): “Introducing recursive partitioning for financial classification: The case of financial distress”, The Journal of Finance, vol. 40, nº 1, pp. 269-291.
Gonçalves, T., Ferreira, F., Jalali, M. & Meidutė-Kavaliauskienė, I. (2016): “An idiosyncratic decision support system for credit risk analysis of small and medium-sized enterprises”, Technological and Economic Development of Economy, vol. 22, nº 4, pp. 598-616.
Gordini, N. (2014): “A genetic algorithm approach for SMEs bankruptcy prediction: Empirical evidence from Italy”, Expert Systems with Aplications, vol. 41, nº 14, pp. 6433-6445.
Gumparthi, S., Manickavasagam, V. & Ramesh, M. (2010): “Credit scoring model for auto ancillary sector”, International Journal of Innovation, Management and Technology, vol. 1, nº 4, pp. 362-373.
Han, C., Kang, H., Kim, G. & Yi, J. (2012): “Logit regression based bankruptcy prediction of Korean firms”, Asia-Pacific Journal of Risk and Insurance, vol. 7, nº 1, pp.1-30.
Howick, S. & Ackermann, F. (2011): “Mixing OR methods in practice: Past, present and future directions”, European Journal of Operational Research, vol. 215, nº 3, pp. 503-511.
Hu, Y. & Chen, C. (2011): “A PROMETHEE-based classification method using concordance and discordance relations and its application to bankruptcy prediction”, Information Sciences, vol. 181, nº 22, pp. 4959-4968.
Iturriaga, F. & Sanz, I. (2015): “Bankruptcy visualization and prediction using neural networks: A study of US commercial banks”, Expert Systems with Applications, vol. 42, nº 6, pp. 2857-2869.
Jalali, M., Ferreira, F., Ferreira, J. & Meidutė-Kavaliauskienė, I. (2016): “Integrating metacognitive and psychometric decision making approaches for bank customer loyalty measurement”, International Journal of Information Technology and Decision Making, vol. 15, nº 4, pp. 815-837.
Junior, H. (2008): “Multicriteria approach to data envelopment analysis”, Pesquisa Operacional, vol. 28, nº 2, pp. 231-242. Keeney, R. (1992): Value-focused thinking: A path to creative decisionmaking, University Press Harvard, Harvard.
Lopez, J. & Saidenberg, M. (2000): “Evaluating credit risk models”, Journal of Banking and Finance, vol. 24, nº 1, pp.151-165. Martins, V., Filipe, M., Ferreira, F., Jalali, M. & António, N. (2015): “For sale… but for how long? a methodological proposal for
estimating time-on-the-market”, International Journal of Strategic Property Management, vol. 19, nº 4, pp. 309-324.
Mingers, J. & Rosenhead, J. (2004): “Problem structuring methods in action”, European Journal of Operational Research, vol. 152, nº 3, pp. 530-554.
Morrison, A., Breen, J. & Ali, S. (2003): “Small business growth: Intention, ability, and opportunity”, Journal of Small Business Management, vol. 41, nº 4, pp. 417-425.
Ohlson, J. (1980): “Financial ratios and the probabilistic prediction of bankruptcy”, Journal of Accounting Research, vol. 18, nº 1, pp. 109-131.
Porcaro, D. (2010): “Applying constructivism in instructivist learning cultures”, Multicultural Education & Technology Journal, vol. 5, nº 1, pp. 39-54.
Ronald, W., Rumelhart, E. & Hinton, E. (1986): “Learning internal representations by error propagation”, in Rumelhart, E. & McClelland, J. (Eds.), Parallel distributed processing: Explorations in the microstructure of cognition (Vol. 1), Cambridge, MIT Press/Bradford Books.
Roy, B. (1985): Méthodologie multicritére d’aide à la décision, Paris, Economica.
Santos, S., Belton, V. & Howick, S. (2002): “Adding value to performance measurement by using systems dynamics and multicriteria analysis”, International Journal of Operations & Production Management, vol. 22, nº 11, pp. 1246-1272.
Santos, S., Belton, V. & Howick, S. (2008): “Enhanced performance measuring using OR: A case study”, Journal of the Operational Research Society, vol. 59, nº 6, pp. 762-775.
Shin, K., Lee, T. & Kim, H. (2005): “An application of support vector machines in bankruptcy prediction model”, Expert Systems with Applications, vol. 28, nº 1, pp. 127-135.
Smith, P. & Goddard, M. (2002): “Performance management and operational research: A marriage made in heaven?”, Journal of the Operational Research Society, vol. 53, nº 3, pp. 247-255.
Tegarden, D. & Sheetz, S. (2003): “Group cognitive mapping: A methodology and system for capturing and evaluating managerial and organizational cognition”, Omega – The International Journal of Management Sciences, vol. 31, nº 2, pp. 113-125.
Watson, J. & Everett, J. (1998): “Small business failure and external risk factors”, Small Business Economics, vol. 11, nº 4, pp. 371-390. Zavadskas, E. & Turskis, Z. (2011): “Multiple criteria decision making (MCDM) methods in economics: An overview”, Technological
and Economic Development of Economy, vol. 17, nº 2, pp. 397-427.
Zmijewski, M. (1984): “Methodological issues related to the estimation of financial distress prediction models”, Journal of Accounting Research, vol. 22, nº Suppl., pp. 59-82.
Zopounidis, C. & Dimitras, A. (1998): Multicriteria decision aid methods for the prediction of business failure, Dordrecht, Kluwer Academic Publishers.
Zopounidis, C. & Doumpos, M. (2002): “Multicriteria classification and sorting methods: A literature review”, European Journal of Operational Research, vol. 138, nº 2, pp. 229-248.
Zopounidis, C., Galariotis, E., Doumpos, M., Sarri, S. & Andriosopoulos, K. (2015): “Multiple criteria decision aiding for finance: An updated bibliographic survey”, European Journal of Operational Research, vol. 241, nº 2, pp. 339-348.