targeting in marketing campaigns
by
Marisa Walters
Thesis presented in fulfilment of the requirements for the degree of Master of Engineering (Industrial Engineering) in the Faculty of Engineering at
Stellenbosch University
Supervisor: Prof JF Bekker December 2018
Declaration
By submitting this thesis electronically, I declare that the entirety of the work contained therein is my own, original work, that I am the sole author thereof (save to the extent explicitly otherwise stated), that reproduction and pub-lication thereof by Stellenbosch University will not infringe any third party rights and that I have not previously in its entirety or in part submitted it for obtaining any qualification.
Date: December 2018
Copyright c2018 Stellenbosch University All rights reserved
Acknowledgements
I would like to express my sincere gratitude to the following people and organisations for their contribution to this thesis:
• Professor James Bekker, my study leader, for your exceptional guidance, sharing your knowledge, wisdom and time. Thank you for giving me the opportunity to pursue my master’s degree under your supervision. • The completion of thesis would not have been realised without the love
and support of my family and friends. Thank you for always believing in me, when I could not do so myself.
• The USMA members for the encouragement, memories and friendships that made the completion of this thesis possible and pleasant.
• The generous financial support by Bytes Universal Systems.
• Anne Erikson, for proofreading the document and making helpful sug-gestions.
Abstract
Being part of a competitive generation demands that a business has good marketing policies to attract new customers as well as to retain existing ones. Marketing managers can develop long-term and healthy relationships with customers, if they can detect and predict changes in their customers’ purchasing behaviour. With the growth of information systems and technol-ogy, businesses have an increasing capability to accumulate huge quantities of customer data in large databases. However, much of these potentially useful marketing insights into customer characteristics and their purchasing pat-terns often remains hidden and untapped. Therefore, businesses can achieve competitive advantages by studying customer behaviour through data min-ing tools (i.e. supervised and unsupervised learning) and techniques (i.e.
classification, regression and clustering).
The goal of this research project was to develop aCustomer Super-Profiling
(CSP) tool that has the ability to analyse large (non-aggregate) customer datasets, considering both demographic and behavioural features. The data analytics was done by utilising more than one data mining tool, which gen-erates customer super-profiles. These profiles are used to attract and classify new customers as well as to retain existing customers, providing the user with the ability to predict each customer’s specific needs.
This research project outlines a general methodology for segmentation of customers by using the model of Recency, Frequency and Monetary (RFM), together withk-means clustering (unsupervised learning) to identify the var-ious types of customers within the dataset. Customer profiles are then gen-erated, in the form of decision rules (supervised learning) to identify each type of customer as well as classifying them into the various clusters created. These predictions are performed based on the customers’ demographic and
behavioural features. The CSP tool was applied and demonstrated on large customer datasets from four different domains and useful results were found.
Opsomming
Om deel te wees van ’n mededingende generasie vereis dat ’n besigheid oor ’n goeie bemarkingsbeleid beskik om nuwe kli¨ente te werf asook om bestaande kli¨ente te behou. Bemarkingsbestuurders kan langtermyn en gesonde ver-houdings met kli¨ente ontwikkel, as hulle veranderinge in hul kli¨ente se koopge-drag kan opspoor en voorspel. Met die groei van inligtingstelsels en teg-nologie het besighede ’n toenemende vermo¨e om groot hoeveelhede kli¨ ente-data in groot ente-databasisse op te bou. Baie van hierdie potensie¨el nuttige be-markingsinligting oor kli¨enteienskappe en hul kooppatrone bly egter steeds weggesteek en onbenut. Daarom kan besighede mededingende voordele be-haal deur kli¨entgedrag met data-ontginningsgereedskap (d.w.s. begeleiding en onbegeleide leer) en tegnieke (d.w.s. klassifikasie, regressie en groepering) te bestudeer.
Die doel van hierdie navorsingsprojek was om ’nKli¨ent-superprofiel (KSP) in-strument te ontwikkel wat die vermo¨e het om groot (nie-saamgestelde) kli¨ ent-datastelle te analiseer, met inagneming van beide demografiese en gedrags-eienskappe. Die data-analise is gedoen deur gebruik te maak van meer as een data-ontginningsgereedskap, wat kli¨ente se superprofiele genereer. Hier-die profiele word gebruik om nuwe kli¨ente te lok en te klassifiseer, sowel as om bestaande kli¨ente te behou, wat die gebruiker die vermo¨e bied om elke kli¨ent se spesifieke behoeftes te voorspel.
Hierdie navorsingsprojek beskryf ’n algemene metodologie vir segmentasie van kli¨ente deur gebruik te maak van die model van Onlangs, Frekwensie en Monetˆere waarde (OFM), tesame met k-mediane (onbegeleide leer) om die verskillende tipes kli¨ente binne die datastel te identifiseer. Kli¨entprofiele word dan gegenereer in die vorm van besluitre¨els (begeleide leer) om elke tipe kli¨ent te identifiseer asook om hulle in die verskillende groepe wat geskep word, te klassifiseer. Hierdie voorspellings word uitgevoer op grond van die
demografiese en gedragseienskappe van die kli¨ente. Die KSP-instrument is toegepas en gedemonstreer op groot kli¨entdatastelle van vier verskillende domeine en nuttige resultate was gevind.
Contents
Nomenclature xx 1 Introduction 1 1.1 Research background . . . 1 1.2 Research assignment . . . 3 1.3 Research Scope . . . 4 1.4 Research objectives . . . 41.5 Research problem-solving methodology . . . 5
1.6 Deliverables envisaged . . . 6
1.7 Structure of the document . . . 6
2 Segmentation and customer profiling 8 2.1 Segmentation . . . 9
2.1.1 Market segmentation . . . 9
2.1.1.1 Dimensions for conducting market segmentation . . . 10
2.1.1.2 Methods for conducting marketing segmentation . . . 12
2.1.2 Customer segmentation . . . 13
2.1.3 Segmentation drawbacks . . . 21
2.2 History of customer profiling . . . 22
2.3 Customer profiling . . . 23
2.3.1 Demographic customer profiles . . . 25
2.3.2 Behavioural customer profiles . . . 26
2.4 Marketing strategy . . . 28
2.5 Synthesis: Chapter 2 . . . 29
CONTENTS
3 Big Data Analytics 31
3.1 Data . . . 31
3.2 Big Data . . . 34
3.3 Big Data Analytics . . . 37
3.4 Data Analytics processes . . . 43
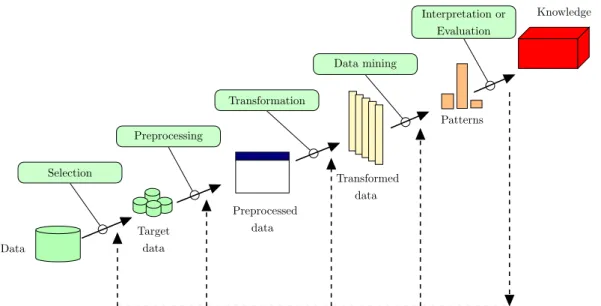
3.4.1 Process: Knowledge Discovery in Databases . . . 43
3.4.2 Process: Sample, Explore, Modify, Model, Assess process method-ology . . . 45
3.4.3 Process: Cross-Industry Standard Process . . . 46
3.5 Comparative study of the analytics processes . . . 48
3.6 Data cleaning . . . 51 3.6.1 Missing values . . . 53 3.6.2 Erroneous values . . . 54 3.6.3 Outliers . . . 54 3.7 Data transformation . . . 55 3.7.1 Dimensionality reduction . . . 56
3.7.1.1 Principal component analysis . . . 60
3.8 Data mining . . . 65
3.8.1 Supervised learning . . . 67
3.8.1.1 Classification . . . 68
3.8.1.1.1 Decision trees . . . 73
3.8.1.1.2 Support Vector Machines . . . 75
3.8.1.1.3 Neural networks . . . 77
3.8.1.1.4 Na¨ıve Bayes network . . . 80
3.8.1.1.5 k-nearest neighbour . . . 81 3.8.1.2 Regression . . . 83 3.8.1.2.1 Linear regression . . . 87 3.8.1.2.2 Non-linear regression . . . 90 3.8.1.2.3 Logistic regression . . . 92 3.8.2 Unsupervised learning . . . 96 3.8.2.1 Clustering . . . 96 3.8.2.1.1 Clustering: k-means . . . 101
CONTENTS
3.10 Summary: Chapter 3 . . . 110
4 Architectural development 112 4.1 Development of a solution architecture for super-profiling . . . 112
4.2 Toy problem and large dataset problem . . . 118
4.3 Summary: Chapter 4 . . . 132
5 Customer Super-Profiling tool 134 5.1 Customer Super-Profiling tool road map . . . 135
5.1.1 Select data: Simulated South African demographic customer dataset136 5.1.2 RFM analysis: Simulated South African demographic customer dataset . . . 137
5.1.3 Clustering: Simulated South African demographic customer dataset142 5.1.4 Predictive model: Simulated South African demographic customer dataset . . . 153
5.2 Business case . . . 167
5.2.1 Business case scenario 1: Targeting customers . . . 167
5.2.2 Business case scenario 2: New members . . . 168
5.2.3 Business case scenario 3: Change the customer type . . . 170
5.3 Decision tree analysis: Camping problem . . . 170
5.3.1 Clustering: Camping dataset . . . 171
5.3.2 Predictive model: Camping dataset . . . 171
5.4 Validation of data simulator and CSP tool: Golfers . . . 182
5.4.1 Select data: Golf dataset . . . 182
5.4.2 RFM analysis: Golf dataset . . . 182
5.4.3 Clustering: Golf dataset . . . 183
5.4.4 Predictive model: Golf dataset . . . 188
5.5 Validation of data simulator and CSP tool: Magazine readers . . . 195
5.5.1 Select data: Magazine dataset . . . 195
5.5.2 RFM analysis: Magazine dataset . . . 196
5.5.3 Clustering: Magazine dataset . . . 196
5.5.4 Predictive model: Magazine dataset . . . 200
5.6 Findings . . . 210
CONTENTS
6 Research summary and conclusions 213
6.1 Project summary and conclusion . . . 213
6.2 Future research . . . 217
6.3 Appraisal of research work . . . 218
6.4 Concluding remarks . . . 219
References 250 A Data simulation 251 A.1 Domain identification . . . 251
A.2 Creating the information system . . . 251
A.2.1 Domain properties . . . 252
A.2.2 Extended entity relationship diagram . . . 253
A.3 Data simulator and Customer Super-Profiling tool logic . . . 257
A.3.1 Data simulator . . . 257
A.3.2 Matlab and Microsoft SQL Server . . . 261
A.4 Validation of simulator . . . 261
B Key descriptors of the information system 269 C Pseudocode: Data simulator 274 C.1 Matlab data simulator . . . 274
List of Figures
1.1 Illustrating the use of customer super-profiling . . . 3
2.1 Illustrating the segmentation and profiling process . . . 25
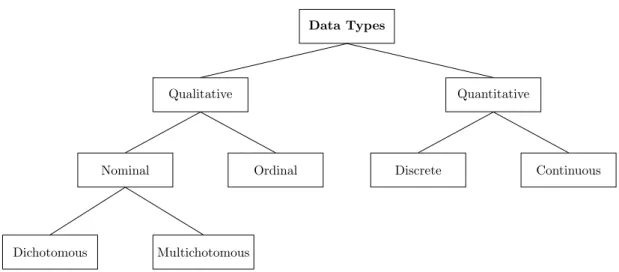
3.1 Taxonomy of data types . . . 33
3.2 Data volume challenge . . . 37
3.3 The four types of data analytics . . . 40
3.4 Illustration of the wide variety of the analytics spectrum . . . 41
3.5 Illustrating Big Data Analytics . . . 42
3.6 An overview of the KDD process . . . 44
3.7 An overview of the SEMMA process . . . 45
3.8 An overview of the CRSIP . . . 47
3.9 PCA plot for the example “hald” . . . 65
3.10 Classification used to automatically classify datasets . . . 69
3.11 A simple decision tree . . . 74
3.12 Fundamentals of SVM . . . 76
3.13 SVM margin of separation . . . 77
3.14 A neuron model indicating the three basic elements . . . 79
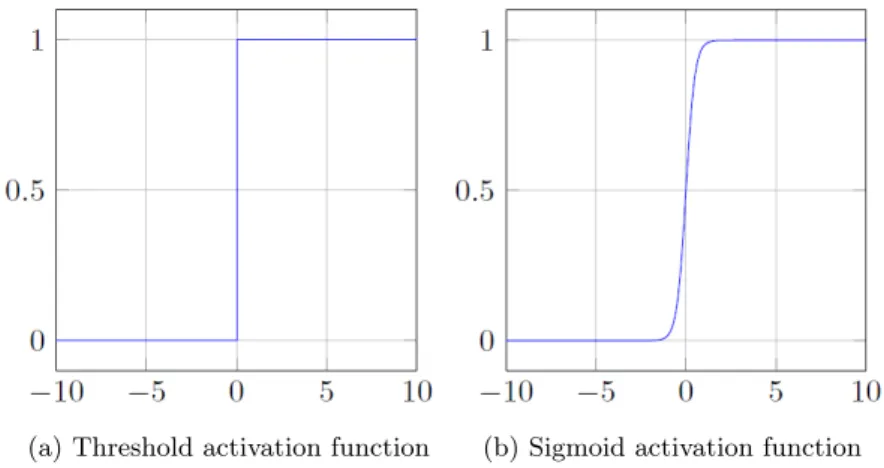
3.15 Types of activation function . . . 79
3.16 Simple linear regression . . . 88
3.17 Multiple linear regression . . . 89
3.18 Binary classification using both a linear and logistic regression model to estimate whether or not a customer will default on a loan based on the average balance remaining on their credit card after their monthly payment 94 3.19 A scatter plot summarising the results of clustering . . . 97
LIST OF FIGURES
3.20 Scatter graph of Fisher’s Iris Dataset before clustering is applied . . . 102
3.21 Silhouette plot for k = 2 applied to the Fisher’s Iris Dataset . . . 102
3.22 Scatter graph after clustering applied on the Fisher’s Iris Dataset with k = 2 . . . 104
3.23 Silhouette plot for k = 3 applied to the Fisher’s Iris Dataset . . . 104
3.24 Scatter graph after clustering applied on the Fisher’s Iris Dataset with k = 3 . . . 105
4.1 System diagram representing the top-level OPD of the proposed simulator and CSP tool . . . 115
4.2 The zoomed-in segmenting process . . . 117
4.3 Silhouette plots for k = 2, 3, 4, 5, 6 of the toy problem dataset . . . 120
4.4 Scatter plot representing the four clusters of the toy problem dataset . . . 121
4.5 Pie chart indicating the four cluster sizes of the toy problem dataset . . . 121
4.6 Cluster 1 of toy problem – RFM ratio . . . 122
4.7 Cluster 2 of toy problem – RFM ratio . . . 123
4.8 Cluster 3 of toy problem – RFM ratio . . . 124
4.9 Cluster 4 of toy problem – RFM ratio . . . 125
4.10 Silhouette plots for k = 2, 3, 4, 5, 6, 7 of the camping dataset . . . 127
4.11 Scatter plot representing the three clusters of the camping dataset . . . . 128
4.12 Pie chart indicating the three cluster sizes of the camping dataset . . . 129
4.13 Cluster 1 of camping problem – RFM ratio . . . 129
4.14 Cluster 2 of camping problem – RFM ratio . . . 131
4.15 Cluster 3 of camping problem – RFM ratio . . . 131
5.1 Schematic representing the CSP tool . . . 136
5.2 Schematic representing the R, F and M category range values . . . 139
5.3 Plot of the silhouette criterion values for each number of clusters tested for the customer dataset . . . 144
5.4 Plot of the silhouette values from clustered data of customer dataset . . . 145
5.5 Scatter plot representing the two clusters for the customer dataset . . . . 146
5.6 Predictor importance for determining the type of customer . . . 157
5.7 Illustrating two customer profiles of (new) big spenders, following rule 14 and rule 16 . . . 158
LIST OF FIGURES
5.8 Illustrating two customer profiles of low loyal customers, following rule 2
and rule 5 . . . 159
5.9 Predictor importance for (new) low spenders . . . 161
5.10 Predictor importance for (new) big spenders . . . 163
5.11 Predictor importance for low loyal customers . . . 166
5.12 Predictor importance for identifying the type of camper . . . 175
5.13 Predictor importance for (new) big spenders . . . 177
5.14 Predictor importance for loyal big spenders . . . 180
5.15 Predictor importance for churned cheap campers . . . 181
5.16 Plot of the silhouette criterion values for each number of clusters tested for the golf dataset . . . 184
5.17 Scatter plot representing the four clusters of the golf dataset . . . 184
5.18 Pie chart indicating the four cluster sizes of the golf dataset . . . 185
5.19 Predictor importance for identifying the type of golfer . . . 189
5.20 Predictor importance for occasional golfers . . . 191
5.21 Predictor importance for social golfers . . . 192
5.22 Predictor importance for core golfers . . . 194
5.23 Plot of the silhouette criterion values for each number of clusters tested for the magazine dataset . . . 197
5.24 Scatter plot representing the three clusters of the magazine readers’ dataset197 5.25 Pie chart indicating the three cluster sizes of the magazine readers’ dataset198 5.26 Predictor importance for type of magazine readers . . . 202
5.27 Predictor importance for up-to-date readers . . . 205
5.28 Predictor importance for routine readers . . . 207
5.29 Predictor importance for cover buyers . . . 209
A.1 The EERD supporting the CSP tool . . . 256
A.2 Illustrating the top five customers in table tbl Customers . . . 257
A.3 User view of top five customers in tabletbl Customers . . . 257
A.4 Illustrating the top five customers in table tbl RetailShop together with the user view . . . 258
LIST OF FIGURES
A.6 Conceptual illustration of the connection between Matlab and Microsoft SQL Server . . . 262
List of Tables
2.1 Practical areas where the RFM model has been applied . . . 16
2.2 Previous research regarding the adapted RFM model . . . 18
2.3 Evolution of capturing customer information . . . 22
2.4 Demographic categories for customer profiles . . . 25
2.5 Elements of marketing value mix . . . 29
3.1 Summary of the correspondences between the KDD and SEMMA processes 48 3.2 Summary of correspondences between KDD and CRISP processes . . . . 49
3.3 Summary of correspondences between SEMMA and CRISP processes . . . 50
3.4 Example of data errors and missing data . . . 52
3.5 Summary of dimensionality reduction techniques . . . 58
3.6 Ingredients table of the “hald” dataset in Matlab . . . 61
3.7 PC coefficients or loadings of the original data . . . 62
3.8 Variance explained for each PC . . . 62
3.9 The PC scores . . . 64
3.10 A supervised learning dataset . . . 68
3.11 Summary of classification techniques . . . 70
3.12 Summary of regression techniques . . . 85
3.13 Simple linear regression and multiple linear regression . . . 87
3.14 Confusion matrix for comparing predictive outcomesversus actual outcomes 95 3.15 Differences between clustering and classification . . . 98
3.16 Summary of clustering techniques . . . 99
3.17 Summary of journal articles containing the keyword: ‘Big Data Analytics’ 110 4.1 Silhouette mean values of the toy problem dataset . . . 119
LIST OF TABLES
4.2 Misclassified customer(s) of the toy problem dataset . . . 119
4.3 Cluster 1 of toy problem – Customer demographics . . . 123
4.4 Cluster 2 of toy problem – Customer demographics . . . 124
4.5 Cluster 3 of toy problem – Customer demographics . . . 125
4.6 Cluster 4 of toy problem – Customer demographics . . . 125
4.7 Silhouette mean values of camping dataset . . . 128
4.8 Cluster 1 of camping problem – Customer demographics . . . 130
4.9 Cluster 2 of camping problem – Customer demographics . . . 130
4.10 Cluster 3 of camping problem – Customer demographics . . . 132
5.1 Minimum and maximum R, F and M parameter values . . . 138
5.2 Top 10 rows of table RFM. . . 142
5.3 Summary of R, F and M category value occurrences in RFM . . . 142
5.4 Cluster solutions for customer dataset . . . 144
5.5 Summary of the customers in each RFM category per cluster . . . 146
5.6 Percentage customers in each cRFM category for clusters 1 and 2 . . . 149
5.7 Total average RFM category values per cluster . . . 150
5.8 Types of customers in dataset . . . 151
5.9 Decision rules to identify the type of customer . . . 155
5.10 Decision rules to identify (new) low spenders . . . 160
5.11 Decision rules to identify (new) big spenders . . . 162
5.12 Decision rules to identify low loyal customers . . . 164
5.13 First new member information . . . 169
5.14 Second new member information . . . 169
5.15 Predicting the possible purchasing behaviour of the existing prospective customers . . . 170
5.16 Percentage campers in each cRFM category for clusters 1, 2 and 3 . . . . 171
5.17 Types of campers in dataset . . . 172
5.18 Camper’s features . . . 172
5.19 Decision rules to identify the type of camper . . . 173
5.20 Decision rules to identify the cluster of a camper identified as a (new) big spender . . . 175
LIST OF TABLES
5.21 Decision rules to identify the cluster of a camper identified as a loyal big
spender . . . 177
5.22 Posterior probability for (new) big spenders . . . 179
5.23 Posterior probability for loyal big spenders . . . 179
5.24 Decision rules to identify the cluster of a camper identified as a churned cheap camper . . . 180
5.25 Posterior probability for churned cheap camper . . . 181
5.26 Minimum and maximum R, F and M parameter values for the golf dataset183 5.27 Summary of R, F and M parameter occurrences in RFM(golfers) . . . 183
5.28 Summary of the golfers and their RFM category values per cluster . . . . 185
5.29 Percentage golfers in each cRFM category . . . 186
5.30 Types of golfers in dataset . . . 187
5.31 Golfer’s features . . . 187
5.32 Decision rules to identify the type of golfer . . . 188
5.33 Decision rules to identify the cluster of a golfer identified as an occasional golfer . . . 189
5.34 Decision rules to identify the cluster of a golfer identified as a social golfer 191 5.35 Decision rules to identify the cluster of a golfer identified as a core golfer . 193 5.36 Summary of R, F and M parameter occurrences in RFM(magazine readers)196 5.37 Summary of the magazine readers and their RFM category values per cluster . . . 198
5.38 Summary of the magazine readers and their cRFM category values per cluster . . . 198
5.39 Types of magazine readers in the dataset . . . 199
5.40 Magazine readers’ features . . . 200
5.41 Decision rules to identify the type of magazine reader . . . 201
5.42 Decision rules to identify the cluster of a magazine reader identified as an up-to-date reader . . . 202
5.43 Decision rules to identify the cluster of a magazine reader identified as a routine reader . . . 205
5.44 Decision rules to identify the cluster of a magazine reader identified as cover buyers . . . 208
LIST OF TABLES
A.1 Illustrating the customer tables . . . 253
A.2 Customer features used in the study . . . 254
A.3 Customer purchasing (transactional) behaviour features . . . 255
A.4 Retail shop distributions . . . 260
A.5 Sources used to distribute data accordingly . . . 260
A.6 Indicating the preliminary conditions of the one-to-many tables created in Matlab . . . 262
A.7 Validation of table ‘Ethnicity’ . . . 263
A.8 Validation of table ‘Age’ . . . 264
Nomenclature
Acronyms
kNN k-nearest neighbour
AHP Analytical hierarchical process ANN Artificial neural networks
BI Business intelligence
CA Correspondence analysis
cRFM Combined Recency Frequency Monetary CRISP Cross-Industry Standard Process
CRM Customer relationship management
CSP Customer Super-Profiling
EERD Extended entity relationship diagram ERD Entity relationship diagram
GA Genetic Algorithm
GUI Graphical user interface
KDD Knowledge Discovery in Databases
MFA Multiple factor analysis
NOMENCLATURE
ODBC Open Database Connectivity
OPD Object–Process Diagram
OPL Object–Process Language
OPM Object–Process Methodology
PC Principal components
PCA Principal component analysis
RFC Recency Frequency Cost
RFM Recency Frequency Monetary
RFMTC Recency Frequency Monetary Time Churn probability
RMSE Root mean squared error
RSS Residual sum of squares
SaaS Software-as-a-Service
SEMMA Sample, Explore, Modify, Model and Access
SL Supervised learning
SOM Self-organising maps
SQL Structured Query Language
SSE Sum of squared errors
SSMS SQL Server Management Studio
STP Segmenting Targeting Positioning
SVM Support vector machine
UL Unsupervised learning
Chapter 1
Introduction
This chapter serves as introduction to the research presented in this thesis. The foun-dation of the research is explained by providing background information on the research question, followed by the formal research assignment, research scope, objectives and methodology. Finally, the structure of the document is explained.
1.1
Research background
In recent years, information technology has transformed the way marketing is done and how companies manage information about their customers (Shaw et al.,2001). According
toApeh et al. (2014), in the past, researchers used to apply statistical surveys in order
to study customer behaviour. In today’s fast-moving world of marketing from product-orientation to customer-product-orientation, the management of customer treatment can be seen as a key to achieving revenue growth and profitability (Hosseini and Shabani, 2015). Marketing managers can develop long-term and pleasant relationships with customers if they can detect changes in their purchasing behaviour. To gain more insights into customer behaviour, customer profiles should be constructed. Customer profiles are not the same as demographic information. Demographics usually provide the key dimensions that advertisers seek (age, gender,etc.), whereas profiling groups these dimensions along with other elements (behaviour) in order to create the ideal customer profile (Brown,
2016).
Marketing intelligence, which emphasises the marketing-related aspects of business intelligence, has traditionally relied on market surveys to understand the consumer’s
1.1 Research background
behaviour and improve product design. For example, companies use consumer satisfac-tion surveys to study customer attitudes. Lately, data analytics technology can monitor key factors for strategic marketing decisions, for instance the customers’ opinions on different aspects, namely, a product, service, or company, by using data mining tools
(Fan et al.,2015). According to Fan et al.(2015), integrating mixed information from
different sources provides a complete view of the area of interest and generates more accurate marketing intelligence, while analysis models developed on a single data source may only provide limited insights, leading to potentially biased business decisions.
This research offers an approach to building customer profiles through data mining
tools (i.e. supervised or unsupervised learning) and techniques (i.e. classification, re-gression, clusteringetc.), when having a customer dataset with typical monetary trans-actional data, demographic data and extra value adding customer attributes; which include mobile phone type, medical aid etc. Data mining is a technique used to ex-tract knowledge from information (Chen and Chen, 2010). The goal of data mining differs from one area to another. When applying data mining to analyse data and cre-ate customer profiles, it will help to discover hidden knowledge in datasets to better understand customer behaviour and needs (Shaw et al.,2001). Thus, data mining can be defined, with respect to customer profiling, as being the technology that allows the building of customer profiles (among other functions), where each profile describes the specific habits, needs and behaviour of a customer group. Therefore, developing cus-tomer profiles is an important step for targeted marketing campaigns, for it not only classifies new customers, but also provides information on current customers.
Figure 1.1shows the purpose of the proposedCustomer Super-Profiling (CSP) tool. It functions as a super-profiling analytics tool that receives various customer attributes as input to create customer super-profiles (Walters and Bekker, 2017). The customer attributes include demographic information (age, gender, ethnicity, etc.), transactional data, as well as extra value-adding attributes (transportation type, mobile phone,etc.). Businesses in search of campaign ideas appoint advertising companies to assist them with marketing campaigns. Conversely, advertising companies may be in search of companies/developers that possess a profiling tool to provide them with reliable cus-tomer profiles for targeted marketing campaigns. These advertising companies are the value-creation partners: when they collaborate with the business partner they provide a revenue stream. The value that the advertising companies receive is knowledge about
1.2 Research assignment
Companies in search of campaign ideas
Advertising
companies Business partner Hire Receiv e adv ertisemen ts Hire Customer profiles Transactional data Demographic information
Extra value adding customer attributes
Figure 1.1: Illustrating the use of customer super-profiling (Walters and Bekker,2017).
current and/or potential customers: who they are, what their behaviour and interests are and where to find them. This information provides the companies with insights in order to target suitable customers. The customers’ information (personally identifiable information) is not sold to the advertising companies, they only receive the customer profiles generated after data analysis has been performed by the business partner. After the ‘Facebook–Cambridge Analytica data scandal’ it is important to assure customers that their data and information are utilised and analysed via a safe and legal process
(Lee,2018;Solon,2018).
Instead of stating the traditional research hypothesis, it is appropriate in this study to rather state a research assignment, as presented next.
1.2
Research assignment
Every business, large or small, needs a competitive advantage to distinguish itself from the competition. One of the strategic tasks performed to achieve this advantage is to understand the customers. The work to be done in this research project was inspired by a need experienced by an industry partner of the Industrial Engineering department of Stellenbosch University. The nature of the work is to determine whether a CSP tool can
1.3 Research Scope
be built using large datasets and machine learning. Hence a research assignment can be formulated, as follows:
Develop a CSP tool which considers both demographic and behavioural features of customers utilising more than one data mining tool to generate customer profiles superior to the traditional profiles.
1.3
Research Scope
The scope of the research gives an indication of what the project entails. The data that will be used to develop the customer profiles will be fictitious data, created by a data simulator. The research will focus on at least two data domains which will be identified later. The number of transactions per ‘customer’ in each data domain will be unspecified, yet finite. The amounts/tariffs for each product or service should be realistic and must usually correlate. Different types of customers will be simulated, those spending high, average and low amounts when participating in purchasing activities, as well as those participating in activities frequently, average and less frequently.
The research will include an assessment of different data analytics tools and tech-niques, which will guide the researcher to select the appropriate tools and techniques for the type of data that will be utilised. The objectives pursued to support the research assignment are discussed next.
1.4
Research objectives
The following objectives were stipulated in order to complete this research:
1. Determine if it is possible to develop aCustomer Super-Profiling (CSP) tool that has the ability to analyse a large dataset.
2. The CSP tool should be able toutilise various Big Data Analytics tools and tech-niques andgeneratecustomer super-profiles which have more value than the typical demographic data (see also Figure 1.1).
1.5 Research problem-solving methodology
1.5
Research problem-solving methodology
In order to achieve the objectives of this research, the following approach and method-ology are proposed:
1. Conduct a comprehensive literature review by getting accustomed to relevant as-pects in the domain of:
(a) Segmentation (b) Customer profiling
(c) Marketing strategies (d) Big Data Analytics
i. Data Analytics processes ii. Data cleaning
iii. Data transformation
iv. Data mining and machine learning
2. Develop a solution architecture. This architecture will be the symbolic represen-tation of the structural relations between objects in the system and its processes, demonstrating the planned abilities of the CSP tool.
3. Determine the customers’ demographic and behaviour features that will be simu-lated for this research.
4. Develop a data simulator that is able to create customer datasets, which is nec-essary to provide the super-profiling tool with data. To conduct this research, big datasets are necessary. The data simulator will determine the structure and content of the data. Eventually, a different user of this super-profiling analytics tool could provide their own data, as long as the data have the same format and structure.
5. Validate the data simulator together with the datasets created (step 4). This is done to ensure that the customer data is reliable for use and analysis. Performing validation on the data simulator will also enable the researcher to create other datasets following the same principle.
1.6 Deliverables envisaged
6. Design anddevelopthe CSP tool that contains a suite of data analytics techniques. The suite should contain more than one data mining tool (i.e. unsupervised and supervised learning).
7. Demonstrate the CSP tool by utilising the simulated South African demographic customer dataset. Thevalidation of the CSP tool should be performed on another dataset(s), which will build confidence in the profiling capability of the tool. 8. Draw conclusions based on the results received from both the demonstration and
the validation. These results should be able to provide a point of departure for future research.
Steps 2, 3 and 4 strive to fulfil Objective1. The architecture that will be developed in step 2 will provide a broad overview of the tool, indicating the abilities and functionalities of the tool. The customers’ demographic and behavioural data (steps 3 and 4) will function as the big datasets to be analysed.
Steps 1, and 4 to 8 will be performed in pursuit of Objective 2. Step 1 will provide the researcher with understanding of the various data analytics tools and techniques, as well as background on transitional customer profiles. Step 4 will also be used to achieve this objective, because the type of data that is available determines the data analytics techniques that can be utilised. Steps 5 to 8 will be performed to test, validate and document the results received from the CSP tool.
1.6
Deliverables envisaged
It is envisaged that this research will provide another point of departure in the domain of Big Data Analytics. The researcher will be developing a CSP tool containing a suite of Big Data Analytics tools and techniques that will allow for customer super-profiling. Guidance, to operate the CSP tool, will be provided from the architecture, while the aim of the tool is to build reliable customer models for targeted marketing campaigns.
1.7
Structure of the document
This chapter contains a description of using data analytics to develop customer profiles. This led to the formulation of the research assignment, objectives and methodology.
1.7 Structure of the document
In Chapter 2, a literature review on segmentation and customer profiling is pre-sented. This includes various segmentation models as well as the evolution of capturing customer information, and lastly marketing strategies.
Chapter3provides a comprehensive literature review regarding Big Data Analytics. The chapter includes an introduction to Big Data, Big Data Analytics and data mining, with application areas and references to various data mining tools and techniques as well as machine learning algorithms.
The theoretical background and literature reviews conducted in the previous chapters provide knowledge to develop a solution architecture for the proposed data simulator and CSP tool, which is described inChapter 4. This chapter includes a toy problem as well as a big dataset problem to illustrate the solution architecture.
The demonstration and validation of the CSP tool is presented within Chapter
5. The demonstration is performed by utilising the customer datasets, whereas the validation is performed on different datasets. This chapter also includes several business case scenarios. The summary and general conclusions of the research are presented in
Chapter 6.
Appendix A presents the process of creating domain-specific datasets, as well as the validation of the datasets. The datasets are created in MatlabR and imported into MicrosoftR SQL ServerR. Key descriptors of the information system are included in
Appendix B, and pseudocode for the data simulator is shown inAppendix C. This concludes Chapter 1. A literature review on segmentation and customer profiling is presented next.
Chapter 2
Segmentation and customer
profiling
The previous chapter served as an introduction to this research. It stated the back-ground, the problem and clearly defined the scope. The objectives were introduced and the research methodology was developed. The structure of the document was also pre-sented in Chapter 1. Chapter 2 contains a literature review in order to fulfil Objective
2. The literature will focus on segmentation and customer profiling. The chapter will commence by outlining segmentation and the drawbacks involved in performing segmen-tation. This is followed by a brief development history of customer profiling and then defining customer profiling. Thereafter, two customer profile types will be reviewed.
Segmentation is often used in conjunction with profiling. However, segmentation is a term used to describe the process of dividing customers into homogeneous groups on the basis of shared or common characteristics/attributes, e.g. habits, tastes, etc., while customer profiling is describing customers based on their personal attributes, such as
age, gender, income and lifestyles. Having these two components, marketers can de-scribe which marketing actions to take for each segment and then allocate resources to the segments in order to meet specific business objectives. Therefore, literature regard-ing a marketregard-ing strategy concludes Chapter 2. However, as this chapter expresses the viewpoint of an industrial engineering researcher, it is not as comprehensive as would be expected of a marketing student.
A synthesis at the end of the chapter will include the researcher’s view and interpre-tation of what was observed while performing this review.
2.1 Segmentation
2.1
Segmentation
Segmentation is performed on an unordered customer dataset and is the process of
separating markets into groups of potential customers with similar needs and/or charac-teristics, who are likely to exhibit similar purchasing behaviour (Weinstein,2013). Seg-mentation is also seen as a way to have more targeted communication with customers
(Jansen,2007). According to Jansen (2007), the process of segmentation describes the
characteristics of the customer groups, called the segments, or clusters, within the data. Literature does not provide a plausible difference between market segmentation and customer segmentation, therefore the researcher took the view that market segmentation is generally used for high-level strategy, whereas customer segmentation provides a more detailed view. Market segmentation is a well-known and popular marketing technique and its benefits are emphasised in numerous marketing research textbooks (M¨uller and
Hamm,2014).
2.1.1 Market segmentation
Market segmentation was first defined by Smith (1956), as being based upon develop-ments on the demand side of the market and representing a rational and more precise adjustment of product and marketing effort to customer requirements, thus providing a conceptual view of an inherently heterogeneous market. Marketing segmentation in-volves viewing a heterogeneous market (external heterogeneity) as a number of smaller homogeneous markets (internal homogeneity), in response to differing preferences, re-garded as being caused by the desires of customers for more precise satisfactions of their varying wants (Wedel, 2002). In other words, searching for a process that minimises differences between members of a segment and maximises differences between segments. The segmentation approach must yield segments that are meaningful and applicable to specific marketing problems and then tailor a marketing mix for the targeted segments, rather than offering the same marketing mix to a huge heterogeneous group (Liu et al.,
2012;Smith,1956).
A fundamental task of market segmentation is to group the customers based on similarities in their needs, characteristics and preferences (Liu et al.,2012; M¨uller and Hamm, 2014). According to Weinstein (2013), the objective of segmentation research is to analyse markets, find niche opportunities and capitalise on superior competitive
2.1 Segmentation
positions. This process is begun by selecting one or more groups of users as targets for marketing activity and developing unique marketing programmes to reach these prime prospects (market segments). Similarly, Ungerer (2015) defined the purpose of market segmentation to be to meaningfully leverage scarce resources and target specific needs of different customer groups. This implies that different customer segments have different needs, and therefore it is vital to tailor specific offerings to them.
2.1.1.1 Dimensions for conducting market segmentation
According to Weinstein (2013), it is recognised that segmentation is both a science and an art. There are many alternative methods for segmenting business markets and several of these approaches are derived from the consumer behaviour field (Weinstein,
2013). Decision-making is impacted by both rational and emotional factors (e.g., demo-graphics, geographic, benefits, motivations, needs, purchasing habits, etc.). Customer demographic and socio-economic measures (age, gender, income, etc.) can be studied, and product consumption can be evaluated. In addition to these measures, credit card utilisation, brand loyalty and price sensitivity issues may also be insightful for segment-ing the market. These variables provide evidence that the options are many; therefore, further research is necessary to determine the best approach(es), as indicated by Wein-stein(2013).
The output of segmentation depends on the data that are available for use. However, there are some relatively standard segmentation proposals that fit with the most needs-based (Goyat,2011) or value-based segmentation initiatives (Nguyen,2016). Segmenta-tion usually utilises customer attributes (Jansen, 2007). The following short examples and definitions, as referred to by Weinstein (2013) and Liu et al. (2012), illustrate six common business segmentation dimensions in action:
1. Geographic location of a customer: Collecting and analysing information according to the physical location of the customer is often used in marketing, for companies selling products and services would like to know where their products are being sold in order to increase advertising and sales efforts at that location. When referring to geographic features, it includesregion, size of city or town, density and climate
2.1 Segmentation
2. Business demographics: A graphic supplies distributor can easily target adver-tising agencies by using business demographic variables or firmographics. Using
Advertising Age and Adweek references, the company is able to find information about anticipated size, media specialisation, services offered, major accounts, key personnel, etc.
3. Adopter categories: Classifying customers on the basis of their degree ofreadiness
to try a new product. Market researchers have identified five categories that exist in every market segment. Customers with the highest readiness are innovators, venturesome customers and risk takers who are the first users; these customers comprise 2.5% of the target market. Early adopters are status-oriented opinion leaders and represent about 13.5% of the target market. Early majority from the leading segment of the mass market; about 34% of the target market. Late majority
are followers of the early majority and are also about 36% of the target market, and finally, laggards the conventional, price-conscious segment; making up about 14% of the target market.
This segmentation dimension can be most informative for new product concepts using exploratory studies and qualitative procedures.
4. Benefits: A form of market segmentation, based on the differences in specific benefits that different groups of customers or companies look for in a product. It may be price, service, special features, and/or reputation of the seller (Xerox or Brand X). A benefit to one customer (enhanced features) may be a drawback to another (higher price).
5. Product usage: An approach often used by marketers is based on product or brand usage by customers. Product usage segmentation can take a number of directions, for example, the marketer may want to identify various segments of users for a particular product category or users of the company’s brand. Marketers may also want to segment customers into those who buy frequently versus those who buy occasionally, or into those who usually purchase just one brand versus those who switch from brand to brand. In addition, the ‘best’ customer can be identified by several criteria: number of orders, revenues, unit sales, profitability, share of customer volume,etc.
2.1 Segmentation
6. Purchasing approaches: Characteristics of traditional and strategic purchasing ap-proaches differ, they may be reactive or proactive, short term or long term, non-integrative or non-integrative,etc. For example, Dell’s strategy of seeking sophisticated buyers and large accounts; not requiring much ‘hand-holding’, is accepted as ac-curate target marketing.
According to Ungerer(2015), customer groups represent separate segments if: 1. Their needs require and justify a distinct offer.
2. They are reached through different distribution channels. 3. They require different types of relationships.
4. They have substantially different profitabilities.
5. They are willing to pay for different aspects of the offer.
This could involve segmentation by means of geographic location, social standing, com-mon needs, comcom-mon behaviour and other attributes (Ungerer,2015).
Segmentation is essential to cope with today’s dynamically fragmenting consumer marketplace. By utilising segmentation, marketers are more effective in channelling resources and discovering opportunities. The overall objective of using a market seg-mentation strategy is to improve customer satisfaction and the competitive position of a business as well as better serve the needs of the customers. This is accomplished by tailoring a unique marketing mix (strategy) for targeted segments and in the process achieving maximum efficiency (Liu et al.,2012;Weinstein,2013).
2.1.1.2 Methods for conducting marketing segmentation
A common tool used for grouping customers with similarities is calledclustering. Accord-ing to Hosseini and Mohammadzadeh (2016), the process of collecting a set of physical or abstract objects into groups of similar objects is called clustering. Both the academic researcher and the marketing applications researcher rely on the technique for devel-oping empirical groupings of persons, products, or occasions which may serve as the basis for further analysis. The aim of applying the clustering technique is to maximise
2.1 Segmentation
within-segment homogeneity (Punj and Stewart,1983). Each segment is a group of ho-mogeneous customers that marketers can identify, target and communicate with (Liu et al.,2012).
In early market segmentation research, clustering was synonymous with market seg-mentation (Liu et al.,2012). However, as the spectrum of market segmentation expanded to studies concerning customer interaction with marketing mix, the market segmenta-tion techniques evolved to simultaneously considering multiple sets of variables (more than one segmentation base). According to Liu et al. (2012), market segmentation is constantly under investigation by researchers. There is an abundance of segmentation methods available, includingk-means clustering, hierarchical clustering, automation de-tection, classification and regression trees, neural networks,etc. The overall objective for utilising a market segmentation strategy is to improve a business’s position and better serve the needs of the customers. This is accomplished by discovering and characterising customer groups and attaining profitable customer segments (Weinstein,2013).
2.1.2 Customer segmentation
As mentioned, the difference between market segmentation and customer segmentation is still unclear and the researcher takes the view that customer segmentation provides a much more detailed view of the customers. This section will discuss customer segmen-tation and the different approaches.
According to Chan (2008), most marketers experience difficulties in identifying the right customers to engage in successful campaigns. Thus far, customer segmentation is a popular method that is used for selecting appropriate customers for a campaign.
Bose and Chen(2009) mentioned that for product advertising and promotions, there are
mainly two approaches that are used in practice;mass marketing and direct marketing. Mass marketing targets large groups of customers; it does not distinguish between cus-tomers within a cluster/group and the information delivered to cuscus-tomers is uniform, whereas direct marketing targets individuals or households. Different customers are subjected to different marketing information.
Direct marketing is defined as “the delivery of a marketing message or proposition to a target customer or potential customer, in a customer favourable format, put to the customer for the seller or the seller’s agent without an intermediary person or indirect
2.1 Segmentation
media involved”, while customer segmentation is the classification of the different cus-tomers that exist in a market, based on similar needs, product or service requirements, or some other characteristics (Ungerer,2015). It can be concluded that direct marketing classifies customers so that personalised advertising and promotional activities can be targeted to specific classes of customers (Bose and Chen,2009), and therefore, customer segmentation can be linked to direct marketing.
Customer segmentation can be performed by utilising various models (Berger and
Nasr,1998;Jain and Singh,2002;Khajvand et al.,2011;Kim et al.,2006;Sarvari et al.,
2016). However, theRecency, Frequency and Monetary (RFM) model, which represents
customer behaviour characteristics, may be the most powerful and simplest technique for generating knowledge from customer relationship management (CRM) data (Dursun
and Caber,2016). This model will be discussed next in more detail.
To achieve business success, engaging in effective campaigns is a key task for mar-keters. Traditionally, marketers first segment the market, and then target profitable customers. However, this process brings forth problems, for the correlation between customer segments and a campaign is neglected. Therefore, as stated by Jonker et al.
(2004), it is necessary to consider significant campaign-dependant variables of customer targeting in customer segmentation. An approach to combine customer segmentation and customer targeting for campaign strategies was defined by Chan (2008). The in-vestigation identifies customer behaviour, using the well-known Recency,Frequency and
Monetary (RFM) analytical model. The ‘R’ refers to the duration of time between the last purchase time and the time of the ‘survey’. The desired state is shorter in duration, so that R is bigger. The ‘F’ indicates the total number of purchases during a specific period, thus the desired state is a bigger F-value, which means that there has been a high repetition of purchases, and the ‘M’ indicates the monetary value spent during one specific period, where the desired state is for there to be much money, so M is bigger (Sarvari et al.,2016).
After using the RFM model to represent the customers’ behaviour, the data is coded (encoded) into five categories. This is seen as one of the traditional applications of the RFM model, and is called ‘the customer quintile method’. By coding, each customer is compared with all the others, depending on the variables used (Chan,2008;Dursun and
Caber,2016). If the value lies between 100% and 80%, the categorical value is set to 5,
2.1 Segmentation
into 125 (5×5×5) equal clusters. The customers who obtain the highest RFM scores are generally the company’s most profitable customers.
The purpose behind utilising the widely used behavioural-based data mining method, RFM, is to analyse the customer’s behaviour and then make predictions based on the be-haviour in the database (Wei et al.,2010). This model is used in various research areas, which defines valuable customers as those simultaneously having highrecency, frequency
and monetary values. According toHosseini and Shabani(2015), one of the most effec-tive customer segmentation models, based on customer value, is the RFM model. By adopting the RFM model, decision-makers have the ability to identify valuable customers and then develop effective marketing strategies (Wei et al.,2010). Previous studies show that “the bigger the values of R and F are, the more likely the customers are going to produce a new trade with the company; the bigger the M is, the more likely the customers are going to buy more services or products from the company” (Cheng and
Chen,2009).
The application of the RFM model is as follows. According toWei et al.(2010) and
Sarvari et al. (2016), the RFM model measures when customers have purchased lately
(recency), how often (frequency) and how much (monetary) they spent. Customers’ past purchases can effectively predict their future purchase behaviour. Companies can identify which customers are entitled to be contacted according to their past purchase behaviour based on the RFM model approach, which is extensively applied in database marketing and is a common tool to develop marketing strategies. When applying the RFM model, the customer’s name and address need to be assigned by a unique key (account number) and order; the sales information also needs to be stored, with the unique key included in each transaction record (Kahan,1998). Utilising the analysis of the RFM model,Thompson(1999) applied the RFM model to classify customers into (1) uncertain customers, (2) spenders, (3) frequent customers and (4) the best customers.
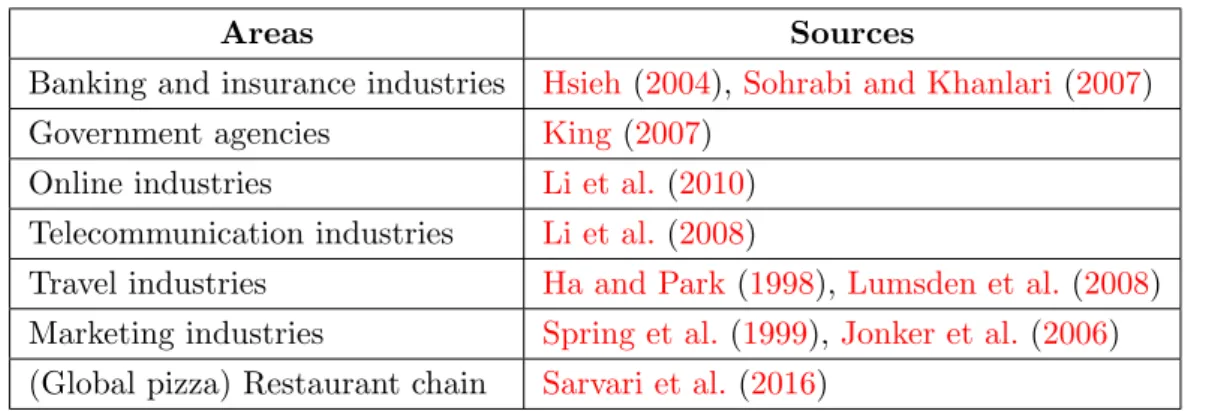
The RFM model has been widely applied in many practical areas (Wei et al.,2010) and its indicators are adaptable to measure customer value and to segment customers in different service areas (Dursun and Caber, 2016), as seen in Table 2.1. In addition to the areas listed in Table2.1,Wei et al.(2010) mentioned that the RFM model could be used to segment customers, calculate customer value and customer lifetime value, observe customer behaviour, estimate the response probability for each offer type and evaluate online reviewers.
2.1 Segmentation
Table 2.1: Practical areas where the RFM model has been applied
Areas Sources
Banking and insurance industries Hsieh(2004), Sohrabi and Khanlari(2007) Government agencies King(2007)
Online industries Li et al.(2010) Telecommunication industries Li et al.(2008)
Travel industries Ha and Park(1998), Lumsden et al.(2008) Marketing industries Spring et al. (1999),Jonker et al. (2006) (Global pizza) Restaurant chain Sarvari et al. (2016)
There are, however, both advantages and disadvantages when utilising the RFM model (Dursun and Caber,2016;Wei et al.,2010). The advantages include:
1. RFM is a powerful tool for assessing customer lifetime value, which is also combined with frequency pattern mining techniques.
2. RFM is cost-effective in acquiring important customer behaviour analysis and can easily quantify customer behaviour, where customers and transactional data can be stored in an accessible electronic form. Therefore, decision-makers can easily understand the application of the RFM model.
3. RFM is beneficial in predicting response and has the ability to boots a company’s profits in the short term.
4. It is very effective to model using RFM variables as purchasing behaviour can be summarised by using a very small number of variables.
5. RFM variables are gathered via an internal database that contains customer-specific information regarding the transaction history and are not obtained through the aggregate level information in the demographic databases. Thus, RFM is more meaningful for targeting particular customers.
6. RFM is a well-known method used to measure the strength of the customer rela-tionship as it can effectively identify valuable customers.
Although the RFM model is seen as a crucial tool for businesses to develop marketing strategies, it also has disadvantages, which include:
2.1 Segmentation
1. Given that the RFM model aims at identifying valuable customers in companies, it only focuses on ‘the best customers’. It provides little meaningful scoring on recency, frequency and monetary when most customers do not buy often, spend little and have not purchased lately. This is particularly true for most company sales, and is referred to as thePareto Principle –the 80/20 Rule. The Pareto rule states that 80% of the results come from 20% of the causes, similarly; 20% of the customers contribute to 80% of the company sales.
It can be said that the model ignores the analysis of new companies setting up in a short period and customers that only purchased once and placed small orders. These customers are referred to as type 1-1-1 customers and it is stated that they are the biggest customer segment and may have the greatest untapped potential. 2. The RFM model can only use a limited number of selection variables. The
simplic-ity of the RFM model has been overemphasised, while its abilsimplic-ity to differentiate has little to be considered.
3. There are usually high correlations between the Frequency and Monetary values. 4. RFM focuses on a company’s current customers and cannot be applied to scouting
for new customers as a marketer does not have transactions for prospects.
5. RFM estimates a single response model for all the customers in the database, and therefore assumes the database is homogeneous, which is contradictory to the real situation, for customers often have considerable heterogeneity.
6. The RFM model is not introduced as a precise quantitative model and the impor-tance of each RFM measure is different between industries and applications. However, the weaknesses in some areas of the RFM model led to the disadvantages being discussed. These disadvantages introduce some minor modifications or exten-sions on the RFM model, for instance, it was suggested by Miglautsch (2002) that sub-segmentation can help to identify 1-1-1 customers, involving three classes of vari-ables, (1) internal purchase information, (2) geo-demographic information connected to postal code, and (3) customer variables.
2.1 Segmentation
There are, however, numerous studies in favour of combining two types of data. The most popular combination is that of the customer’s demographic data plus their pur-chasing history. The purpur-chasing history is important for direct marketing, for marketers can predict the choices of customers more effectively than by using only demographic data (Bose and Chen,2009).
Behavioural data has gained the favour of most researchers, and they have been using this data in various situations, industries and under various conditions, which include adding extra parameters, leading to theextendedRFM analysis method (Khajvand et al.,
2011). These models are also referred to asexpandedoradapted RFM models. Due to the RFM model’s disadvantages, researchers have attempted to improve the predictability of RFM models through adding additional variables to predict customer behaviour or develop new models to test whether they perform better than the traditional RFM model
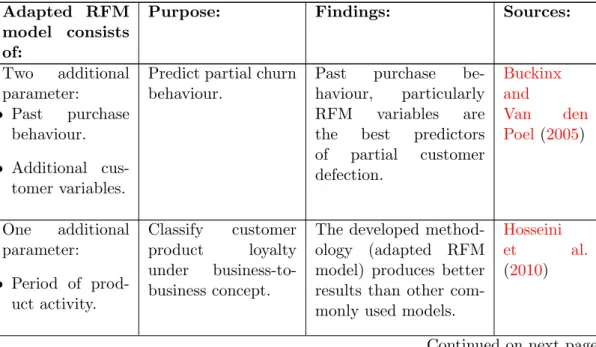
(Wei et al.,2010). Table2.2provides a review of researchers who adapted the traditional
RFM model.
Table 2.2: Previous research regarding the adapted RFM model
Adapted RFM model consists of:
Purpose: Findings: Sources:
Two additional parameter: • Past purchase behaviour. • Additional cus-tomer variables.
Predict partial churn behaviour.
Past purchase be-haviour, particularly RFM variables are the best predictors of partial customer defection. Buckinx and Van den Poel (2005) One additional parameter: • Period of prod-uct activity. Classify customer product loyalty under business-to-business concept.
The developed method-ology (adapted RFM model) produces better results than other com-monly used models.
Hosseini
et al.
(2010)
2.1 Segmentation
Adapted RFM model consists of:
Purpose: Findings: Sources:
Two additional parameters (RFMTC): • Time since first
purchase.
• Churn probabil-ity.
Selecting targets for direct marketing from a database to-gether with estimat-ing the probability that a customer will purchase a next time and the expected value of the total number of times that the customer will purchase in the future.
The proposed RFMTC model provides more predictive accuracy than the RFM model.
Yeh et al.
(2009)
Change RFM to Recency, Fre-quency and Cost (RFC) model.
Targeting the highest-scoring citizens (e.g. drug users, vandals, noisy neighbours) in order to improve or reduce their use of services.
English authorities are planning to use this technology to assist them to understand their citizens better, for example, who is entitled to more benefits, or who is due for a visit from a social worker.
King(2007) One additional parameter: • Count item. Performing segmen-tation on customers.
Adding the extra pa-rameter makes no dif-ference to the clustering results. Khajvand et al.(2011) One additional parameter: • Weighted RFM (WRFM). Determine loyalty degree of product to achieve an excellent CRM. Massive improvements in classifying accuracy of loyal customers. Hosseini et al. (2010) One additional parameter: • Weighted RFM (WRFM). Measure customer loyalty and estimat-ing the customer loyalty rate.
The results indicated high precision when us-ing the WRFM.
Zalaghi
and Varzi
(2014)
2.1 Segmentation
Adapted RFM model consists of:
Purpose: Findings: Sources:
One additional parameter: • Types of cus-tomers. Propose a loyalty measurement model.
The proposed segmen-tation model makes cus-tomers feel good, in-creases the sales for a company and helps to reach more targeted customers. Bunnak et al. (2015) Combination of WRFM model and demographic attributes.
Determines the best approach to cus-tomer segmentation and extrapolate associated rules for this, based on the RFM considera-tions, as well as demographic factors.
Results showed that having an appro-priate segmentation approach is vital if there are strong asso-ciation rules. Weight of RFM attributes affects rule association performance positively; moreover, to capture more accurate customer segments, a combi-nation of RFM and demographic attributes is recommended for clustering. Sarvari et al. (2016) Use 3, 5 and 7 categories/classes while performing RFM. Determine cus-tomer loyalty of the different category sizes, enhance clas-sification accuracy.
Difficult to determine the best situation, it is a trade-off. Smaller classes (3) increase the accuracy rate as well as the number of target customers, while bigger class sizes (5,7) have a lower accuracy rate, but a smaller customer group to target.
Cheng
and Chen
(2009)
As seen in Table 2.2, the weighted RFM is used by various researchers, and can be employed as follows. First the R, F and M-values are specified for each customer and then their weights, which represent their relative importance, are determined using the analytical hierarchical process (AHP) method and each customer’s value is calculated
2.1 Segmentation
based on the WRFM-value (Zalaghi and Varzi, 2014). It can be concluded that the weights differ for each research area where the RFM model is applied, as the importance of each variable (R,F and M) differs for each application area.
After performing customer segmentation, a customer segmentation and segment anal-ysis should take place. There are various methods for analysing segments, these include statistical and machine-learning methods. After the analysis, the result enables mar-keters to plan and set up marketing strategies for each segment. Next, the drawbacks concerning segmentation will be discussed.
2.1.3 Segmentation drawbacks
Construction of user segmentation is not an easy task. The drawbacks associated with segmentation, mentioned byJansen (2007), are:
1. Relevance and quality of data: These aspects are essential to develop meaningful segments. If the customer data is insufficient, the meaning of customer segmen-tation is unreliable and can almost be seen as worthless. On the other hand, too much data can lead to complex and time-consuming analysis. Poorly organised data (different formats, different source systems) makes it difficult to extract ap-plicable information. The use of too many segmentation variables can be confusing and results in segments that are unfit for decision-making. As a result, effective variables may not be identified. Many of these problems are due to an inadequate customer database.
2. Continuous process: Segmentation demands continuous development and updating as new customer data is acquired. In addition, effective segmentation strategies will influence the behaviour of the customers affected by them. Therefore reclas-sification of customers will need to be kept in mind.
3. Over-segmentation: A segment can become too small to be treated as a separate segment.
2.2 History of customer profiling
2.2
History of customer profiling
Customer profiling is a way to create a portrait of a customer to help make design de-cisions concerning a company’s services. Customers are normally divided into groups of customers that share similar goals and characteristics. One of the goals of creat-ing customer profiles is to ensure a better relationship with customers. The better the relationship, the easier it is to conduct business and generate revenue, this is usually referred to as CRFM. According to Soltani and Navimipour(2016), CRM is a manage-ment philosophy and strategy which enables a company to optimise revenue and increase customer value and service quality through understanding and satisfying the individual customer’s needs. This section will make use of a time-line, as seen in Table 2.3, to uncover the history behind sales and the profiling platform that has transformed the business over the past few decades, with the help of various researchers referred to in the literature (Lyle,2015;Reni,2017;Soltani and Navimipour,2016).
Table 2.3: Evolution of capturing customer information
Year Method
1894: The telephone switchboard: The telephone switchboard was the first ma-jor milestone for the customer, for it allowed the customer to easily re-solve problems and receive product information without having to travel. The switchboard operator assists callers by answering the call and con-necting the caller to the correct person or department. This invention planted itself firmly as an integrated part of customer relations for the next hundred years.
1950s: The ledger: Businesses used pen and paper to track basic sales and information.
1960s: The call centres: These centres were centralised offices used for receiving or transmitting large volumes of requests by telephone. These centres and the contact centre solutions that were developed were the beginnings of what are now customer service departments.
Early 1980s:
The Rolodex: The Rolodex offered companies the ability to spin through paper records, adding new customers while updating existing customer information, details and more.
Late 1980s:
Database marketing: This new process allowed companies to collect and analyse customer information; this enabled businesses to create cus-tomised communications in order to promote a product or service for marketing purposes (also known as direct marketing).
2.3 Customer profiling
Year Method
Early 1990s:
Contact management software: This software enabled businesses to eas-ily collect, store, find and organise customer contact information into what was effectively digital Rolodex.
1995: Sales force automation: This is an integrated application of customised relationship management tools that effectively automate sales inventory, leads, forecasting, performance and analysis.
Late 1990s:
The acronym CRM is created.
2000: Mobile and SaaS: CRM continues to evolve and by the end of the century, the first mobile CRM solution is introduced, as well as the first Software-as-a-Service (SaaS) CRM product.
Currently: Innovations: Companies begin to see CRM as a way to manage all busi-ness relationshipsvia a single platform. Key approaches include:
1. Increasing CRM’s operability with legacy software. 2. Offering the platformvia cloud.
3. Dramatically increasing the power of mobile and subsequently so-cial CRM.
2.3
Customer profiling
Behaviour-based relationship marketing begins with customer profiling (Yankelovich and Meer,2006). The termcustomer profiling involves a wide range of marketing and service approaches. Customer profiling provides a basis for marketers to interact with existing customers in order to offer them better services and retaining them. A customer profile is a snapshot of who a customer is, how to reach them and why they buy. In short, a customer profile is a collection of information that describes the customer. Customer profiling is the process of developing a profile using relevant and available information to describe the characteristics of an individual customer and to be able to identify discriminators from other customers and drives for their purchasing decisions (Ntawanga et al.,2010).
Profiling can be as simple as retaining credit card information at an e-commerce site or as complex as correlating a customer’s demographic information with the rel-evant market segment statistics. Customer profiling is done by building a customer’s behaviour model and estimating its parameters (Jansen, 2007). Customer profiling is
2.3 Customer profiling
a way of applying external data to a population of possible customers. According to
Yankelovich and Meer(2006), the purpose of profiling is toidentify potential customers
who could generate the maximum profit anddetermine the best possible ways of market-ing to those customers, be it individuals or business enterprises. Thus, the goal remains to be that of building reliable customer models for targeted marketing campaigns, and consequently, better profitability (Romdhane et al., 2010). However, the effective util-isation of customer profiling has been a challenge for business enterprises (Yankelovich
and Meer,2006).
Customer data analysis enables the identification of customer profiles and customer preferences for specific products and services, as well as indicating the most appropriate channels to reach the customer and assess the profitability and life-time value of every individual (Zopounidis,2012). The simplest way suggested for determining the manner in which to target new customers, is to profile existing ones (Yankelovich and Meer,
2006). While profiling, a firm identifies the characteristics of its best customers and then targets the non-customers with similar characteristics. These ‘non-customers’ may be first-time purchasers from the firm, or even individuals who have purchased from other divisions of the firm. According to Jansen (2007), there are various ways to use customer profiling, it all depends on the data available. It can be used to prospect for new customers or even to recognise existing bad customers.
A simple customer profile is a file that contains at least age and gender (Jansen,2007). If one needs profiles for specific products, the file would contain product information and/or volume of money spent (Jansen, 2007). According to Yankelovich and Meer
(2006), profiling is key for behaviour-based marketing.
Figure2.1offers a very basic understanding of the segmentation and profilin