Innovation and Job Creation
in a Global Economy:
The Case of Apple’s iPod
Greg Linden1, University of California, Berkeley Jason Dedrick, School of Information Studies, Syracuse University Kenneth L. Kraemer, University of California, Irvine
Abstract
Globalization skeptics argue that the benefits of globalization, such as lower consumer prices, are outweighed by job losses, lower earnings for U.S. workers, and a potential loss of technology to foreign rivals. To shed light on the jobs issue, we analyze the iPod, which is manufactured offshore using mostly foreign-made components. In terms of headcount, we estimate that, in 2006, the iPod supported nearly twice as many jobs offshore as in the United States. Yet the total wages paid in the United States amounted to more than twice as much as those paid overseas. Driving this result is the fact that Apple keeps most of its research and development (R&D) and corporate support functions in the United States, pro-viding thousands of high-paid professional and engineering jobs that can be attributed to the success of the iPod. This case provides evidence that innovation by a U.S. company at the head of a global value chain can benefit both the company and U.S. workers.
1 This article represents solely the views of the authors and not the views of the U.S. International Trade Commission or any of its individual Commissioners. This paper should be cited as the work of the authors only, and not as an official Commission document. All of the authors are associated with the Personal Computing Industry Center (PCIC) of the University of California, Irvine. PCIC is one of the Sloan Foundation Industry Studies Centers. This research has been supported by grants from the Alfred P. Sloan Foundation. The authors are grateful to Clair Brown and Tim Sturgeon for their comments on earlier drafts. Any opin-ions and conclusopin-ions are those of the authors and do not necessarily reflect the views of the Sloan Foundation or the reviewers.
Introduction: Does U.S. Innovation Help U.S. Workers?
Innovation is widely touted as the key to long-term economic prosperity, and concerns have been raised as to whether the United States is investing enough in innovation to drive future growth (Hamm 2009). A related but different issue is the extent to which innovation by U.S. companies will benefit American workers in an era when production and even research and development (R&D) are increasingly done offshore. Concerns about the location and quality of jobs have taken on a new policy relevance in light of proposals to support innovation and American competitiveness (Obama 2011). How many of the jobs created by innovative industries receiving public funds are likely to remain in the United States?
In order to shed some light on this issue, we look in detail at the global value chain (Gereffi et al. 2005) that designs, builds, and brings iPods to consumers and estimate the jobs and wages sustained by this innovative product line. Electronics is one of the most global industries, with vast quantities of goods consumed in the United States imported from Asia, especially China. Yet we find that most of the high-paying jobs in the iPod value chain are still in the United States, even though more jobs overall are offshore. Furthermore, according to our estimates, the total wages paid to the U.S. workers are more than double those paid overseas. This article presents and discusses our findings. Although the iPod has been superseded in Apple’s activities by iPhones and iPads, there have been no changes in Apple’s value chain that would lead us to expect any qualitatively different outcome to the findings here with respect to the share of U.S. employment and wages.
Jobs in the U.S. high-tech industry
For over two decades the U.S. economy has been marked by growing income inequality and concerns about the “vanishing middle class.” The factors driving these developments are complex. For the hard-hit blue-collar sector, the causes of decline in jobs include increased use of automation and the continued expansion of manufacturing jobs in low-wage countries. Recently, white-collar workers like engineers are feeling similar pressures.
One industry that has seen a dramatic shift of manufacturing out of the United States is computers and peripherals. As recently as 2000, over one-third of the jobs in the U.S. computer industry were production jobs. By 2007, the number of production workers had fallen to less than one-sixth of total U.S.
employment, and total production jobs had been cut in half just since 2002 (figure 1). At the same time, white collar employment in the U.S computer industry was falling much more slowly, by about 10 percent in total from 2002 to 2007.
Most of the factory jobs for high-volume electronics are gone and unlikely to return. Automation has limited the growth of manufacturing jobs worldwide, even as output continues to expand.2 Small electronic goods like iPods and
cell phones use tiny components with extremely tight tolerances in fit and quality that require machine precision and thus cannot be assembled by hand.
Figure 1 U.S. employment in the computer and peripherals industry
Source: Bureau of Labor Statistics, Occupational mployment tatistics for NAICS 334100 (Computer and Peripheral Equipment Manufacturing), various years.
2 Economic studies have found that the negative impact of automation on jobs for less-educated workers is typically several times that of trade or outsourcing (e.g., Paul and Siegel 2001). 0 50,000 100,000 150,000 200,000 250,000 2002 2003 2004 2005 2006 2007 # of employees Production Non-production
Yet, despite the decline in U.S.-located manufacturing of computers and peripherals from $90 billion in 2000 to just $56 billion in 2006 (Reed Electronics 2008), U.S. companies continue to be leaders in PCs, printers, networking equipment, and new categories such as portable music players, tablets, and smart phones. U.S. companies such as Apple and Hewlett-Packard have successfully coordinated global value chains to develop and manufacture their products while focusing their own efforts on design, marketing, branding, and distribution.
What is not known is whether innovative U.S. companies will continue to keep white-collar jobs in the United States to benefit from agglomeration economies and the highly-skilled workforce even as the knowledge base improves in overseas locations where production is outsourced.3 If white-collar jobs
such as engineering stay close to headquarters, then innovation can serve as a driver of high-wage employment in the United States. But if globalization leads to a hollowing out of professional jobs as well as manufacturing in the United States, then U.S. innovation will only benefit shareholders, consumers, and a small number of top managers and professionals in the United States. Data at the national level, such as those in figure 1, point to trends in U.S. employment, but do not allow us to understand it in a global context. To develop a better understanding of how the value of innovation is distributed across the global value chains of high-tech companies, we have conducted a two-stage study of the distribution of value in the global value chain of Apple’s iPod product line.
In the first stage, we looked at which companies and countries capture
financial value, using higher-end Apple iPods as a case study (Linden et al. 2009). We found that the largest share of financial value (defined as gross margin) went to Apple, which captures a large margin on each iPod. Although the iPod is assembled in China, the value added in China is very low.
In the current stage of our research, we examine the value of innovation defined in terms of jobs and wages associated with the design, manufacturing, and distribution of all Apple iPods and major components in 2006. In this report, we estimate the number of jobs supported by the iPod in the United States and overseas, broken down as production, nonprofessional, and
3 For a discussion of these issues as they relate to engineering jobs, see National Academy of Engineering (NAE). Committee on the Offshoring of Engineering (2008).
professional jobs. We also estimate the total earnings paid to workers in each of those categories by country.
Jobs in the iPod value chain
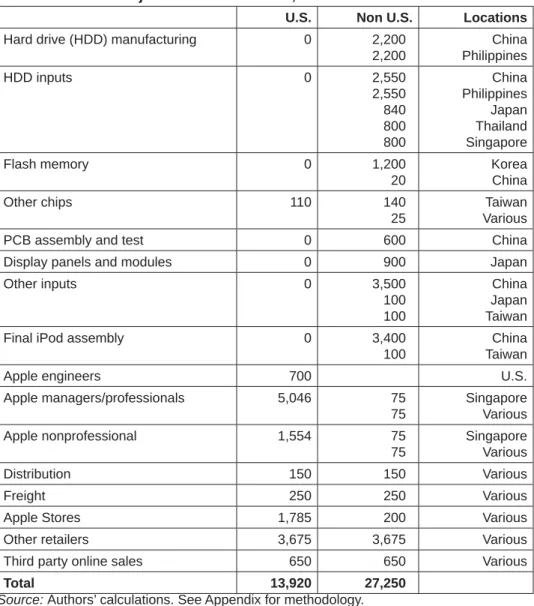
Table 1 presents our estimates, made without the participation of Apple Inc., of jobs at various steps of the iPod value chain by country in 2006. We estimated that there were nearly 14,000 U.S. jobs, mostly Apple employees and workers in the retail channel. Outside the United States, there were about 27,000 jobs, mostly in China and elsewhere in the Asia-Pacific region where the iPod and its components are manufactured, and also in countries where the iPod is sold and distributed.
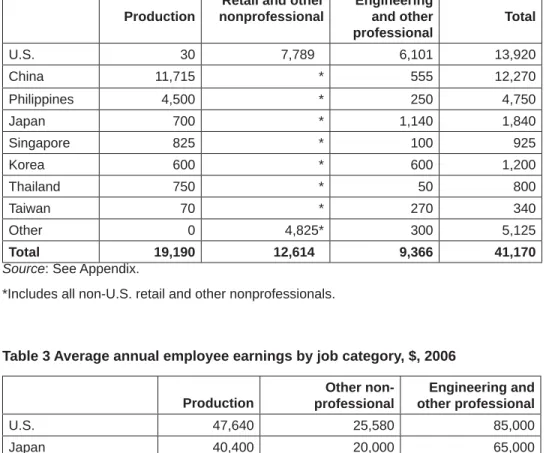
Table 2 shows how those jobs were distributed by country and category. In the United States, there were 7,789 nonprofessional jobs (primarily in retail and distribution) and 6,101 professional jobs (primarily at Apple’s headquarters), including management, engineering, computer support, and a variety of other categories. The 30 production jobs (and a similar number of the professional jobs) reflect the fabrication of some of the iPod’s chips in U.S. plants.
The many retail and distribution jobs are not all attributable to Apple’s innovation, since retailers would be selling something else, possibly from a non-U.S. company, if iPods did not exist. The majority of the professional jobs, however, can be attributed to the fact that Apple is a U.S.-headquartered company with a high concentration of managerial and R&D activities in the United States.
In the Asia-Pacific region, we estimated that iPod-related manufacturing accounted for over 19,000 production jobs and over 3,000 professional jobs. In Asia, Europe, and elsewhere, we estimated another 4,825 jobs in distribution, retail, transportation, and other post-manufacturing activities.
Earnings in the iPod value chain
Next we looked at the wages earned by the estimated 41,170 workers involved with the iPod. For production workers, we used international comparative rates compiled by the U.S. Bureau of Labor Statistics (BLS). Average professional and nonprofessional wages were found in various sources detailed in the Appendix. Table 3 presents average earnings for the United States and Asia-Pacific countries in each category. Wages for Apple employees used a more fine-grained estimation procedure also described in the Appendix.
Table 1 iPod-related jobs in the value chain, 2006
U.S. Non U.S. Locations Hard drive (HDD) manufacturing 0 2,200
2,200 China Philippines HDD inputs 0 2,550 2,550 840 800 800 China Philippines Japan Thailand Singapore Flash memory 0 1,200 20 Korea China Other chips 110 140 25 Taiwan Various
PCB assembly and test 0 600 China
Display panels and modules 0 900 Japan
Other inputs 0 3,500 100 100 China Japan Taiwan
Final iPod assembly 0 3,400
100
China Taiwan
Apple engineers 700 U.S.
Apple managers/professionals 5,046 75 75 Singapore Various Apple nonprofessional 1,554 75 75 Singapore Various Distribution 150 150 Various Freight 250 250 Various
Apple Stores 1,785 200 Various
Other retailers 3,675 3,675 Various
Third party online sales 650 650 Various
Total 13,920 27,250
Table 2 iPod-related jobs by country and category
Production
Retail and other nonprofessional Engineering and other professional Total U.S. 30 7,789 6,101 13,920 China 11,715 * 555 12,270 Philippines 4,500 * 250 4,750 Japan 700 * 1,140 1,840 Singapore 825 * 100 925 Korea 600 * 600 1,200 Thailand 750 * 50 800 Taiwan 70 * 270 340 Other 0 4,825* 300 5,125 Total 19,190 12,614 9,366 41,170
Source: See Appendix.
*Includes all non-U.S. retail and other nonprofessionals.
Table 3 Average annual employee earnings by job category, $, 2006
Production Other non-professional Engineering and other professional U.S. 47,640 25,580 85,000 Japan 40,400 20,000 65,000 Korea 29,440 15,000 30,000 Taiwan 12,860 7,000 20,000 Singapore 17,110 9,000 20,000 Philippines/Thailand 2,140 1,500 15,000 China 1,540 1,000 10,000
Source: See Appendix.
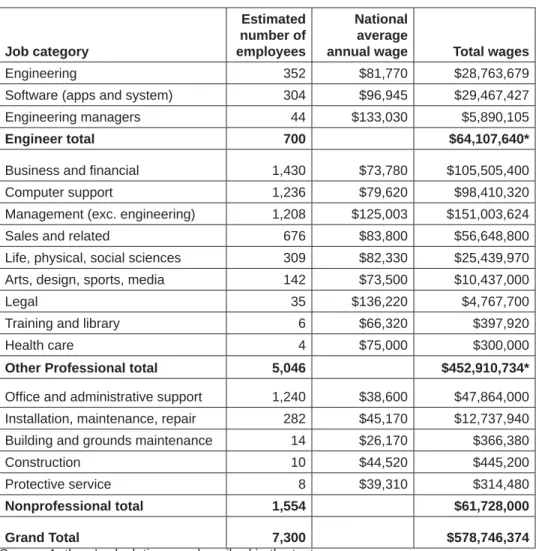
Table 4 uses the job and wage estimates, with adjustments detailed in the Appendix, to calculate the total earnings paid by country and category. We estimated that workers received over $1 billion in earnings from iPod-related jobs in 2006, or about $25 per unit sold. Of this total, nearly $750 million went to U.S. workers and about $320 million, less than half as much, to workers outside the United States.
Table 4 iPod-related wages by country and category, $, 2006 Production Other non-professional Engineering and other professional Total Apple (overhead) 0 61,728,000 488,410,000 550,138,000 Apple Stores 0 43,486,000 7,225,000 50,711,000 Other U.S. 1,429,200 114,010,060 29,580,000 145,019,260 Total U.S. 1,429,200 219,224,060 525,215,000 745,868,260 Japan 28,280,000 0 74,100,000 102,380,000 Korea 17,664,000 0 18,000,000 35,664,000 Taiwan 900,200 0 8,100,000 9,000,200 Singapore 14,115,750 0 2,000,000 16,115,750 Philippines 9,630,000 0 3,750,000 13,380,000 Thailand 1,605,000 0 750,000 2,355,000 China 18,041,100 0 5,550,000 23,591,100 Other 0 96,500,000* 19,500,000 116,000,000 Total non-U.S. 90,236,050 96,500,000 131,750,000 318,486,050
Source: Authors’ calculations. See Appendix.
*Includes all non-U.S. retail and other nonprofessionals.
Over two-thirds ($525 million) of the earnings in the United States went to professional workers, and an additional $220 million to nonprofessional workers. While most of the nonprofessional jobs were relatively low-paying retail positions, we estimated that nearly $50 million went to administrative jobs at Apple for which we used the national average wage of $38,000 a year; actual Silicon Valley wages were probably even higher.
Outside the United States, total earnings were divided more evenly between the production and professional categories. Over half the professional earnings were paid in Japan and Korea, where the suppliers of most of the high-value components (hard drives, flash memory, and displays) are headquartered. Retail and distribution jobs were spread around the world in countries where the iPod is sold.
Conclusions: Globalization’s impact
on U.S. workers
• The relationship between innovation by U.S. companies and employment in the United States is more complex than phrases such as the “vanishing middle class” suggest. When innovative products are designed and marketed by U.S. companies, they can create valuable jobs for American workers even if the products are manufactured offshore. Apple’s tremendous success with the iPod and other innovative products in recent years has driven growth in U.S. employment, even though these products are made offshore. These jobs pay well and employ people with college degrees. They are at the high end of what might be considered middle-class jobs and appear to be less at risk of vanishing from the United States than production jobs.
• Production jobs are unlikely to recover in the United States, and, in any case, they form an uncertain basis for job creation in the future. Even China is losing some new factory investments to lower-cost locations like Vietnam. Production jobs in the rapidly changing electronics industry can also be undermined by obsolescence. For example, the 12,000 jobs in Asia we estimated for iPod-related hard drive production were at risk because Apple shifted the storage in most of its iPod models to flash memory, which requires far fewer workers to produce.
• It is more important than ever that all children receive an education that prepares them for 21st-century jobs. Retail jobs are no substitute for higher-paying information jobs such as computer programming. For instance, according to the BLS, the average hourly wage for “computer support specialists” is $22, while a retail salesperson makes only $12.4
Unfortunately, the continuing loss of manufacturing jobs, which pay better than retail jobs, means fewer opportunities for non-college educated workers. Even the administrative jobs that pay reasonably well at companies such as Apple often require education beyond the high school level.
4 http://www.bls.gov/oes/current/oes_nat.htm for occupation codes 15-1041 and 41-2031.
• Professional jobs are at risk on multiple fronts. Many U.S. high-tech companies are investing in white-collar job creation offshore to tap pools of low-cost talent and gain access to growing markets (NAE. Committee on the Offshoring of Engineering 2008). The offshore jobs often support high-value jobs in the United States, but this may not always be the case. Also, if U.S. companies lose their innovation leadership to foreign competitors, those competitors do not typically employ many engineers or other professionals in the United States.
References
Dedrick, Jason, and Kenneth L. Kraemer. 2008. Impact of globalization and
off-shoring on engineering employment in the personal computing industry. In The
offshoring of engineering: Facts, unknowns, and potential implications; National Academy of Engineering (NAE). Committee on the Offshoring of Engineering. Washington, DC: National Academies Press.
Gereffi , Gary, John Humphrey, and Timothy Sturgeon. 2005. The governance of
global value chains. Review of International Political Economy 12 (1): 78–104.
Hamm, Steve. 2009. Is Silicon Valley losing its magic? Business Week, January 12,
28–33.
Linden, Greg, Kenneth L. Kraemer, and Jason Dedrick. 2009. Who captures value in a global innovation system? The case of Apple‘s iPod.
Communications of the ACM 52 (3): 140–44.
NAE. Committee on the Offshoring of Engineering. 2008. The offshoring of
engineer-ing: Facts, unknowns, and potential implications. Washington, DC: National Academies Press.
Obama, Barack. 2011. Remarks by the President in State of Union Address (January 25).
Washington, DC: White House. Accessed January 26, 2011 at
http://www.white-house.gov/the-press-offi ce/2011/01/25/remarks-president-state-union-address.
Paul, Catherine J. Morrison, and Donald S. Siegel. 2001. The impacts of technology,
trade and outsourcing on employment and labor composition. Scandinavian Journal
of Economics 103 (2): 241–64.
Appendix: Methodology
This appendix details our methodology for calculating estimates of iPod-related jobs and wages for Apple and its partner companies during calendar year 2006.
The firms directly involved will not provide data, and we have found no systematic third-party source of data on employment by firm or by industry. Our task was further complicated by the fact that we were looking at jobs associated not with an industry but with a single product line, which to our knowledge had never been done before. To arrive at our estimates, we used company reports, interviews with similar companies, government data, data from industry analysts, and other sources. We were conservative about the U.S.-overseas gap by “rounding up” overseas estimates and “rounding down” for the United States.5
Job estimation
We began by estimating the number and wholesale value of iPods sold in 2006. As described in detail below, we apply these numbers to various data sources to generate our estimates of manufacturing and other lower-pay workers in the value chain. We then used percentages derived from company reports and interviews to determine the corresponding number of higher-pay workers.
For Apple, we estimated the number of total jobs by starting from iPod sales as a percentage of Apple’s total sales and applying this ratio to Apple’s total employment. We then divided the jobs at Apple among higher- and lower-paying job categories, as discussed below.
5 We were estimating how many workers around the world were supported by the iPod value chain. We were not investigating the trickier question of how many incremental jobs existed solely because of the iPod. For fi nal assembly and for major components like fl ash memory chips, the iPod accounts for so many jobs that most can safely be considered incremental. For components like displays, for which iPods account for a smaller share of factory output, the answer was less clear. For example, the number of production workers might have varied with output, while the supervisory and other professional employees might have been a fi xed cost of running the factory.
We now present a more detailed description of the process:
1. We began with estimates of the number and wholesale value of iPods of various types sold in 2006. From the first stage of our research, in which we analyzed the value of the components in the iPod, we were able to calculate how many of each component was used over the course of 2006. For example, each of some 30 million Nano iPods contained eight flash memory die assembled in two packages of four die each.
2. For total employment at most points along the value chain, our estimates derived from at least one of the two following methods:
(a) Factory Fraction Method: Given the quantity of a given type of component used in 2006, we determined the percentage it represents of the output of a typical plant (as determined by discussions with industry experts for the major inputs). We applied this percentage to the staff level of that plant. For example, the 240 million flash die were equivalent to the output of a medium-sized microchip factory, which would have required a staff of roughly 1,200.
(b) Revenue Fraction Method: Given the total value of a given type of component used in 2006, we determined the percentage this represented of the sales of a company specializing in that component. We applied this percentage to the company’s total employment. For example, we estimated that approximately $1 billion worth of iPods were sold online globally in 2006. That year, Amazon (with $10.7 billion in sales and 13,900 employees) required roughly 1,300 employees to sell each $1 billion in goods. Using that as our benchmark, we apportioned the employees between the United States and overseas, since iPods are sold through a variety of Web sites worldwide and overseas sales were about half the total of all iPod sales.
In practice, method (a), which ignores support and overhead staff, always yields a lower number than method (b). To the extent possible, we applied both methods and looked at multiple factories or multiple firms to improve the accuracy of the estimate.
3. For higher-paying engineering and management jobs, our estimates were based on firm interviews and site visits, wherein we developed ratios of engineering and management staff to manufacturing jobs. Applying these ratios to the staff estimates from step (2) enabled us to generate estimates of the number of managerial and technical people related to manufacturing. For example, in a microchip factory, roughly half the workers were highly-paid engineers and managers, so the 1,200 workers in method 2a above, were split evenly between lower-pay and higher-pay.
4. For the iPod-specific jobs at Apple itself, which included many high-paying jobs in design, software, marketing, and administration, we started from iPod sales as a percentage of Apple’s total sales and applied this ratio to Apple’s total employment, as in method 2b above. Our method for determining the distribution of jobs among several pay grades of Apple professionals, managers, and non-professionals employees is described below under “Wage estimation.”
5. The number of Apple engineers and of Apple’s own retail store employees are separate in Table 1 because we had specific sources of information about these subcategories.
Wage estimation
For non-Apple jobs, we used the following sources for the wage rates in table 3: Production: The production earnings were based on the hourly rates given in table 2 of the Bureau of Labor Statistics (BLS) news release “International Comparisons of Hourly Compensation Costs in Manufacturing, 2006” (http:// www.bls.gov/news.release/pdf/ichcc.pdf). Thailand was not listed, so we assumed the same rate as the Philippines. The 2006 hourly rates were annualized by assuming 2,000 paid hours per year. For China, we used a 2004 rate, reported separately on page 4 of the same document.
Nonprofessional: For the United States, we used the average wage for “retail salespersons” at electronics stores from BLS “May 2006 National Industry-Specific Occupational Employment and Wage Estimates” (http://www.bls. gov/oes/2006/may/naics3_443000.htm#b41-0000). For other countries, we applied the ratio of the U.S. production and nonprofessional wages to the production wage of each country, rounding the result to reflect lack of precision. In practice, the only non-U.S. nonprofessional wage that mattered
was Japan’s. We applied this to the total of non-U.S. nonprofessional employees because it produced the largest possible total for non-U.S nonprofessional wages, and we wanted to be conservative about estimating the difference between total wages in the United States and in the rest of the world.
Professional: We used “professional” to designate all higher-wage jobs, including managers. The “professional” wages in table 3 were based on engineering salary estimates reported in Dedrick and Kraemer (2008, table 5). For the countries not covered there (South Korea, Singapore, the Philippines, and Thailand), we extrapolated based on our knowledge of the level of development of the electronics industry in each country, as well as consulting salary reports about other professional job categories. We liberally rounded the estimates upward so as not to overstate the difference with the United States.
All of Apple’s iPod-supported jobs can be regarded as “overhead” (nonproduction) workers. Of this group, we had information from a well-placed source that Apple’s iPod division employed approximately 700 engineers (software, engineering, and engineering managers) in 2006.
To estimate Apple’s total iPod overhead employment (perhaps including some who might not be directly related to the iPod but can be thought of as employed by Apple because of the iPod’s success), we started with the ratio (about 51 percent) of iPod sales (but not music sales) to total sales (excluding Apple Stores, which we estimated and reported separately) and applied it to Apple’s total employment (excluding Apple Stores) of 14,400. After subtracting out the 700 engineers mentioned above and choosing a lower round number to be conservative, we were left with an estimate of 6,600 overhead employees other than engineers.
To estimate the distribution of these non-engineer overhead employees across a range of occupations, we apportioned them based on the frequency of non-production jobs listed for NAICS 334100, Computer and Peripheral Equipment Manufacturing, in May 2006 as reported by the BLS (http://www. bls.gov/oes/2006/may/naics4_334100.htm).
To calculate the total wage bill, we applied the national average wages for each job category in the BLS data to our employment estimates. When calculated using these national averages, which are probably lower than the actual wages paid in Silicon Valley, the average wage for engineers and the
other high-salary categories worked out to be $89,978. To be conservative, we capped these job categories at the $85,000 wage listed in Table 3, which was also used to calculate the earnings of the 433 other U.S. professionals included in table 2.
The national averages were used for the categories listed as “Nonprofessional” in table A1, since this employment, mostly office jobs, is different from the retail work of most others in the nonprofessional category, and their average annual salary works out to $39,722. The earnings of the remaining U.S. nonprofessionals were calculated at the $25,580 wage shown in table 3.
Table A1 Estimated iPod-related jobs at Apple, 2006 Job category Estimated number of employees National average
annual wage Total wages
Engineering 352 $81,770 $28,763,679
Software (apps and system) 304 $96,945 $29,467,427 Engineering managers 44 $133,030 $5,890,105
Engineer total 700 $64,107,640*
Business and fi nancial 1,430 $73,780 $105,505,400
Computer support 1,236 $79,620 $98,410,320
Management (exc. engineering) 1,208 $125,003 $151,003,624
Sales and related 676 $83,800 $56,648,800
Life, physical, social sciences 309 $82,330 $25,439,970 Arts, design, sports, media 142 $73,500 $10,437,000
Legal 35 $136,220 $4,767,700
Training and library 6 $66,320 $397,920
Health care 4 $75,000 $300,000
Other Professional total 5,046 $452,910,734* Offi ce and administrative support 1,240 $38,600 $47,864,000 Installation, maintenance, repair 282 $45,170 $12,737,940 Building and grounds maintenance 14 $26,170 $366,380
Construction 10 $44,520 $445,200
Protective service 8 $39,310 $314,480
Nonprofessional total 1,554 $61,728,000
Grand Total 7,300 $578,746,374
Source: Authors’ calculations as described in the text.
* For reference only; the calculation reported in the main text used the average earnings from table 3.