Grant agreement n°283576
Final report on RAD
service chain evolution
Date:
07/2014
Lead Beneficiary:
DLR (#11)
Nature:
R
3 / 9
Table of Contents
1. Hardware changes ... 5
1.1 Change to EUMETCast DVB-S2 receiver standards ... 5
1.2 Change in hardware at DLR ... 5
1.3 Change in hardware at Armines ... 5
2. Improvements in the data handling software ... 5
2.1 Change in the rsync scheme between NRT and backup antenna system ... 5
2.2 Ingest of MSG cloud products in the DIMS product library ... 6
2.3 Extraction of cloud product subsets in the DIMS CLOUDS tailor ... 7
2.4 Collecting MACC products from ECMWF site ... 7
2.4 Collecting APOLLO products from DLR FTP site ... 8
5 / 9
1. Hardware changes
1.1 Change to EUMETCast DVB-S2 receiver standards
EUMETSAT is intending to change its EUMETCast Europe service from the S to the DVB-S2 receiver standard in August 2014 (EUMETSAT, 2014). Within DLR’s EUMETSAT Ozone SAF (Satellite Application Facility) activities a new receiver has been ordered and hardware is delivered already. Also, the antenna system will be changed during the summer in order to operate a larger dish with a better signal/noise ratio. EUMETSAT is planning to operate both standards until the end of 2014. This allows a test phase for autumn 2014 within MACC-III.
1.2 Change in hardware at DLR
Generally, all hardware as operated in the offline and online processing chains at DLR are routinely monitored and without any need to do replacements.
1.3 Change in hardware at Armines
Armines has subcontracted to Transvalor the use of the hardware for running the
applications McClear (provision of time-series of radiation under clear skies) and HelioClim-4 (provision of time-series of radiation). Transvalor has taken all the necessary steps for
ensuring a duplication of the databases (MACC products, DLR APOLLO products, and other elements to run the McClear model).
Transvalor has installed a SSD harddisk in order to speed up the execution time of the McClear model. Execution time has decrease by a factor 10 or so.
2. Improvements in the data handling software
2.1 Change in the rsync scheme between NRT and backup antenna system
DLR is operating two fully separate MSG reception stations in Oberpfaffenhofen. One is located on the roof of the German Remote Sensing Data Center (DFD), while the other is located on the top of the Institute of Atmospheric Physics (IPA). Both antenna systems are connected to separate rolling and final archives. The rolling archives are realised as disk storages, while the final archive at DFD is the robot archive and therefore, the DIMS (Data Integration & Management System) Product Library (PL).
Up to now, each night a full rsync between the both rolling archives has been performed. When setting up the online cloud product processing chain, this has changed to a more frequent exchange every 15 min in order to increase the reliability of the online processing chain.
The cloud product processing waits about 13 min after the nominal acquisition time for the MSG data to appear on the DFD’s rolling archive. After that, it tries to retrieve other satellite names as it might be that the replacement satellite has taken over due to any failure of the primary MSG satellite. And finally, after 15 min of waiting the rsync with the second rolling archive at DLR-IPA is started – but in contrast to the daily rsync at night time, this is done for the individual MSG slot only in order to keep the timeline of the online processing chain.
2.2 Ingest of MSG cloud products in the DIMS product library
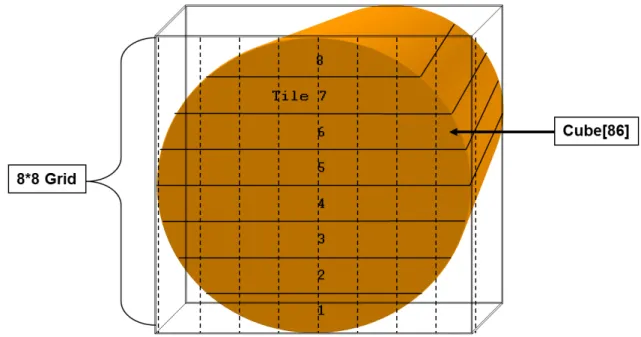
It has been described previously (D122.1) how MSG cloud products
MSG.SEVIRI.L2.CLOUDS.CUBE und MSG.SEVIRI.L2.CLOUDS.DISC are stored in a cube-wise structure in the DIMS product library. This is a pre-requisite to provide fast access to the data e.g. in a time series format as requested by users.
Figure 2-1. Tile (1 to 8) and cube (8 x 8 cubes) structure as used in the Lv1.5 cube definition
In order to provide stable and separate test and operations environments, a complete copy of the data ingest and data extraction software has been created in the DIMS Test &
Integration environment. Extended tests of the data ingestion within this T&I environment have been performed. This allows also in future keeping separate test and operations implementations which is an urgent requirement for stable operations in future.
In parallel, the creation of the cube-wise data has been proceeded. There are only a few months still missing and DLR is close to have a full cube-wise dataset of MSG products for 2004 to 2013 on the hard disks. The ingestion of these products has been started and it is expected that it will be completed at the end of MACC-II (July 2014).
Additionally, the DIMS product model has been extended in order to be able to additionally store the full disk cloud products (MSG.SEVIRI.L2.CLOUDS.DISC-PRIMD and
MSG.SEVIRI.L2.CLOUDS.DISC-QAD) for those users wishing to retrieve full field of view data. The full disk cloud products are packed in daily tar files inside this new product. Also, this is a backup for the data structure as being transferred in the online processing chain to
Armines. As data storage got so cheap in the meanwhile, we are now able to store the same data but in two data structures – one being optimized for time series access and the other for map creation access over larger areas.
7 / 9
The T&I implementation of this product has been completed and the software to generate these new daily packed products is ready. The daily full disk product package generation will be started as soon as the cube-wise product generation has finished. The ingestion is
planned afterwards – either until the end of MACC-II or at the beginning of MACC-III.
2.3 Extraction of cloud product subsets in the DIMS CLOUDS tailor
DLR subcontractor Werum worked on the finalisation of the DIMS MSG TAILOR – a software system allowing the retrieval of time series of cloud products out of the product library. The user can select a line/element location as defined by MSG image coordinates and will get a time series of all MSG cloud parameters as stored in the Product Library. Alternatively, a MSG image coordinate and some neighbourhood e.g. with a width of N pixels can be
defined. For the central coordinate the time series is extracted as an ASCII file and the cloud parameters in the neighbourhood are extracted as a time series in a netcdf data format. As a third option, a region can be specified by an upper left and lower right MSG image
coordinate. Also, for this, an ASCII formatted time series is created for the center coordinate and a netcdf data file includes a time series of this data subset.
The tailor scheme automatically generated packages of monthly or annual time series – depending on the data amount requested – which is driven by the spatial amount of data requested. It cuts the subset requested out of one or more data cubes and glues the pieces together as the user requests – therefore the name ‘tailor’. Therefore, the internal DIMS product cube structure is hidden to the user – any user can obtain the data subset requested.
This functionality existed for the SOLEMI database and its Meteosat First Generation raw data. It has now been adapted to Meteosat Second Generation cloud products with their different internal data representation, their inverse geolocation principle, the higher temporal resolution and the larger amount of different cloud parameters stored. It also realizes a functionality DLR had used several years in its development environment and being coded in IDL. To enhance the speed of data extraction, it has now been re-coded in C and implemented within the DIMS system.
2.4 Collecting MACC products from ECMWF site
Armines is collecting MACC products daily and stores them into a database in HDF format. This is automated. The duplication of the database in another storage at Transvalor is currently performed manually on a weekly basis.
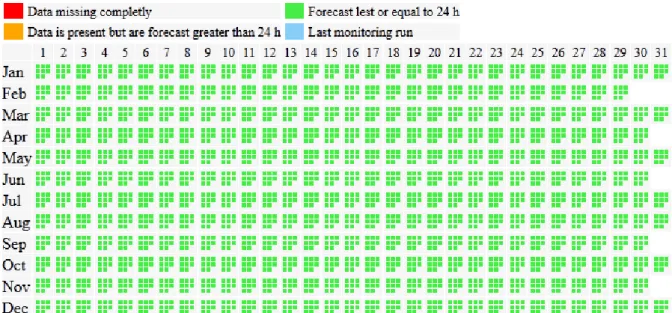
A tool has been set up for a visual monitoring of the status of the collection of MACC products. Fig. 2-1 is an example of the automatic monitoring of the collection of data from ECMWF for total column content in ozone.
Figure 2-1. Example of graph automatically created for monitoring the collection of data from ECMWF for total column content in ozone. Year is 2012. Each row corresponds to a month; days are in column. Each cell (month, day) is made of eight squares, corresponding to the 3 h values. Red means that data is missing, orange that data is present as a forecast with a horizon greater than 24 h, green that data is an analysis or a forecast less than 24 h. The blue square indicates the latest monitoring run.
2.4 Collecting APOLLO products from DLR FTP site
Armines, and more exactly Transvalor within the sub-contract, is collecting APOLLO
products daily. The APOLLO data are in a format that reminds that of the Meteosat images, i.e. ordered by pixels for a same time slot. These data are reformatted to write them in a format favouring the extraction of time-series and are stored into a database in HDF format. This is automated. The duplication of the database in another storage at Transvalor is
currently performed manually on a weekly basis.
3 Additional ground measurements for validation
Generally, for an operational validation of MACC RAD irradiance data bases the
international BSRN (Baseline Surface Radiation Network) is used. It is operationally available and provided both global and direct irradiances in high quality and temporal resolution. Unfortunately, the spatial distribution of the BSRN network is rather coarse.
The collection of the BSRN data is an-going activity both at Armines and DLR. Information, data and processing tools are shared between both partners.
9 / 9
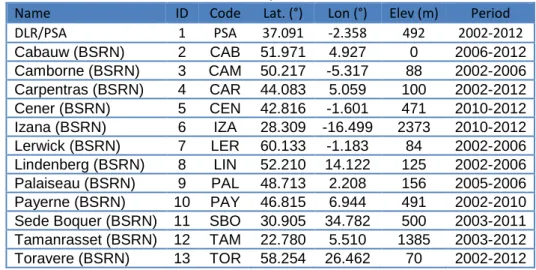
Tab. 3-1: BSRN and DLR/PSA station availability 2002-2012
Name ID Code Lat. (°) Lon (°) Elev (m) Period
DLR/PSA 1 PSA 37.091 -2.358 492 2002-2012 Cabauw (BSRN) 2 CAB 51.971 4.927 0 2006-2012 Camborne (BSRN) 3 CAM 50.217 -5.317 88 2002-2006 Carpentras (BSRN) 4 CAR 44.083 5.059 100 2002-2012 Cener (BSRN) 5 CEN 42.816 -1.601 471 2010-2012 Izana (BSRN) 6 IZA 28.309 -16.499 2373 2010-2012 Lerwick (BSRN) 7 LER 60.133 -1.183 84 2002-2006 Lindenberg (BSRN) 8 LIN 52.210 14.122 125 2002-2006 Palaiseau (BSRN) 9 PAL 48.713 2.208 156 2005-2006 Payerne (BSRN) 10 PAY 46.815 6.944 491 2002-2010
Sede Boquer (BSRN) 11 SBO 30.905 34.782 500 2003-2011
Tamanrasset (BSRN) 12 TAM 22.780 5.510 1385 2003-2012
Toravere (BSRN) 13 TOR 58.254 26.462 70 2002-2012
Based on personal contacts with staff members from the former company Solar Millennium AG, it seems to be possible to access privately generated direct and global irradiance
measurements obtained in Southern Spain between 2008 and early 2012. This covers 17 stations operated in the regions of Murcia, Extremadura and Andalusia. Originally, these stations were all restricted and not accessible commercial data. Due to the insolvency of Solar Millennium AG these measurements are now ‘dead data’ for solar power plant project developers. Therefore, the insolvency manager was supportive to the idea of ‘rescuing these measurements for the scientific purpose’ and DLR is currently in the process of purchasing the data for a rather low amount. This will be available for a spatially much better resolved validation study in MACC-III.
References
EUMETSAT, 2014: http://www.eumetsat.int/website/home/ TechnicalBulletins/EUMETCast/DAT_2082113.html