University of Nebraska - Lincoln University of Nebraska - Lincoln
DigitalCommons@University of Nebraska - Lincoln
DigitalCommons@University of Nebraska - Lincoln
Theses, Dissertations, and Student Research in
Agronomy and Horticulture Agronomy and Horticulture Department
8-2018
Spray Characterization and Herbicide Efficacy as Influenced by
Spray Characterization and Herbicide Efficacy as Influenced by
Pulse-Width Modulation Sprayers
Pulse-Width Modulation Sprayers
Thomas R. ButtsUniversity of Nebraska-Lincoln
Follow this and additional works at: https://digitalcommons.unl.edu/agronhortdiss
Part of the Agriculture Commons
Butts, Thomas R., "Spray Characterization and Herbicide Efficacy as Influenced by Pulse-Width
Modulation Sprayers" (2018). Theses, Dissertations, and Student Research in Agronomy and Horticulture. 146.
https://digitalcommons.unl.edu/agronhortdiss/146
This Article is brought to you for free and open access by the Agronomy and Horticulture Department at
DigitalCommons@University of Nebraska - Lincoln. It has been accepted for inclusion in Theses, Dissertations, and Student Research in Agronomy and Horticulture by an authorized administrator of DigitalCommons@University of Nebraska - Lincoln.
BY PULSE-WIDTH MODULATION SPRAYERS
by
Thomas R. Butts
A DISSERTATION
Presented to the Faculty of
The Graduate College at the University of Nebraska In Partial Fulfillment of Requirements For the Degree of Doctor of Philosophy
Major: Agronomy & Horticulture (Weed Science)
Under the Supervision of Professor Greg R. Kruger
Lincoln, Nebraska August, 2018
BY PULSE-WIDTH MODULATION SPRAYERS
Thomas R. Butts, Ph.D. University of Nebraska, 2018 Advisor: Greg R. Kruger
Pesticide applications are a heavily scrutinized facet of today’s agricultural industry, and a concerted effort to optimize each application needs to be implemented. More precise and efficient pesticide applications are necessary to meet regulatory demands and increase economic efficiency through reduced pesticide inputs. Current pesticide application methods using precision technologies, including pulse-width
modulation (PWM) sprayers, can assist with these goals. However, vast advancements in pesticide formulations, adjuvants, and nozzles, as well as the increasing popularity of PWM systems, have only increased the need for applied PWM and weed science
research. Additionally, efforts have been placed on increasing spray droplet size to reduce particle drift, but this practice has led to reduced herbicide efficacy. Therefore,
identifying an optimum herbicide droplet size which can reduce particle drift while simultaneously maintaining efficacy is a necessity.
The objectives of this research were to: (1) identify the influence of application parameters on droplet size, droplet exit velocity, nozzle tip pressure, and spray pattern uniformity from a PWM sprayer, (2) create best use PWM recommendations to optimize pesticide applications from these sprayers, (3) investigate the effect of spray droplet size
and carrier volume on the efficacy of multiple herbicide solutions, (4) establish novel weed management recommendations based on an optimum droplet size, and (5) determine the plausibility of using PWM sprayers in site-specific weed management strategies.
The results of this research have led to more precise PWM sprayer operation through clear and concise best use recommendations. The capability of PWM sprayers to make precise and uniform applications can assist with the reduction of spray particle drift and increase the overall application effectiveness. Additionally, site-specific weed
management strategies were effectively established and optimum herbicide droplet sizes were estimated across a wide range of geographies and weed species. Although,
convoluted interactions were identified between droplet size, carrier volume, and other application parameters in regards to their effect on herbicide efficacy. As a result of this research, applicators can more effectively utilize PWM sprayers, reduce herbicide inputs, mitigate spray particle drift, and reduce the selection pressure for the evolution of
For my family,
Your love and support made all of this possible.
“No other human occupation opens so wide a field for the profitable and agreeable combination of labor with cultivated thought as agriculture.”
ACKNOWLEDGEMENTS
Throughout the course of my Ph.D., I have received an overwhelming amount of support, encouragement, and assistance from numerous individuals. First, I would like to thank my major professor, Dr. Greg Kruger for providing me the opportunity to pursue a Ph.D., and for providing the freedom and resources to investigate any research topic I found interesting. I also owe a large debt of gratitude to my committee members, Drs. Brad Fritz, Clint Hoffmann, and Joe Luck, for all of their time and efforts reviewing my manuscripts and providing insightful, technical feedback, as well as providing a
collaborative sounding board to bounce ideas off of. Further, I would sincerely like to thank Dr. Vince Davis for giving me an opportunity to start my scientific journey as a Master’s student, teaching me the skills and attitude required to be successful, and for the continued mentorship moving forward into the future.
I need to thank numerous people within the Pesticide Application Technology Laboratory including: Jeff Golus, Ryan Henry, Annah Geyer, Chandra Hawley, and Kasey Schroeder. All of you provided an endless amount of help, advice, and friendship during my time in North Platte, and that has meant the world to me. Furthermore, to all of my fellow graduate students and undergraduate assistants, thank you for the assistance with conducting my research, and for turning into lifelong friends. The friendships gained will not be lost no matter the continent we stand on. I also need to thank my colleagues and friends at North Dakota State University and Mississippi State University for their assistance with replicating my field experiments, as well as thank the industry partners
that provided equipment and technical support, often voluntarily, for me to complete my research accurately and timely.
Additionally, I need to thank my family for their love and support over the years. Mom: the visits, phone calls, and endless encouragement mean more to me than I could ever express. You taught me the value of hard work, and I continue to strive to make you proud every day. Dad: thank you for teaching me persistence, to never give up, and always putting a smile on my face, specifically when I struggled to grow weeds in a greenhouse for 6 years. Finally, I would like to thank my wife, Libby. Your love, encouragement, and positivity push me forward every day, and I would never have had the courage to accomplish the things I have without you. I love you!
Last, but not least, I would like to thank Mother Nature for providing such a persistent and aggravating problem as the agricultural weed so I can spend my life working towards understanding them better.
TABLE OF CONTENTS
ACKNOWLEDGEMENTS ...v
LIST OF TABLES ...x
LIST OF FIGURES ... xiii
LIST OF EQUATIONS ... xvii
LIST OF APPENDIX TABLES ... xviii
LIST OF APPENDIX FIGURES... xix
CHAPTER 1. LITERATURE REVIEW ...1
Application Technology Introduction ...1
Spray Drift and Spray Pattern ...3
Spray Droplet Size ...4
Herbicide Efficacy ...6
Pulse-Width Modulation Sprayers ...10
Objectives ...13
Literature Cited ...15
CHAPTER 2. DROPLET SIZE AND NOZZLE TIP PRESSURE FROM A PULSE-WIDTH MODULATION SPRAYER ...25
Abstract ...25
Introduction ...26
Materials and Methods ...28
Results and Discussion ...32
Conclusions ...41
Acknowledgements ...43
Literature Cited ...44
APPENDIX (A) ...63
CHAPTER 3. DROPLET VELOCITY FROM BROADCAST AGRICULTURAL NOZZLES AS INFLUENCED BY PULSE-WIDTH MODULATION ...71
Abstract ...71
Introduction ...72
Results and Discussion ...78
Conclusions ...83
Acknowledgements ...84
Literature Cited ...85
APPENDIX (B) ...98
CHAPTER 4. EVALUATION OF SPRAY PATTERN UNIFORMITY USING THREE UNIQUE ANALYSES AS IMPACTED BY NOZZLE, PRESSURE, AND PULSE-WIDTH MODULATION DUTY CYCLE ...107
Abstract ...107
Introduction ...108
Materials and Methods ...111
Results and Discussion ...115
Conclusions ...123
Acknowledgements ...124
Literature Cited ...125
CHAPTER 5. SPRAY DROPLET SIZE AND CARRIER VOLUME EFFECT ON DICAMBA AND GLUFOSINATE EFFICACY ...140
Abstract ...140
Introduction ...141
Materials and Methods ...145
Results and Discussion ...148
Conclusions ...154
Acknowledgements ...156
Literature Cited ...157
CHAPTER 6. OPTIMUM DROPLET SIZE USING A PULSE-WIDTH MODULATION SPRAYER FOR APPLICATIONS OF 2,4-D CHOLINE PLUS GLYPHOSATE ...172
Abstract ...172
Introduction ...173
Materials and Methods ...176
Conclusions ...185
Acknowledgements ...186
Literature Cited ...187
CHAPTER 7. DROPLET SIZE IMPACT ON DICAMBA PLUS GLYPHOSATE TANK-MIXTURE EFFICACY...202
Abstract ...202
Introduction ...203
Materials and Methods ...206
Results and Discussion ...210
Conclusions ...216
Acknowledgements ...217
Literature Cited ...218
LIST OF TABLES
Table 2.1. Nozzles (12), pulse-width modulation duty cycles (7), gauge application pressures (3), and spray solutions (2) evaluated in a factorial arrangement of
treatments in this research. ...49
Table 2.2. Polynomial regression parameters (a, b, c, d, e) and coefficient of
determination (r2) for droplet size (Dv0.5) regressed over duty cycle of water for
each nozzle*pressure combination ...50 Table 2.3. Droplet size data such that 10% of the spray volume is contained in
droplets of lesser diameter (Dv0.1) for water impacted by duty cycle for nozzle
and pressure combinations ...51 Table 2.4. Droplet size data such that 50% of the spray volume is contained in
droplets of lesser diameter (Dv0.5) for water impacted by duty cycle for nozzle
and pressure combinations ...52 Table 2.5. Droplet size data such that 90% of the spray volume is contained in
droplets of lesser diameter (Dv0.9) for water impacted by duty cycle for nozzle
and pressure combinations ...53 Table 2.6. Percent of spray volume less than 150 µm (driftable fines) for water as
impacted by duty cycle for each nozzle and pressure combination ...54 Table 2.7. Average nozzle tip pressure over five seconds for water as impacted by
nozzle for each gauge pressure and duty cycle combination ...55 Table 3.1. Nozzles (11), pulse-width modulation duty cycles (6), gauge application
pressures (3), and spray solutions (2) used as treatments in this experiment ...88 Table 3.2. Average spray droplet velocity of water influenced by nozzle type, gauge
pressure, and duty cycle ...89 Table 3.3. Estimated droplet size of water that has 50% of the maximum velocity
(DS50) and standard errors influenced by nozzle type, gauge pressure, and duty
cycle ...90 Table 3.4. Estimated droplet size of water that has 75% of the maximum velocity
(DS75) and standard errors influenced by nozzle type, gauge pressure, and duty
cycle ...91 Table 4.1. Nozzles (12), pulse-width modulation duty cycles (6), and gauge
application pressures (3) used in a factorial arrangement of treatments in this
Table 4.2. Spray pattern coefficient of variation (CV) (102 cm collection width) of water impacted by pulse-width modulation duty cycle for 12 nozzle and three
pressure combinations ...130 Table 4.3. Spray pattern root mean square error (RMSE) (102 cm collection width)
of water impacted by pulse-width modulation duty cycle for 12 nozzle and three pressure combinations ...131 Table 5.1. Site-year, GPS coordinates, weed species, average application weather
conditions, and data collected for this research ...162 Table 5.2. Nozzle type, orifice size, and application pressure combinations for each
dicamba and glufosinate droplet size (Dv0.5) and carrier volume treatment ...163
Table 5.3. Generalized additive model (GAM) smoothing parameters and deviance explained for each response variable, herbicide, and carrier volume combination across pooled site-years ...164 Table 5.4. Generalized additive model (GAM) predicted droplet sizes to achieve
maximum weed control and 90% of maximum weed control to enhance drift mitigation efforts for each response variable, herbicide, and carrier volume
combination across pooled site-years ...165 Table 5.5. Mortality proportion generalized additive model (GAM) smoothing
parameters and deviance explained for each herbicide and carrier volume combination within individual years to investigate the plausibility of
site-specific weed management ...166 Table 5.6. Mortality proportion generalized additive model (GAM) predicted
droplet sizes to achieve maximum weed control and 90% of maximum weed control to enhance drift mitigation efforts for each herbicide and carrier volume combination within individual years to investigate the plausibility of
site-specific weed management ...167 Table 6.1. Site-year, GPS coordinates, weed species, average application weather
conditions, and data collected to understand the impact of droplet size on
herbicide efficacy of 2,4-D choline plus glyphosate ...192 Table 6.2. Nozzle type, orifice size, and application pressure combinations for each
2,4-D choline plus glyphosate droplet size (Dv0.5) treatment ...193
Table 6.3. Generalized additive model (GAM) smoothing parameters and deviance
explained for each response variable across pooled site-years ...194 Table 6.4. Predicted droplet sizes based on a generalized additive model (GAM) to
achieve maximum weed control and 90% of maximum weed control to enhance drift mitigation efforts for each response variable across pooled site-years ...195
Table 6.5. Generalized additive model (GAM) smoothing parameters and deviance explained within individual site-years for each response variable to investigate
the plausibility of site-specific weed management ...196 Table 6.6. Predicted droplet sizes based on a generalized additive model (GAM) to
achieve maximum weed control and 90% of maximum weed control to enhance drift mitigation efforts within individual site-years for each response variable to investigate the plausibility of site-specific weed management ...197 Table 7.1. Site-year, GPS coordinates, weed species, average application weather
conditions, and data collected to understand the impact of droplet size on
herbicide efficacy of dicamba plus glyphosate ...223 Table 7.2. Nozzle type, orifice size, and application pressure combinations for each
dicamba plus glyphosate droplet size (Dv0.5) treatment ...224
Table 7.3. Generalized additive model (GAM) smoothing parameters and deviance
explained for each response variable across pooled site-years ...225 Table 7.4. Predicted droplet sizes based on a generalized additive model (GAM) to
achieve maximum weed control and 90% of maximum weed control to enhance drift mitigation efforts for each response variable across pooled site-years ...226 Table 7.5. Generalized additive model (GAM) smoothing parameters and deviance
explained within individual site-years for each response variable to investigate
the plausibility of site-specific weed management ...227 Table 7.6. Predicted droplet sizes based on a generalized additive model (GAM) to
achieve maximum weed control and 90% of maximum weed control to enhance drift mitigation efforts within individual site-years for each response variable to investigate the plausibility of site-specific weed management ...228
LIST OF FIGURES
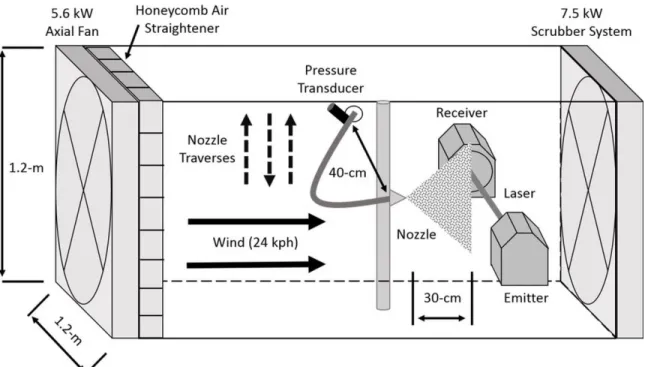
Figure 2.1. Illustration of the low_speed wind tunnel and laser diffraction system
used for droplet spectrum analysis at the University of Nebraska-Lincoln
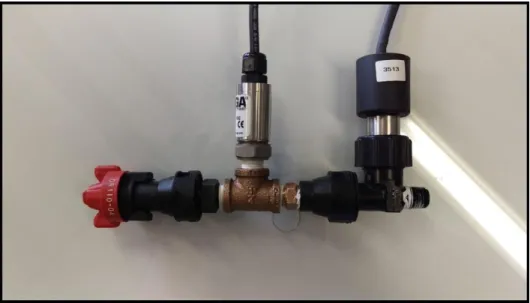
Pesticide Application Technology Laboratory located in North Platte, NE ...56 Figure 2.2. Nozzle body and pressure transducer assembly used to measure nozzle
tip pressures after the pulse-width modulation solenoid valve. Another pressure transducer was connected inline 40-cm upstream from this assembly to provide
gauge application pressure ...57
Figure 2.3. Polynomial regressions of droplet size data (Dv0.5) of water as
influenced by duty cycle for the AITTJ-6011004 (top left), AM11002 (top right), AM11004 (middle left), AMDF11004 (middle right), AMDF11008
(bottom left), and GAT11004 (bottom right) nozzles ...58
Figure 2.4. Polynomial regressions of droplet size data (Dv0.5) of water as
influenced by duty cycle for the TTI11004 (top left), DR11004 (top right), ER11004 (middle left), MR11004 (middle right), SR11004 (bottom left), and
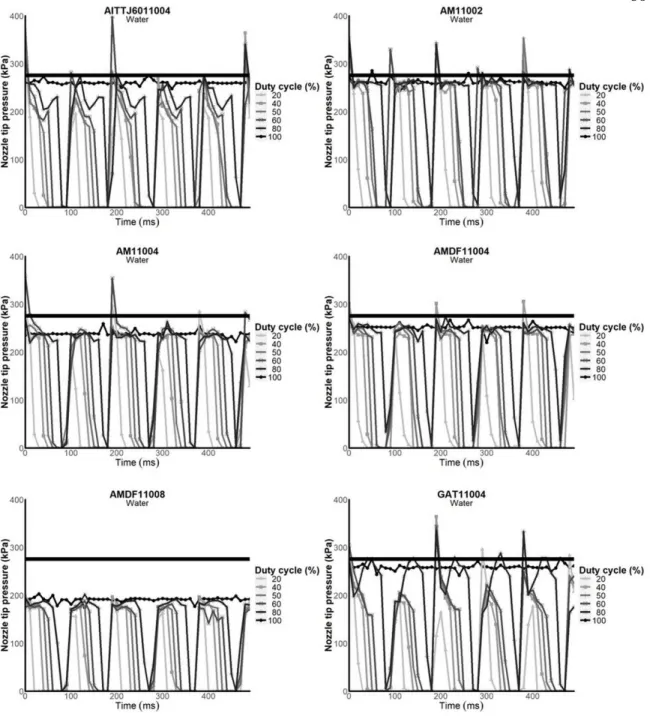
UR11004 (bottom right) nozzles ...59 Figure 2.5. Fluctuations in nozzle tip pressure (kPa) over 0.5 s for a gauge pressure
of 276 kPa with water spray solution as influenced by duty cycle for the AITTJ-6011004 (top left), AM11002 (top right), AM11004 (middle left), AMDF11004 (middle right), AMDF11008 (bottom left), and GAT11004 (bottom right) nozzles. The solid black bar indicates the 276 kPa gauge
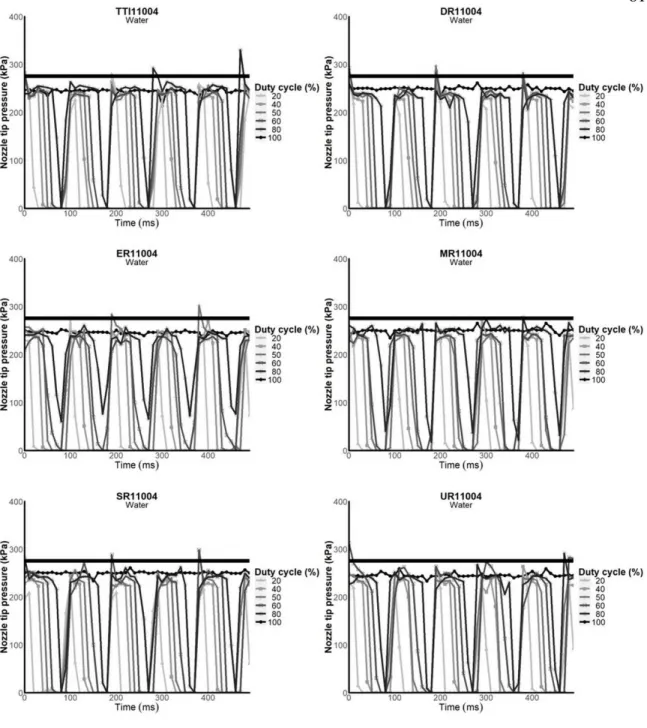
pressure ...60 Figure 2.6. Fluctuations in nozzle tip pressure (kPa) over 0.5 s for a gauge pressure
of 276 kPa with water spray solution as influenced by duty cycle for the TTI11004 (top left), DR11004 (top right), ER11004 (middle left), MR11004 (middle right), SR11004 (bottom left), and UR11004 (bottom right) nozzles.
The solid black bar indicates the 276 kPa gauge pressure ...61 Figure 2.7. Nozzle tip pressure of 12 nozzles when spraying water in a standard
nozzle body configuration (no solenoid valve) at 207 kPa (top left), 276 kPa (middle left), and 414 kPa (bottom left) and at a 100% duty cycle in a pulsing nozzle body configuration (with solenoid valve) at 207 kPa (top right), 276 kPa (middle right), and 414 kPa (bottom right). The solid black bar indicates the
respective gauge pressure ...62 Figure 3.1. Droplet velocity predictions of water at 207 kPa as influenced by duty
cycle for the (a) DR11004, (b) ER11004, (c) MR11004, (d) SR11004, and (e) UR11004 non-venturi nozzles. Standard duty cycle refers to a conventional
Figure 3.2. Droplet velocity predictions of water at 276 kPa as influenced by duty cycle for the (a) DR11004, (b) ER11004, (c) MR11004, (d) SR11004, and (e) UR11004 non-venturi nozzles. Standard duty cycle refers to a conventional
sprayer with no solenoid valve equipped ...93 Figure 3.3. Droplet velocity predictions of water at 414 kPa as influenced by duty
cycle for the (a) DR11004, (b) ER11004, (c) MR11004, (d) SR11004, and (e) UR11004 non-venturi nozzles. Standard duty cycle refers to a conventional
sprayer with no solenoid valve equipped ...94 Figure 3.4. Droplet velocity predictions of water at 207 kPa as influenced by duty
cycle for the (a) AITTJ6011004, (b) AM11002, (c) AM11004, (d)
AMDF11004, (e) AMDF11008, and (f) TTI11004 venturi nozzles. Standard
duty cycle refers to a conventional sprayer with no solenoid valve equipped ...95 Figure 3.5. Droplet velocity predictions of water at 276 kPa as influenced by duty
cycle for the (a) AITTJ6011004, (b) AM11002, (c) AM11004, (d)
AMDF11004, (e) AMDF11008, and (f) TTI11004 venturi nozzles. Standard
duty cycle refers to a conventional sprayer with no solenoid valve equipped ...96 Figure 3.6. Droplet velocity predictions of water at 414 kPa as influenced by duty
cycle for the (a) AITTJ6011004, (b) AM11002, (c) AM11004, (d)
AMDF11004, (e) AMDF11008, and (f) TTI11004 venturi nozzles. Standard
duty cycle refers to a conventional sprayer with no solenoid valve equipped ...97 Figure 4.1. Spray patternator table with automated collection system used in this
research located at the University of Nebraska-Lincoln in Lincoln, NE ...132 Figure 4.2. Average percent error (APE) of spray pattern measurements (102 cm
collection width) as affected by a nozzle*duty cycle interaction ...133 Figure 4.3. Average percent error (APE) of spray pattern measurements (102 cm
collection width) as affected by a gauge pressure*duty cycle interaction ...134 Figure 4.4. Average percent error (APE) of spray pattern measurements (102 cm
collection width) as affected by a gauge pressure*nozzle interaction ...135
Figure 4.5. Flow rate (mL min-1) for individual collection tubes across the width of
the measured spray pattern (102 cm) of the AITTJ-6011004 venturi nozzle at the 100% duty cycle for three pressures. The solid, horizontal lines are the
predicted flow rates (PFR) for each respective pressure ...136
Figure 4.6. Flow rate (mL min-1) for individual collection tubes across the width of
the measured spray pattern (102 cm) of the UR11004 non-venturi nozzle at the 100% duty cycle for three pressures. The solid, horizontal lines are the predicted flow rates (PFR) for each respective pressure ...137
Figure 4.7. Flow rate (mL min-1) for individual collection tubes across the width of the measured spray pattern (102 cm) of the AITTJ-6011004 venturi nozzle at the 276 kPa gauge pressure for six duty cycles. The solid, horizontal lines are
the predicted flow rates (PFR) for each respective duty cycle ...138
Figure 4.8. Flow rate (mL min-1) for individual collection tubes across the width of
the measured spray pattern (102 cm) of the UR11004 non-venturi nozzle at the 276 kPa gauge pressure for six duty cycles. The solid, horizontal lines are the
predicted flow rates (PFR) for each respective duty cycle ...139 Figure 5.1. Capstan PinPoint® pulse-width modulation research sprayer at the 2016
Beaver City, Nebraska, field site ...168 Figure 5.2. Visual injury estimation proportion (top), mortality proportion (middle),
and weed dry biomass per plant (bottom) 28 days after treatment as affected by droplet size and carrier volume were pooled across six, four, and five site-years, respectively, and predicted using generalized additive models for dicamba. The grey shaded area indicates the 95% confidence limits ...169 Figure 5.3. Visual injury estimation proportion (top), mortality proportion (middle),
and weed dry biomass per plant (bottom) 28 days after treatment as affected by droplet size and carrier volume were pooled across six, four, and five site-years, respectively, and predicted using generalized additive models for glufosinate.
The grey shaded area indicates the 95% confidence limits ...170 Figure 5.4. Mortality proportion 28 days after treatment as affected by droplet size
and carrier volume for the 2016 Beaver City, Nebraska site-year and predicted using generalized additive models for dicamba (left) and glufosinate (right) to assess the plausibility of site-specific weed management strategies. The grey
shaded area indicates the 95% confidence limits ...171
Figure 6.1. (A) Pulse-width modulation sprayer (Capstan PinPoint®) equipped and
operated with (B) non-venturi nozzles (Wilger Industries Ltd., Lexington, TN,
USA) used to apply droplet size treatments in this research ...198 Figure 6.2. Visual injury estimation proportion, mortality proportion, and weed dry
biomass per plant 28 days after treatment as affected by droplet size were pooled across six, four, and five site-years, respectively, and predicted using generalized additive models (GAM). The grey shaded area indicates the 95%
confidence limits ...199 Figure 6.3. Visual injury estimation proportion, mortality proportion, and weed dry
biomass per plant generalized additive models (GAM) for the 2017 Brule, NE, USA site-year to assess the plausibility of site-specific weed management
Figure 6.4. Mortality proportion generalized additive models (GAM) for the
horseweed (Erigeron canadensis L.) and kochia [Bassia scoparia (L.) A.J.
Scott] weed species at the 2018 North Platte, NE, USA site-year. The grey
shaded area indicates the 95% confidence limits ...201 Figure 7.1. Visual injury estimation proportion, mortality proportion, and weed dry
biomass per plant 28 days after treatment as affected by droplet size were pooled across six, four, and five site-years, respectively, and predicted using generalized additive models (GAM). The grey shaded area indicates the 95%
confidence limits ...229 Figure 7.2. Visual injury estimation proportion, mortality proportion, and weed dry
biomass per plant generalized additive models (GAM) for the 2017 Brule, NE, USA site-year to assess the plausibility of site-specific weed management
strategies. The grey shaded area indicates the 95% confidence limits ...230 Figure 7.3. Mortality proportion generalized additive models (GAM) for the
horseweed (Erigeron canadensis L.) and kochia [Bassia scoparia (L.) A.J.
Scott] weed species from the 2018 North Platte, NE, USA site-year. The grey
LIST OF EQUATIONS
Equation 2.1. Polynomial regressions (first through fourth degree) used to model
droplet size (Dv0.5) over duty cycle ...32
Equation 3.1
.
Three parameter log-logistic model used to regress droplet velocity(m s-1) over duty cycle ...77
Equation 4.1. Calculation of coefficient of variation (CV) as a standardized measure of data point dispersion for a relative estimate of the extent of variability in
relation to the average flow rate across the spray pattern ...113
Equation 4.2. Calculation of predicted flow rate (PFR) data based on an assumption
of an ideal uniform spray pattern across the collection width using the capacity
of one nozzle ...114 Equation 4.3. Calculation of root mean square error (RMSE) to estimate how
concentrated the individual collection tube flow rate data is around the predicted flow rate (PFR) ...114 Equation 4.4. Calculation of average percent error (APE) to measure the
discrepancy between measured and predicted flow rate (PFR) and provide an
estimation of the data precision ...115 Equation 5.1. Generalized additive model (GAM) used to model spray droplet size
(Dv0.5) with each respective response variable. Models consisted of one
smoothed variable (droplet size) and smoothing parameters were estimated
separately for each carrier volume ...147 Equation 6.1. Generalized additive modeling (GAM) analysis was conducted in R
3.5.0 statistical software using the mgcv package to model spray droplet size with each respective response variable. Models consisted of one smoothed
variable (droplet size) ...179 Equation 7.1. Generalized additive modeling (GAM) analysis was conducted in R
3.5.0 statistical software using the mgcv package to model spray droplet size with each respective response variable. Models consisted of one smoothed
LIST OF APPENDIX TABLES
Table A.1. Polynomial regression parameters (a, b, c, d, e) and coefficient of determination (r2) for droplet size (Dv0.5) regressed over duty cycle of the glyphosate (Roundup PowerMAX®) plus AMS solution for each
nozzle*pressure combination ...63 Table A.2. Droplet size data such that 10% of the spray volume is contained in
droplets of lesser diameter (Dv0.1) for glyphosate (Roundup PowerMAX®)
plus AMS impacted by duty cycle for nozzle and pressure combinations ...64 Table A.3. Droplet size data such that 50% of the spray volume is contained in
droplets of lesser diameter (Dv0.5) for glyphosate (Roundup PowerMAX®) plus
AMS as impacted by duty cycle for each nozzle and pressure combination ...65 Table A.4. Droplet size data such that 90% of the spray volume is contained in
droplets of lesser diameter (Dv0.9) for glyphosate (Roundup PowerMAX®) plus
AMS as impacted by duty cycle for each nozzle and pressure combination ...66 Table A.5. Percent of spray volume less than 150 µm (driftable fines) for
glyphosate (Roundup PowerMAX®) plus AMS as impacted by duty cycle for
each nozzle and gauge pressure combination ...67 Table A.6. Average nozzle tip pressure over five seconds for glyphosate (Roundup
PowerMAX®) plus AMS as impacted by nozzle for each gauge pressure and
duty cycle combination ...68 Table B.1. Average spray droplet velocity of glyphosate plus AMS solution
influenced by nozzle type, gauge pressure, and duty cycle ...98 Table B.2. Estimated droplet size of glyphosate plus AMS solution that has 50% of
the maximum velocity (DS50) and standard errors influenced by nozzle type,
gauge pressure, and duty cycle ...99 Table B.3. Estimated droplet size of glyphosate plus AMS solution that has 75% of
the maximum velocity (DS75) and standard errors influenced by nozzle type,
LIST OF APPENDIX FIGURES
Figure A.1. Polynomial regressions of droplet size data (Dv0.5) of glyphosate
(Roundup PowerMAX®) plus AMS as influenced by duty cycle for the AITTJ6011004 (top left), AM11002 (top right), AM11004 (middle left), AMDF11004 (middle right), AMDF11008 (bottom left), and GAT11004
(bottom right) nozzles ...69
Figure A.2. Polynomial regressions of droplet size data (Dv0.5) of glyphosate
(Roundup PowerMAX®) plus AMS as influenced by duty cycle for the TTI11004 (top left), DR11004 (top right), ER11004 (middle left), MR11004
(middle right), SR11004 (bottom left), and UR11004 (bottom right) nozzles ...70 Figure B.1. Droplet velocity predictions of glyphosate plus AMS solution at 207
kPa as influenced by duty cycle for the DR11004 (a), ER11004 (b), MR11004 (c), SR11004 (d), and UR11004 (e) non-venturi nozzles. Standard duty cycle
refers to a conventional sprayer with no solenoid valve equipped ...101 Figure B.2. Droplet velocity predictions of glyphosate plus AMS solution at 276
kPa as influenced by duty cycle for the DR11004 (a), ER11004 (b), MR11004 (c), SR11004 (d), and UR11004 (e) non-venturi nozzles. Standard duty cycle
refers to a conventional sprayer with no solenoid valve equipped ...102 Figure B.3. Droplet velocity predictions of glyphosate plus AMS solution at 414
kPa as influenced by duty cycle for the DR11004 (a), ER11004 (b), MR11004 (c), SR11004 (d), and UR11004 (e) non-venturi nozzles. Standard duty cycle
refers to a conventional sprayer with no solenoid valve equipped ...103 Figure B.4. Droplet velocity predictions of glyphosate plus AMS solution at 207
kPa as influenced by duty cycle for the AITTJ6011004 (a), AM11002 (b), AM11004 (c), AMDF11004 (d), AMDF11008 (e), and TTI11004 (f) venturi nozzles. Standard duty cycle refers to a conventional sprayer with no solenoid
valve equipped ...104 Figure B.5. Droplet velocity predictions of glyphosate plus AMS solution at 276
kPa as influenced by duty cycle for the AITTJ6011004 (a), AM11002 (b), AM11004 (c), AMDF11004 (d), AMDF11008 (e), and TTI11004 (f) venturi nozzles. Standard duty cycle refers to a conventional sprayer with no solenoid
valve equipped ...105 Figure B.6. Droplet velocity predictions of glyphosate plus AMS solution at 414
kPa as influenced by duty cycle for the AITTJ6011004 (a), AM11002 (b), AM11004 (c), AMDF11004 (d), AMDF11008 (e), and TTI11004 (f) venturi nozzles. Standard duty cycle refers to a conventional sprayer with no solenoid
CHAPTER 1
LITERATURE REVIEW
Application Technology Introduction
A majority of US agriculture row crop production hectares have pesticides applied to them during the growing season. In 2015, 72.5 million hectares (95% of the
total planted hectares) of corn (Zea mays L.), soybean [Glycine max (L.) Merr], and
cotton (Gossypium hirsutum L.) received a minimum of one herbicide application
(USDA-NASS, 2015). These herbicide applications are critical to maintaining high levels of production as weed interference in corn and soybean reduced annual yields by 50% and 52%, respectively, across North America (Soltani et al., 2017, 2016). The
aforementioned yield losses resulted in annual farm revenue losses for corn and soybean crops of $26.7 billion and $17.2 billion, respectively. As pesticide applications are a heavily scrutinized facet of today’s agricultural industry, a concerted effort to optimize each application needs to be implemented. However, previous survey results highlighted only 20-30% of applicators were applying pesticides within 5% of their intended
application rate (Grisso et al., 1989; Ozkan, 1987). Furthermore, a 2016 survey from Missouri identified greater than 62% of applicators changed nozzles less than 50% of the time when switching herbicide products, and on average, only 45% of applicators
inspected sprayer parts prior to each application (Bish and Bradley, 2017). As a result, improper applications may occur due to undetected issues such as nozzle wear (Ozkan et al., 1992a, 1992b), incorrect sprayer setup (Forney et al., 2017), and incorrect nozzle
selection (Klein and Kruger, 2011). In today’s production agricultural systems, this is unacceptable. More precise and efficient pesticide applications are necessary to meet regulatory demands and increase economic efficiency through reduced pesticide inputs.
In broadcast agricultural applications (both aerial and ground), spray solution is almost exclusively applied using hydraulic nozzles (Matthews et al., 2014). These nozzles meter the flow and atomize the spray solution by applying pressure and forcing the solution through a small orifice. As a result, a heterogeneous mixture of droplet sizes are emitted (Young, 1990). The nozzle exit orifice design coupled with the spray
pressure, sheet thickness, surface tension, density, and viscosity creates the resulting spray pattern (Dombrowski et al., 1960).
Pesticide applications are complex processes that require great detail to optimize effectively (Ebert et al., 1999). As this complexity was realized, a focus on application technology research was established to fully comprehend the entirety of pesticide applications. In 1990, the US Environmental Protection Agency (US EPA) established a collaborative research project with 40 agricultural chemical companies. This
collaboration, termed the Spray Drift Task Force (SDTF), developed large databases containing droplet size distribution and field drift deposition data for a wide range of spray application parameters to evaluate the application technology impact on pesticide applications and spray drift. Since the development of the SDTF, vast advancements in pesticide formulations, adjuvants, nozzles, and spray delivery methods have only increased the need for application technology research. In particular, efforts have been placed on optimizing applications to reduce spray drift and simultaneously maximize spray impaction and retention to increase pesticide efficacy.
Spray Pattern and Drift
A holistic comprehension of droplet dynamics within a spray cloud (size, velocity, trajectory, etc.) is critical to understand pesticide transport and the final spray destination (Giles et al., 2002). The spray pattern is critical for maintaining optimum coverage to maximize efficacy throughout an application. Drift reduction adjuvants (Ozkan et al., 1993) and spray formulations (Mun et al., 1999) have been shown to impact spray pattern uniformity by forcing a greater volume of spray toward the center of the nozzle. This spray pattern collapse with the resulting increase of spray volume
centered under the nozzle may lead to improper overlap between nozzles and thereby underapply chemical between each nozzle. Underapplication may lead to decreased efficacy and hasten the evolution of pesticide resistance (Gressel, 2011; Manalil et al., 2011; Neve and Powles, 2005). Reductions in sprayer speed and tire pressure were also identified as methods to enhance spray pattern uniformity (Langenakens et al., 1995).
Spray drift is a critical concern for pesticide applications as previous research determined severe crop injury could occur up to 200 m downwind when synthetic auxin herbicides were applied in a light wind (Byass and Lake, 1977). Multiple application factors, including droplet velocity (Zhu et al., 1994), droplet trajectory (Miller and Hadfield, 1989), boom height (Hobson et al., 1993), distance to susceptible vegetation (Smith et al., 2000), air temperature and relative humidity (Zhu et al., 1994), and wind speed (Hobson et al., 1993; Smith et al., 2000; Zhu et al., 1994), influence spray drift and have been previously used in drift prediction models.
Several application parameters were observed to have convoluted interactions between spray pattern and drift. Nozzle factors such as tip material (Wang et al., 1995),
orifice wear (Ozkan et al., 1992a), lateral angle, spacing, pitch angle, and incorrect selection (Forney et al., 2017) were identified as sources of pattern deformities.
Additionally, it was previously noted that venturi nozzles have greater variability in spray pattern distribution, especially at low application pressures, compared to non-venturi nozzles (Ayers et al., 1990; Etheridge et al., 1999), but venturi nozzles remain commercially popular due to reduced spray drift and injury to downwind susceptible vegetation (Bueno et al., 2017; Johnson et al., 2006). An increase in boom height and pressure reduced CV values, thus producing more uniform spray patterns (Azimi et al., 1985); however, increases in boom height and pressure resulted in greater downwind spray drift (Nordby and Skuterud, 1974). Narrow nozzle spacing (< 51 cm) reduced CV values and buffered the negative effects of reduced boom heights and pressures on pattern uniformity, thereby indirectly assisting with drift mitigation efforts. Crosswinds increased pattern CV values (Krishnan et al., 1988) and spray particle drift (Farooq et al., 2001) compared to headwinds of the same velocity, especially at increased pressures, indicating the important role wind speed and direction plays in pesticide applications. The array of aforementioned factors influencing spray patterns and drift illustrates the complexity of optimizing application safety and uniformity.
Spray Droplet Size
Numerous application factors influencing spray drift were previously discussed; however, the largest focus for spray drift reduction practices has been placed on
increasing spray droplet size. This is likely due to spray droplet size being one of the most manageable factors influencing pesticide applications, specifically particle drift and
pesticide efficacy (Hewitt, 1997; Vieira et al., 2018). A wide array of application parameters have been studied for their effect on droplet size generation.
Physical spray characteristics, such as surface tension, viscosity, and specific gravity, influence spray droplet size and delivery (Miller and Tuck, 2005); however, wide ranges of droplet sizes have been atomized from liquid materials with similar physical properties (Bouse et al., 1990) and the physical properties were deemed as poor predictors within droplet size models (Chapple et al., 1993). Nonetheless, adjuvants (Butler Ellis et al., 1997), pesticide formulations (Miller and Butler Ellis, 2000), and convoluted interactions between spray solution chemistry and nozzle (Butler Ellis and Tuck, 2000) have been shown to affect spray droplet size. Additional application
parameters such as nozzle spray angle during aerial applications (Hoffmann et al., 2014), nozzle orifice size (Creech et al., 2015), nozzle orifice wear (Ozkan et al., 1992b), pressure (Nuyttens et al., 2007), and air and solution temperatures (Hoffmann et al., 2011; Miller and Tuck, 2005) have impacted droplet size distributions. Nozzle design or type has been shown to influence the emitted droplet size in both aerial (Bouse, 1994) and ground applications (Nuyttens et al., 2007), and was identified as the variable with the greatest influence over droplet size (Creech et al., 2015).
Significant innovations in nozzle designs to increase spray droplet size have taken place such as: (1) the entrainment of air into spray solution, termed air inclusions, within a nozzle tip (venturi nozzles) (Briffa and Dombrowski, 1966), (2) the development of pre-orifices to utilize the Bernoulli principle (Barnett and Matthews, 1992), and (3) the manipulation of flow path and exit trajectory (Matthews et al., 2014). Previous research identified droplet size was mainly influenced by the ratio between a pre- and exit-orifice,
and only minimally impacted by air inclusions from a venturi nozzle which led to the conclusion that increasing droplet size, not droplet density, was more critical for drift reduction practices (Butler Ellis et al., 2002). Further efforts must be made to fully characterize droplet dynamics within spray clouds from the abundant nozzle designs now commercially available as complex interactions between droplet size and velocity can affect particle drift potential (Farooq et al., 2001; Nuyttens et al., 2009). Additionally, current nozzle technologies have demonstrated variable uniformity and consistency from their emitted droplet size distributions leading to the conclusion that not all nozzles are created equal and no single nozzle would be appropriate for all applications (Ferguson et al., 2015). Based on this premise, the American Society of Agricultural and Biological Engineers (ASABE) created a standard to classify spray droplet sizes across a wide arena of testing facilities and assist nozzle users with general information regarding spray drift potential (ASABE, 2009).
An increase in spray droplet size reduces the likelihood of off-target movement of spray particles (Hewitt, 1997). This basic assumption has been validated through drift modelling efforts (Hobson et al., 1993; Zhu et al., 1994) and in-field deposition
measurements (Bueno et al., 2017; Vieira et al., 2018). However, increasing spray droplet size to reduce drift potential has limitations, specifically in regards to target coverage and final biological efficacy.
Herbicide Efficacy
Agricultural pesticide research has evaluated an abundance of factors that influence pesticide efficacy, especially in regards to herbicides. Herbicide performance
has been previously linked with biotic (e.g. weed species and weed size) and abiotic (e.g. soil texture, light, temperature, humidity, time of application, precipitation, and wind) factors (Kudsk, 2017). However, an often overlooked aspect affecting the success of herbicide applications includes the application equipment and process such as sprayer travel speed (C.J. Meyer et al., 2016), nozzle selection (Jensen et al., 2001; Klein and Johnson, 2002), pressure (Ferguson et al., 2016), and spray pattern distribution (Etheridge et al., 2001). Novel herbicide delivery methods and application technologies, specifically the growing popularity of venturi nozzles, have significantly changed the application process and require additional research to fully comprehend herbicide impaction,
retention, and the resulting biological efficacy. Therefore, research and education efforts for applicators must include information regarding the application process to integrate these technologies into the marketplace and successfully reduce drift while
simultaneously maximize herbicide efficacy (Wolf, 2002).
Although coarser droplets decrease spray drift, there is a convoluted interaction between increasing droplet size and droplet impaction and retention, and the resulting biological efficacy. May and Clifford, (1967) identified droplet impaction efficiency increased when droplet impaction distances were minimized; therefore, finer droplets and reduced droplet velocities would have greater impaction efficiencies. Further research with external horizontal winds resulted in greater impaction/retention efficiency on vertical leaf surfaces with finer droplets (Lake, 1977); however, coarser droplets had greater impaction/retention efficiency on horizontal leaf surfaces (Spillman, 1984). Therefore, plant architecture and leaf surface composition influence droplet
2013). Although droplet impaction/retention increased on horizontal leaf surfaces with coarser droplets, adhesion was reduced with increasing droplet size as droplets bounced or shattered upon impact (Forster et al., 2005). Additionally, models indicated decreasing droplet size increased spray penetration into a plant canopy (Bache, 1985), and this result was field validated as smaller droplet sizes emitted from single exit orifice nozzles resulted in greater soybean canopy penetration (Wolf and Daggupati, 2009). However, increasing spray carrier volume may buffer the impact of increasing droplet size on spray coverage and penetration (Bretthauer et al., 2008). These results help to explain
reductions in herbicide efficacy when coarser droplets at a fixed carrier volume were used across multiple herbicides and weed species (Ennis and Williamson, 1963; Knoche, 1994; Lake, 1977; Lake and Taylor, 1974; McKinlay et al., 1972; Meyer et al., 2016).
As droplet diameter increases, the volume of solution contained within individual droplets increases; if an application carrier volume is held constant and the droplet diameter doubled, the number of droplets available for plant surface impaction and retention is reduced by a ratio of 8:1. Typically, this is used as justification for the following guideline: reduced droplet sizes are necessary for contact herbicides to maximize efficacy, while systemic herbicide efficacy is less sensitive to droplet size changes. Glyphosate, a systemic herbicide, had greater absorption and translocation with Coarse droplets (Feng et al., 2009); however, this guideline was not consistent across systemic herbicides as translocation of 2,4-D (systemic herbicide) increased as droplet size decreased, indicating droplet size plays a role in 2,4-D efficacy (Wolf et al., 1992) as well as several other systemic herbicides (Prasad and Cadogan, 1992). Additionally, no losses in herbicide efficacy as droplet size increased were observed for several contact
herbicides (Ramsdale and Messersmith, 2001a; Shaw et al., 2000). Droplet size impacts on herbicide efficacy are convoluted, and each herbicide and weed species interaction requires a tailored approached to maximize efficacy (Creech et al., 2016).
In addition to droplet size, carrier volume plays a crucial role in herbicide
coverage and efficacy. Generally, across herbicides, efficacy decreased as carrier volume decreased (Knoche, 1994). This result is expected as a reduced volume should result in decreased coverage of the target weed species. Field research validated this assumption
as an increase in carrier volume (≥ 94 L ha-1) resulted in greater spray coverage and
penetration, while changing nozzle type (droplet size) had no effect on the overall spray coverage or penetration (Barbosa et al., 2009; Legleiter and Johnson, 2016). However, similar to the complex interactions observed with droplet size, carrier volume has shown mixed effects on herbicide efficacy. Etheridge et al., (2001) and Ramsdale and
Messersmith, (2001b) showed minimal to no efficacy reduction from a decrease in carrier volume across multiple contact herbicides. In contrast, a reduction in dicamba efficacy (systemic herbicide) when large droplet sizes were applied was observed as carrier volume was reduced (C J Meyer et al., 2016). Further complications developed from previous research in which reduced droplet sizes and carrier volumes (more concentrated droplets) increased efficacy with both contact and systemic herbicides (McKinlay et al., 1974; Merritt and Taylor, 1977). Homogenization of the droplet sizes represented within a spray pattern through unique pesticide delivery methods and carrier volumes tailored for specific herbicides and weed species could result in greater droplet adhesion to leaf surfaces and increase biological efficacy, while limiting drift potential (De Cock et al., 2017).
Pulse-Width Modulation Sprayers
The objective of pesticide applications is to precisely and accurately deliver the minimum amount of active ingredient to the target to achieve the desired biological effect with safety and economy (Matthews et al., 2014). Current pesticide application methods using precision technologies, such as electronic controllers, can assist with these goals (Rietz et al., 1997). Pulse-width modulation (PWM) sprayers optimize applications through precision electronic techniques such as automatic boom and individual nozzle control (Luck et al., 2010a, 2010b), overlap efficiency, and flow rate turn compensation across the boom to improve the reliability of desired flow rates and droplet sizes (Giles et al., 2003; Needham et al., 2012). Flow is controlled by pulsing an electronically-actuated solenoid valve on a fixed frequency (typically 10 Hz) that is placed directly upstream of the nozzle (Giles and Comino, 1989) and an alternating electrical signal timing for
adjacent nozzles is used across the boom (Blended Pulse®) to mitigate application overlap
errors (Capstan Ag Systems Inc., 2006). The flow is changed by controlling the relative proportion of time each solenoid valve is open (duty cycle). This system allows real-time flow rate changes to be made without manipulating application pressure as in other variable rate spray application systems (Anglund and Ayers, 2003) and PWM solenoid valves buffer some negative impacts observed with other rate controller systems (Luck et al., 2011; Sharda et al., 2013, 2011). Application pressure based variable rate flow control devices have been shown to have slow response time and affect nozzle
performance, specifically droplet size (Giles and Comino, 1989). Previous PWM research illustrated little to no effect from duty cycle on spray droplet size (Giles et al., 1996; Giles and Comino, 1990); however, only non-venturi and pre-orifice lacking nozzles
were evaluated. Furthermore, PWM sprayers have the capability of producing up to a 10:1 turndown ratio in flow rate with no pressure or nozzle based changes, thus creating more flexible options for pesticide applicators (Giles et al., 1996; GopalaPillai et al., 1999). Additional PWM benefits include: increased spray coverage uniformity when used in conjunction with capacitive accelerometers to compensate for horizontal boom
movements (Lebeau et al., 2004), precision in-season nitrogen applications through the use of high-resolution prescription maps (Han et al., 2001), and maintained spray integrity when using larger orifice size nozzles (larger droplet sizes) paired with low carrier volumes such as with aerial applications (Giles et al., 1995).
Previous PWM research illustrated droplet velocity decreased as duty cycle decreased (Giles et al., 2002), which could be problematic due to increased drift potential (Farooq et al., 2001) and reduced canopy penetration, specifically in vertically oriented
plant canopies such as corn (Zea mays L.) (Creech et al., 2018). However, the decrease in
droplet velocity from a change in duty cycle is smaller than the decrease in droplet velocity from a change in application pressure across equivalent flow rates (Giles et al., 2003). Furthermore, compared to pressure-based flow rate adjustments, increasing nozzle orifice size and operating at a lower duty cycle will increase droplet velocities and spray kinetic energies (Giles, 2001). Spray kinetic energies from PWM sprayers were
minimally affected by duty cycle and were more stable than spray kinetic energies obtained from pressure-based alterations to obtain equivalent flow rates (Giles et al., 2002; Giles and Ben-Salem, 1992). In brief, PWM sprayers could reduce drift potential, increase canopy penetration, and increase impaction compared to sprayers using
validated as pulsing dual nozzle configurations increased coverage of Palmer amaranth (Amaranthus palmeri S. Wats.) while simultaneously minimized the drift potential of small droplets (Womac et al., 2017, 2016).
Although numerous benefits have been presented for PWM application systems, there have been drawbacks identified. Currently, nozzle selection is limited because venturi nozzles are not recommended (Capstan Ag Systems Inc., 2013). Previous research also demonstrated as PWM duty cycle decreased, spray pattern uniformity decreased for hollow-cone, solid-cone, and, to a lesser extent, non-venturi flat fan nozzles, because more spray was concentrated directly underneath the nozzle (Giles and Comino, 1990). Mangus et al., (2017) expanded on this concept and identified that although the correct flow rate was emitted per pulse regardless of duty cycle, spray coverage uniformity decreased as duty cycle decreased suggesting that areas of under- and over-application may occur. On-ground application coverage estimates were ±10% of the desired target 67 and 38% of the time for 40 and 20% duty cycles, respectively, indicating a severe penalty for operating the PWM sprayer below a 40% duty cycle (Mangus et al., 2017). Additional research regarding spray deposition parallel with the sprayer path identified 80° fan angle nozzles should not be operated with a 25% duty
cycle at sprayer speeds greater than 11 km h-1 as the CV increased above 15% (Tian and
Zheng, 2000). However, no such limitation was detected for 110° fan angle nozzles with
sprayer speeds up to 16 km hr-1. In further research, the 25% duty cycle paired with an
80° fan angle nozzle resulted in an extremely non-uniform spray pattern parallel to the sprayer direction of travel (65% CV) and losses in weed control of up to 35% were noted (Pierce and Ayers, 2001). Therefore, proper nozzle selection (specifically, fan angle and
orifice size) paired with appropriate sprayer speeds (to maintain an appropriate duty cycle) is critical to achieving an optimized PWM sprayer application. Overall, PWM sprayers provide an opportunity for increased application precision; however best use practices need to be identified for applicators to effectively utilize the technology.
Objectives
The optimization of pesticide applications is necessary in today’s agricultural setting to reduce environmental contamination potential and increase efficacy on the intended target. PWM sprayers allow for several confounding application factors, such as pressure and flow rate, to become independent from sprayer speed, thereby providing a more homogenous spray cloud and increasing application precision compared to a conventional sprayer. The increasing popularity of PWM sprayers and the continual development of new application technologies has led to the need for the identification of best use PWM practices. Therefore, the laboratory objectives of this research were: (1) to identify the influence of current nozzle technology (venturi vs. non-venturi nozzles), application pressure, and PWM duty cycle on droplet size, droplet exit velocity, nozzle tip pressure, and spray pattern uniformity, and (2) to create best use PWM
recommendations to optimize pesticide applications from these sprayers.
Additionally, an increasing need for site-specific weed management has been established (Tian et al., 1999; Wilkerson et al., 2004), and PWM sprayers could provide a unique opportunity for use in site-specific management scenarios by mitigating droplet size variation within an application (GopalaPillai et al., 1999). The need for field studies to evaluate droplet size efficacy was also previously noted as discrepancies between
laboratory and field results were observed (Ebert et al., 1999). Utilizing the best use PWM practices previously identified in the laboratory objectives, the field research objectives included: (1) investigating the effect of spray droplet size and carrier volume on the efficacy of dicamba and glufosinate herbicides, (2) investigate the spray droplet size effect on 2,4-D choline plus glyphosate pre-mixture and dicamba plus glyphosate tank-mixture herbicide solutions, (3) determine the plausibility of using PWM sprayers in site-specific weed management strategies, and (4) create new weed management
recommendations based on an optimum droplet size to achieve a high level of weed control while simultaneously mitigating particle drift potential. As a result of this research, applicators will more effectively utilize drift reduction technologies and PWM sprayers, reduce herbicide inputs, and reduce the selection pressure for the evolution of herbicide-resistant weeds.
Literature Cited
Anglund, E.A., Ayers, P.D., 2003. Field evaluation of response times for a variable rate (pressure-based and injection) liquid chemical applicator. Appl Eng Agric 19, 273– 282. https://doi.org/10.13031/2013.13659
ASABE, 2009. Spray nozzle classification by droplet spectra. St. Joseph, MI. https://doi.org/ANSI/ASAE S572.1
Ayers, P.D., Rogowski, S.M., Kimble, B.L., 1990. An investigation of factors affecting sprayer control system performance. Appl Eng Agric 6, 701–706.
https://doi.org/10.13031/2013.26451
Azimi, A.H., Carpenter, T.G., Reichard, D.L., 1985. Nozzle spray distribution for
pesticide application. T ASAE 28, 1410–1414. https://doi.org/10.13031/2013.32451 Bache, D.H., 1985. Prediction and analysis of spray penetration into plant canopies, in:
Application and Biology. British Crop Protection Conference Monograph No. 28, pp. 183–190.
Barbosa, R.N., Griffin, J.L., Hollier, C.A., 2009. Effect of spray rate and method of application in spray deposition. Appl Eng Agric 25, 181–184.
https://doi.org/10.13031/2013.26327
Barnett, G.S., Matthews, G.A., 1992. Effect of different fan nozzles and spray liquids on droplet spectra with special reference to drift control. Int Pest Cont 34, 81–85. Bish, M.D., Bradley, K.W., 2017. Survey of Missouri pesticide applicator practices,
knowledge, and perceptions. Weed Technol 31, 165–177. https://doi.org/10.1017/wet.2016.27
Bouse, L.F., 1994. Effect of nozzle type and operation on spray droplet size. T ASAE 37, 1389–1400. https://doi.org/10.13031/2013.28219
Bouse, L.F., Kirk, I.W., Bode, L.E., 1990. Effect of spray mixture on droplet size. T ASAE 33, 783–788. https://doi.org/10.13031/2013.31401
Bretthauer, S.M., Mueller, T.A., Derksen, R.C., Zhu, H., Bode, L.E., 2008. The effects of spray application rate and droplet size on applications to control soybean rust. ASABE Pap. No. 084219 St. Joseph. https://doi.org/10.13031/2013.25050
Briffa, F.E., Dombrowski, N., 1966. Entrainment of air into a liquid spray. A.I.CH.E. J. 12, 708–717. https://doi.org/10.1002/aic.690120416
Bueno, M.R., da Cunha, J.P.A.R., de Santana, D.G., 2017. Assessment of spray drift from pesticide applications in soybean crops. Biosyst Eng 154, 35–45.
Butler Ellis, M.C., Swan, T., Miller, P.C.H., Waddelow, S., Bradley, A., Tuck, C.R., 2002. Design factors affecting spray characteristics and drift performance of air induction nozzles. Biosyst Eng 82, 289–296. https://doi.org/10.1006/bioe.2002.0069 Butler Ellis, M.C., Tuck, C.R., 2000. The variation in characteristics of air-included
sprays with adjuvants. Asp Appl Biol Pesticide, 155–162.
Butler Ellis, M.C., Tuck, C.R., Miller, P.C.H., 1997. The effect of some adjuvants on sprays produced by agricultural flat fan nozzles. Crop Prot 16, 41–50.
https://doi.org/10.1016/S0261-2194(96)00065-8
Byass, J.B., Lake, J.R., 1977. Spray drift from a tractor-powered field sprayer. Pestic Sci 8, 117–126. https://doi.org/10.1002/ps.2780080202
Capstan Ag Systems Inc., 2006. SharpShooter® owner's manual. Accessed from:
http://ohiovalleyag.com/wp-content/uploads/2011/10/SS_Owners_Manual.pdf Capstan Ag Systems Inc., 2013. PinPoint Synchro product manual.
https://doi.org/PN-120156-001
Chapple, A.C., Downer, R.A., Hall, F.R., 1993. Effects of spray adjuvants on swath patterns and droplet spectra for a flat-fan hydraulic nozzle. Crop Prot 12, 579–590. https://doi.org/10.1016/0261-2194(93)90120-8
Creech, C.F., Henry, R.S., Fritz, B.K., Kruger, G.R., 2015. Influence of herbicide active ingredient, nozzle type, orifice size, spray pressure, and carrier volume rate on spray droplet size characteristics. Weed Technol 29, 298–310.
https://doi.org/10.1614/WT-D-14-00049.1
Creech, C.F., Henry, R.S., Hewitt, A.J., Kruger, G.R., 2018. Herbicide spray penetration into corn and soybean canopies using air-induction nozzles and a drift control adjuvant. Weed Technol 32, 72–79. https://doi.org/10.1017/wet.2017.84
Creech, C.F., Moraes, J.G., Henry, R.S., Luck, J.D., Kruger, G.R., 2016. The impact of spray droplet size on the efficacy of 2,4-D, atrazine, chlorimuron-methyl, dicamba, glufosinate, and saflufenacil. Weed Technol 30, 573–586.
https://doi.org/10.1614/WT-D-15-00034.1
De Cock, N., Massinon, M., Salah, S.O.T., Lebeau, F., 2017. Investigation on optimal spray properties for ground based agricultural applications using deposition and retention models. Biosyst Eng 162, 99–111.
https://doi.org/10.1016/j.biosystemseng.2017.08.001
Dombrowski, N., Hasson, D., Ward, D.E., 1960. Some aspects of liquid flow through fan spray nozzles. Chem Eng Sci 12, 35–50.
Ebert, T.A., Taylor, R.A.J., Downer, R.A., Hall, F.R., 1999. Deposit structure and efficacy of pesticide application. 1: Interactions between deposit size, toxicant concentration and deposit number. Pestic Sci 55, 783–792.
https://doi.org/10.1002/(SICI)1096-9063(199908)55:8<783::AID-PS973>3.0.CO;2-D
Ennis, W.B., Williamson, R.E., 1963. Influence of droplet size on effectiveness of low-volume herbicidal sprays. Weeds 11, 67–72. https://doi.org/10.2307/4040689 Etheridge, R.E., Hart, W.E., Hayes, R.M., Mueller, T.C., 2001. Effect of venturi-type
nozzles and application volume on postemergence herbicide efficacy. Weed Technol 15, 75–80. https://doi.org/10.1614/0890-037X(2001)015[0075:EOVTNA]2.0.CO;2 Etheridge, R.E., Womac, A.R., Mueller, T.C., 1999. Characterization of the spray droplet
spectra and patterns of four venturi-type drift reduction nozzles. Weed Technol 13, 765–770. https://doi.org/10.1017/S0890037X00042202
Farooq, M., Balachandar, R., Wulfsohn, D., Wolf, T.M., 2001. Agricultural sprays in cross-flow and drift. J Agr Eng Res 78, 347–358.
https://doi.org/10.1006/jaer.2000.0660
Feng, P.C.C., Chiu, T., Sammons, R.D., Ryerse, J.S., 2009. Droplet size affects
glyphosate retention, absorption, and translocation in corn. Weed Sci 51, 443–448. https://doi.org/10.1614/0043-1745(2003)051[0443:DSAGRA]2.0.CO;2
Ferguson, J.C., Hewitt, A.J., O’Donnell, C.C., 2016. Pressure, droplet size classification, and nozzle arrangement effects on coverage and droplet number density using air-inclusion dual fan nozzles for pesticide applications. Crop Prot 89, 231–238. https://doi.org/10.1016/j.cropro.2016.07.032
Ferguson, J.C., O’Donnell, C.C., Chauhan, B.S., Adkins, S.W., Kruger, G.R., Wang, R., Ferreira, P.H.U., Hewitt, A.J., 2015. Determining the uniformity and consistency of droplet size across spray drift reducing nozzles in a wind tunnel. Crop Prot 76, 1–6. https://doi.org/10.1016/j.cropro.2015.06.008
Forney, S.H., Luck, J.D., Kocher, M.F., Pitla, S.K., 2017. Laboratory and full boom-based investigation of nozzle setup error effects on flow, pressure, and spray pattern distribution. Appl Eng Agric 33, 641–653. https://doi.org/10.13031/aea.12043 Forster, W.A., Kimberley, M.O., Zabkiewicz, J.A., 2005. A universal spray droplet adhesion model. T ASAE 48, 1321–1330. https://doi.org/10.13031/2013.19179 Giles, D.K., 2001. Pulsed sprays from oversized orifices for increased momentum and
kinetic energy in depositing agricultural sprays. At Spray 11, 701–709. https://doi.org/10.1615/AtomizSpr.v11.i6.60
from hydraulic atomizers. T ASAE 45, 539–546. https://doi.org/10.13031/2013.8821
Giles, D.K., Ben-Salem, E., 1992. Spray droplet velocity and energy in intermittent flow from hydraulic nozzles. J Agr Eng Res 51, 101–112. https://doi.org/10.1016/0021-8634(92)80029-R
Giles, D.K., Comino, J.A., 1990. Droplet size and spray pattern characteristics of an electronic flow controller for spray nozzles. J Agric Engng Res 47, 249–267. https://doi.org/10.1016/0021-8634(90)80045-V
Giles, D.K., Comino, J.A., 1989. Variable flow control for pressure atomization nozzles. J Commerical Veh SAE Trans 98, 237–249. https://doi.org/10.4271/891836
Giles, D.K., Downey, D., Kolb, T., Grimm, J.G., 2003. Pulse-width modulated sprays for flow rate and droplet size control: Spray dynamics and field performance, in:
Downer, R., Mueninghoff, J., Volgas, G. (Eds.), Pesticide Formulations and
Delivery Systems: Meeting the Challenges of the Current Crop Protection Industry. ASTM International, West Conshohocken, PA, pp. 119–133.
https://doi.org/10.1520/STP1430-EB
Giles, D.K., Henderson, G.W., Funk, K., 1996. Digital control of flow rate and spray droplet size from agricultural nozzles for precision chemical application., Precision agriculture. Proceedings of the 3rd International Conference, Minneapolis,
Minnesota, USA, 23-26 June 1996. American Society of Agronomy; Madison; USA.
Giles, D.K., Young, B.W., Alexander, P.R., French, H.M., 1995. Intermittent control of liquid flow from fan nozzles in concurrent air streams: Wind tunnel studies of droplet size effects. J Agric Eng Res 62, 77–84.
https://doi.org/10.1006/jaer.1995.1066
GopalaPillai, S., Tian, L., Zheng, J., 1999. Evaluation of a flow control system for site-specific herbicide applications. T ASAE 42, 863–870.
https://doi.org/10.13031/2013.13265
Gressel, J., 2011. Low pesticide rates may hasten the evolution of resistance by increasing mutation frequencies. Pest Manag Sci 67, 253–257.
https://doi.org/10.1002/ps.2071
Grisso, R.D., Dickey, E.C., Schulze, L.D., 1989. The cost of misapplication of herbicides. Appl Eng Agric 5, 344–347. https://doi.org/10.13031/2013.26525
Han, S., Hendrickson, L.L., Ni, B., Zhang, Q., 2001. Modification and testing of a commercial sprayer with PWM solenoids for precision spraying. Appl Eng Agric 17, 591–594. https://doi.org/10.13031/2013.6906
Hewitt, A.J., 1997. Droplet size and agricultural spraying, Part I: Atomization, spray transport, deposition, drift, and droplet size measurement techniques. At Spray 7, 235–244. https://doi.org/10.1615/AtomizSpr.v7.i3.10
Hobson, P.A., Miller, P.C.H., Walklate, P.J., Tuck, C.R., Western, N.M., 1993. Spray drift from hydraulic spray nozzles: the use of a computer simulation model to examine factors influencing drift. J Agr Eng Res 54, 293–305.
https://doi.org/10.1006/jaer.1993.1022
Hoffmann, W.C., Fritz, B.K., Bagley, W.E., Kruger, G.R., Henry, R.S., Czaczyk, Z., 2014. Effects of nozzle spray angle on droplet size and velocity, in: Sesa, C. (Ed.), Pesticide Formulations and Delivery Systems: Sustainability: Contributions from Formulation Technology. ASTM International, West Conshohocken, PA, pp. 139– 150. https://doi.org/10.1520/STP156920120131
Hoffmann, W.C., Fritz, B.K., Martin, D.E., 2011. Air and spray mixture temperature effects on atomization of agricultural sprays. Ag Eng Int CIGR J 13, Manuscript No. 1730.
Jensen, P.K., Jorgensen, L.N., Kirknel, E., 2001. Biological efficacy of herbicides and fungicides applied with low-drift and twin-fluid nozzles. Crop Prot 20, 57–64. https://doi.org/10.1016/S0261-2194(00)00055-7
Johnson, A.K., Roeth, F.W., Martin, A.R., Klein, R.N., 2006. Glyphosate spray drift management with drift-reducing nozzles and adjuvants. Weed Technol 20, 893–897. https://doi.org/10.1614/WT-05-162.1
Klein, R.N., Johnson, A.K., 2002. Nozzle tip selection and its effect on drift and efficacy. Asp Appl Biol 66, 217–224.
Klein, R.N., Kruger, G.R., 2011. Nozzles - Selection and sizing, EC141 ed. University of Nebraska-Lincoln Extension.
Knoche, M., 1994. Effect of droplet size and carrier volume on performance of foliage-applied herbicides. Crop Prot 13, 163–178.
https://doi.org/10.1016/0261-2194(94)90075-2
Krishnan, P., Williams, T.H., Kemble, L.J., 1988. Spray pattern displacement
measurement technique for agricultural nozzles using spray table. T ASAE 31, 386– 389. https://doi.org/10.13031/2013.30719
Kudsk, P., 2017. Optimising herbicide performance, in: Hatcher, P.E., Froud-Williams, R.J. (Eds.), Weed Research: Expanding Horizons, 1. John Wiley & Sons, Ltd, pp. 149–179. https://doi.org/10.1002/9781119380702.ch6
Lake, J.R., 1977. The effect of drop size and velocity on the performance of agricultural sprays. Pestic Sci 8, 515–520. https://doi.org/10.1002/ps.2780080514
Lake, J.R., Taylor, W.A., 1974. Effect of the form of a deposit on the activity of barban
applied to Avena fatua L. Weed Res 14, 13–18.
https://doi.org/10.1111/j.1365-3180.1974.tb01020.x
Langenakens, J.J., Ramon, H., De Baerdemaeker, J., 1995. A model for measuring the effect of tire pressure and driving speed on horizontal sprayer boom movements and spray pattern. T ASAE 38, 65–72. https://doi.org/10.13031/2013.27813
Lebeau, F., El Bahir, L., Destain, M.F., Kinnaert, M., Hanus, R., 2004. Improvement of spray deposit homogeneity using a PWM spray controller to compensate horizontal boom speed variations. Comput Electron Agr 43, 149–161.
https://doi.org/10.1016/j.compag.2004.01.001
Legleiter, T.R., Johnson, W.G., 2016. Herbicide coverage in narrow row soybean as influenced by spray nozzle design and carrier volume. Crop Prot 83, 1–8. https://doi.org/10.1016/j.cropro.2016.01.009
Luck, J.D., Pitla, S.K., Shearer, S.A., Mueller, T.G., Dillon, C.R., Fulton, J.P., Higgins, S.F., 2010a. Potential for pesticide and nutrient savings via map-based automatic boom section control of spray nozzles. Comput Electron Agr 70, 19–26.
https://doi.org/10.1016/j.compag.2009.08.003
Luck, J.D., Sharda, A., Pitla, S.K., Fulton, J.P., Shearer, S.A., 2011. A case study
concerning the effects of controller response and turning movements on application rate uniformity with a self-propelled sprayer. T ASABE 54, 423–431.
https://doi.org/10.13031/2013.36445
Luck, J.D., Zandonadi, R.S., Luck, B.D., Shearer, S.A., 2010b. Reducing pesticide over-application with map-based automatic boom section control on agricultural sprayers. T ASABE 53, 685–690. https://doi.org/10.13031/2013.30060
Manalil, S., Busi, R., Renton, M., Powles, S.B., 2011. Rapid evolution of herbicide resistance by low herbicide dosages. Weed Sci 59, 210–217.
https://doi.org/10.1614/WS-D-10-00111.1
Mangus, D.L., Sharda, A., Engelhardt, A., Flippo, D., Strasser, R., Luck, J.D., Griffin, T., 2017. Analyzing the nozzle spray fan pattern of an agricultural sprayer using pulse-width modulation technology to generate an on-ground coverage map. T ASABE 60, 315–325. https://doi.org/10.13031/trans.11835
Massinon, M., De Cock, N., Forster, W.A., Nairn, J.J., McCue, S.W., Zabkiewicz, J.A., Lebeau, F., 2017. Spray droplet impaction outcomes for different plant species and spray formulations. Crop Prot 99, 65–75.
https://doi.org/10.1016/j.cropro.2017.05.003
Matthews, G., Bateman, R., Miller, P., 2014. Pesticide application methods, 4th Edition, 4th ed. Wiley-Blackwell.