Sleeping patents: any reason to wake up?
28
0
0
Full text
(2) The PwC&IESE e-business Center is a joint initiative of IESE Business School and the professional services firm PricewaterhouseCoopers aimed at creating a Research Center to analyse the impact of e-business on organizations. The mission of the PwC&IESE e-business Center is to be an international benchmark for companies and universities in the development and communication of new ideas. Based on this mission, the Center has set itself five basic goals: 1). Gather material on “best practices” and “next practices” in e-business.. 2). Develop a conceptual framework that will help enable the world of business to understand and control the impact of the Internet and e-business.. 3). Diffuse the knowledge generated by research in this field through the usual scientific and professional media.. 4). Develop up-to-date, quality teaching materials.. 5). Help train managers to understand the complexity of the changes that technology brings about in society and in the way businesses and competitive advantages are developed.. These goals will be achieved through three activities: research, training, and communication. The Center's efforts will be focused primarily on research, as the foundation for training and communication of the results obtained. http://www.ebcenter.org.
(3) SLEEPING PATENTS: ANY REASON TO WAKE UP?. Abstract Patents are typically characterized as very valuable assets for firms. Nevertheless, there are many patents in a firm’s portfolio that are actually never used. In this paper, we claim that there is a relationship between a firm’s decision to use or not to use a patent and the characteristics of the underlying invention. We characterize patent use according to the “sleeping” or “non-sleeping” character of the patents in the firm’s portfolio. We characterize the underlying invention along different dimensions captured by the patent, i.e. importance, strategic fit, scope and innovativeness. We perform an empirical analysis on a set of patentactive firms in the chemicals industry that trade some of their patents through what is currently the only website specialized in firm technology transfer through the Internet, yet2.com. We use The NBER Patent Citations Data File to obtain information about the patents granted to these firms. Our results suggest that sleeping patents are more innovative, broader and no less important than their counterparts. We conclude that such patents are worth “waking up”, especially when the underlying invention is applicable to business areas far away from the patentholder’s strategic core. These results suggest that there is potential for markets for technology to develop.. Keywords: patents, innovativeness.
(4) SLEEPING PATENTS: ANY REASON TO WAKE UP? (1). Introduction “The Bell Laboratory’s most significant invention of the past 50 years was the transistor, which created the modern electronics industry. But the telephone company saw so little use for this revolutionary new device that it practically gave it away to anybody who asked for it – which is what put Sony, and with it the Japanese, into the consumer-electronics business.” The Economist, Nov. 1st 2001. The above quote illustrates two well-known facts about invention processes. First, a given technology may be (more) useful outside the sector and/or the firm where it was originally developed. Second, if this is true, then re-invention is very likely to occur unless there is inter and intra-sectorial technology transfer. However, technology transfer is not usual. In many cases, technologies lie under- or unexploited on company shelves. This may result in duplication of inventive efforts or technologies that never reach the market. According to the European Patent Office (2001), duplication of inventive efforts costs the European Union $20 billion each year. Moreover, some industry estimates suggest that a patent-intensive company may shelve up to 70% of its patents, a proxy for inventive activity. Under- and non-exploitation has become especially striking nowadays, when knowledge needed in one sector may come from a completely unrelated sector. In fact, recent estimates indicate that some companies have begun to transfer technology –embodied in (neglected) intellectual property assets– to outside industries. According to The McKinsey Quarterly (2002, Number 4), 10% of the patent portfolio of a company with at least 450 patents and $50 million spent in R&D expenses may be transferred to outside industries. There are a lot of examples of technologies coming from external industries: the fibreglass cables in the telephone industry that were developed by a glass company, Corning; the Olestra molecule from Procter & Gamble that started out as a low-fat ingredient for snack foods and ended up as a pollutant remover on contaminated soil; a technology developed by Boeing as part of a military application that was used for Touchbridge Systems as part of an integrated networking system in the home environment; a new technology for expanding the capacity of fiber-optic networks discovered by Polaroid that became quite valuable to telecommunications companies. Moreover, as Cassiman and. (1) I wish to thank Bruno Cassiman for his encouragement, help and suggestions. I am grateful to the e-Business Center PWC&IESE for financial support..
(5) 2. Ueda (2002) point out, some projects conceived at big firms’ labs but never developed may give birth to startups run by their inventors. These facts suggest that projects abandoned by firms are not necessarily unprofitable projects. In fact, profitability might strongly depend on the firm that exploits the project. In the patent case, for instance, the skewness on patents’ profitability is well known (Scherer, 1965). Nevertheless, a patent lying on the lower part of the value distribution in the hands of its current patentholder could be at the opposite extreme of the distribution if exploited by another firm. In this paper, we analyse the characteristics of the patented inventions that remain unexploited on firms’ shelves. We assume that a firm’s decision whether or not to use an invention is related to the intrinsic characteristics of that invention. In particular, we are interested to know whether neglected projects are actually low value inventions or whether they in fact hide a potential value that could be exploited in other hands or in another industry. We focus on patent-protected projects because patents contain information on the characteristics of the underlying invention. Different elements of the patent have been tested as proxies for different invention dimensions, including value –social value (Trajtenberg, 1990), private value (among others, Harhoff et al., 1999) and market value (Hall et al., 2000)–, basicness (Trajtenberg et al., 1992) and scope (Lerner, 1994). Some of these validated patent-based proxies have been used to analyse firm decisions such as startup formation (Shane, 2001). The literature has underlined as main determinants of project rejection the lack of complementary assets to bring an innovation to market (Shane, 2001) and the poor fit of the project with the firm’s strategy (Teece, 1986). Nevertheless, firms differ in their criteria for selecting projects. In particular, a firm will tend to reject more projects the more patentintensive the firm is (Klepper & Sleeper, 2002), the older it is, or the higher its profits are (Cassiman & Ueda, 2002). Also, there may be other reasons why a firm decides not to undertake a project, apart from the characteristics of the underlying invention or the characteristics of the firm. This is specially true in the case of projects protected by patents, where legal protection allows for strategic considerations. For instance, a patent may prevent competitors from entering a particular technological area. Thus, a firm may use a patent merely for blocking purposes –either because it wants to reserve to itself the right to enter this area in the near future or because it wants to prevent competitors from strengthening their position by entering that area. Patents may also allow a firm to wait until market uncertainty is overcome (Takalo and Kanniainen, 2000). In these and similar cases, even if projects are not developed and marketed, we cannot consider them as rejected projects. They serve a definite purpose in the firm’s project portfolio: their strategic use. Moreover, patent-protected projects facilitate arm’s-length technology transactions. A project protected by an intellectual property right makes the transfer less subject to problems of opportunism (Arora and Fosfuri, 2000). This is specially true in industries where patents are an effective means of protection –chemicals, software, machinery and engineering services– and as a result, markets for technology arise (Arora et al., 2000). In these industries, therefore, patented projects may have a quite straightforward outside opportunity, i.e. licensing or sale. This means that even if a patented project has no value inside the firm, the firm may choose to license it to some other company that will be able to extract rents from it. However, this alternative turns out to be very costly outside these industries, when the deal links firms in different sectors or, even in the mentioned sectors, for newcomers or small firms. In many cases, in fact, licensing is impracticable even for patented projects..
(6) 3. In this paper we focus on patent-protected projects for a number of reasons. First, patents are a good proxy for inventive activity by firms (2) and contain a lot of information about the underlying invention. More importantly, rejected projects mean rejected patents, also known as “sleeping patents”. A rejected patented project is, in principle, more inefficient than a rejected project. In both cases, there is an inefficiency if the invention never reaches consumers. And in both cases there is an inefficiency if the invention is reinvented by a competitor, owing to the duplication of research efforts (3). However, if the invention is not patented in the first place, consumers will eventually benefit from the invention, whereas if it is patented, they will not benefit (or only after a delay), as the patent will prevent competitors from introducing the innovation (until the patent expires). The literature has not devoted a lot of attention to sleeping patents, despite the importance of the phenomenon. As mentioned earlier, a huge percentage of the patents owned by patent-intensive firms are sleeping. For instance, IBM, Philips and Siemens are reported to use only around 40% of their intellectual property portfolio (4). For our research we use a unique dataset of sleeping patents collected from yet2.com, the only website active in technology transfer between firms. We match this dataset with the NBER Patent Citations Data File in order to analyse whether sleeping patents differ significantly from the firm’s “average patent” along different dimensions. This way, we are able to estimate the magnitude of the inefficiency due to the existence of sleeping patents. The greater the value potential of the underlying inventions, the more inefficient it would be to keep them sleeping. Thus, we are able to conclude whether they are worth waking up. Our results suggest that sleeping patents are more radical innovations and fit better with the firm’s strategy than the rest. We do not find significant evidence that they are less important patents than the rest. These results suggest that sleeping patents are not just marginal patents but may have some hidden potential for value that could be realised in other hands than the patentholders’.. 2. Theoretical development The following section is split in two parts. Firstly, we propose a definition of sleeping patents. Secondly, we develop our hypotheses. 2.1. A definition of sleeping patents Previous literature offers no explicit definition of sleeping patents, even though it does provide some rationale for their existence (Kutsoati and Zabojnik, 2001) (5). They are (2) It is worth mentioning that the relationship between patents and projects is not one-to-one. A new technology may be protected by one patent (in Chemicals, the mean is two or three patents per product) and up to one hundred patents (in Electronics, for example). In this paper, we will focus on the first type of patented inventions; therefore, we do not believe that this fact poses a serious problem to our analysis. (3) Note that if the invention is patented, competitors may either come by chance to the same result or they may invent around the patent (it is public information). In the latter case, the inefficiency due to duplication of efforts is smaller than in the not-patented case. In this situation, the total inefficiency brought by the project rejection will be higher in the patented case as long as the inefficiency due to consumers not profiting from the innovation plus the inefficiency caused by inventing around it is greater than the inefficiency due to the duplication of efforts in the non-patented case. (4) According to Financial Times, July 2001. (5) They show that a durable-good monopolist may strategically shelve a patent (when its use is socially desirable) because its potential adoption intensifies the monopolist’s time inconsistency problem..
(7) 4. mentioned as patents that have never turned into an industrial application (6). However, this definition of sleeping patents as patents covering inventions that have been rejected by the firm, that is, inventions that the firm has not brought to market, is not very precise. First, we should note that an invention can reach the market through development by the patentholder, or through development by a licensee or an alliance, joint venture or some other type of agreement with a third party. A licensed patent, for instance, is not a sleeping patent. Second, not all the inventions that do not reach the market are actually rejected, especially when they are patented. The firm may choose to keep some of them for strategic reasons, given that they are protected by a patent. Some authors have recently emphasised the increasing strategic role of patents. A patent may be used to prevent entry in an area in which competitive pressures would be much higher if competitors were allowed in (Gilbert and Newbery, 1983). A patent may also be used as a “legal bargaining chip” (Hall and Ham, 1999) when negotiating a cross-licensing agreement, an infringement suit or access to external finance. A patent can be used to “build a wall” to effectively protect a really core invention by the firm (Hopenhayn and Mitchell, 1999). A patent gives the patentholder the right to wait and see how market uncertainties are resolved before launching the innovation to market (Takalo and Kanniainen, 2000). A patent may allow a firm to block entry to competitors until it has all the complementary assets needed to bring the invention to market (Shane, 2001). Therefore, patented inventions may play a key role in a firm’s intellectual property strategy, even if they are not brought to market. Consequently, we cannot consider patents that are used for strategic purposes as sleeping patents. Third, patents and inventions are not related one-to-one. One invention may be covered by many patents, and one patent may cover different inventions. The latter case is illustrated by basic inventions such as the laser or Lycra, which may generate a lot of applications but not all of them are likely to actually be developed. Therefore, we could consider applications that are covered by the patent but that are developed as sleeping applications. From this point of view, given the increasing anecdotal evidence of inventions originated in one sector but applicable to others, many patents would have sleeping applications, that is, they would be partially sleeping. If the firm were aware of this fact, it would be possible to detect sleeping applications with the help of broad-based technologists (Elton et al., 2002). In many cases, however, the patentholder is not even aware that its invention could be useful outside its sector. In these cases, the firm will not make any decision about its patent that would allow us to identify it as partially sleeping. This means that we will not be able to identify underexploited patents in a firm’s portfolio unless the firm itself is aware of their status as sleeping patents. Therefore, we should restrict our definition of partially sleeping patents to patents that the firm actually knows are underexploited. To sum up, our definition of (partially) sleeping patents is this: patents (or applications in a patent) that are consciously not being used by the patentholder, directly or through a third party, either to launch an application to market or for strategic reasons. 2.2. Determinants of the decision to leave a patent unexploited In this subsection, I argue that certain dimensions of an invention, such as importance, broadness, radicalness and strategic fit, may influence the decision not to exploit a patent. I also consider firm characteristics that may influence this decision. (6) One of the three requisites an invention has to satisfy to be eligible for a patent is “to have industrial applicability”. However, there is no requirement to actually use the patent in an industrial application once it has been granted..
(8) 5. – Private Value or Scientific Importance Patent value has been captured through a variety of indicators: the social surplus brought by the protected invention; the private value as perceived by the patent owner (renewal or litigation decisions (7)); or the private value as perceived by third parties (stock market valuation, opposition (8)). The value of the invention, either social or private, has been linked in the literature to the importance the scientific community gives to the invention (Trajtenberg, 1990; Harhoff et al., 1999; Hall et al., 2000; among others). Private value translates into economic value for the patentholder (Harhoff et al., 1999). Therefore, relevant technological discoveries anticipate greater economic value for the firm. This fact supports Shane’s (2001) finding about the positive effect that the importance of the invention has on the likelihood of new firm formation. Similarly, the importance of an invention is likely to affect the firm’s decision of whether to undertake its development. The higher the invention’s private value, the more likely it will overcome the firm’s opportunity cost and the more willing the firm will be to face uncertainties. Conversely, the less important the patent, the less likely the firm will be to develop the underlying invention. Consequently, we suggest that the more valuable an invention, the less likely it will be left sleeping, and viceversa. – Strategic fit Established firms have developed organisational and technical capabilities associated with their core activities. As a result, they are much more efficient at exploiting opportunities inside these boundaries than outside them. That is a reason why activities such as research and development are focused on projects that will allow the firm to exploit its existing capabilities. However, outcomes from the research phase are, up to a point, random (9). In the development phase, by contrast, projects may be easily selected to better fit the complementary assets available in the firm, in order to better appropriate their value. Therefore, inventions resulting from the research process are likely to be screened according to how they fit with the firm’s existing complementary assets. In research-intensive industries, a firm’s existing capabilities are likely to be highly specialised in the development of a very particular type of innovation, namely, the type of innovation that is closest to the firm’s existing business. Consequently, the firm will filter projects according to how close they are to its core businesses. The same argument holds for the decision to maintain patented inventions for strategic reasons. Patents closest to the firm’s core are the strategically most valuable ones to keep in order to protect key innovations, keep competitors at bay, or increase the value of the firm’s patent portfolio. Of course, patents are also strategic in new areas of research, but the relative importance is lower than in key areas. Therefore, we suggest that inventions that have a better fit with the firm’s existing activities are more likely to be developed (by whatever means) by the firm. Conversely, the further removed research results are from the firm’s core activities, the greater the likelihood that these results will remain unexploited. (7) We refer to litigation decisions where the patent owner is the plaintiff. (8) Opposition refers to a procedure in the European Patent System where a competitor may challenge a patent in the EPO by presenting evidence that the prerequisites for patentability are not fulfilled (see Harhoff and Rietzig, 2001). (9) An inventor’s research output could be limited to the core of the firm if she credibly commits not to implement inefficient projects ex post (Rotemberg and Saloner, 1994)..
(9) 6. – Scope Scope refers to the technological space the patent covers or protects from infringement. Characteristics of the invention determine scope, but scope is also influenced by how inventors “design” the patent. Scope has been linked to the economic value associated with the patent (Lerner, 1994), since it determines the degree of protection, that is, the number of potential products that will infringe the patent. However, Shane (2001) considers scope a different dimension from importance. He shows that broadness is specially relevant for entrepreneurs, because it gives them more time to obtain complementary assets, and that is much more critical for new than for established firms. Therefore, scope seems to be especially valuable for firms when they need extra protection (10). This will be the case, for instance, if the invention does not fit in any of the firm’s existing business and the firm must first acquire and develop new complementary assets. It will also be the case when there is high uncertainty regarding the potential value of the invention, as often happens with the outcomes of basic research. In these cases, if the invention is covered by a broader rather than a narrower patent, it is more likely that the patent will be used. To sum up, in any given situation, a broader patent is more likely to be used than a narrower patent, because patent protection will be stronger. However, the more the firm needs this stronger protection, the greater the chances that a broader patent will go to market or be used strategically compared with a narrower patent. Nevertheless, note that the broader the patent, the larger the technological space it covers and, therefore, the larger the array of potential applications that can be developed under its protection. This means a higher probability that some of these applications will actually remain sleeping. Therefore, two opposite effects may arise with respect to this dimension of the invention. The larger the scope, the more likely that the patent will be used and, therefore, the less likely that it will remain sleeping. However, the larger the scope, the more likely that some of its applications will actually remain sleeping. – Radicalness or Innovativeness Many authors have argued that entrants are more likely to introduce radical innovations than incumbents, whereas incumbents are more likely to introduce marginal improvements of current technologies (Henderson, 1993, among others). Radical innovations, as the name suggests, often represent a clean break with the firm’s traditional line of research. Not only are existing assets and capabilities useless for undertaking these projects; introducing these innovations may actually destroy the firm’s existing business (through cannibalization, for instance). These are the two main reasons why established firms are unwilling to engage in highly innovative projects. Conversely, entrants have no well developed skills to be undermined, so they are not reluctant to accept such projects. In fact, they are willing to undertake the projects that do not fit into established firms because they will not have to face competition from them. Shane (2001) finds some evidence of this: in their decision to form a new firm, entrepreneurs are more likely to pick up more innovative patents rather than less innovative ones. Most of the literature suggests that the allocation of projects between incumbents and start-ups is due to inefficiencies in the decision process (10) Even though any firm will prefer broad to narrow patents, broadness is costly (it means devoting more resources to enforcement and more possibilities of infringement, and, therefore, of litigation). Moreover, broadness is not only determined by the firm’s decision..
(10) 7. of the incumbents. In contrast, Cassiman & Ueda (2002) suggest that it is due to the comparative advantage of the start-up to adopt more radical projects. Previous literature clearly suggests that the more radical the invention, the less likely an established firm is to undertake its development. Therefore, in an established firm, the more innovative the invention, the more likely that it will remain sleeping.. 3. Methodology 3.1. Data The data we use come from two sources. We use “The NBER Patent Citation Data File” (Hall, Jaffe & Trajtenberg, 2001) to select a sample from the population of patents assigned from 1981 to 1999 by the USPTO to a set of 101 patent-active firms. These firms are not selected randomly but are identified as customers at yet2.com, the nowadays unique website devoted to the transfer of patented technologies between firms (11). Outside the Internet, there is no proper marketplace for technology transfer (Arora et al., 2000). Instead, there are very fragmented sectorial markets or consultant firms that search for licensees and licensors on a case-by-case basis. This fact makes selling or licensing intellectual property particularly costly. The mentioned web site, yet2.com, was founded with the aim of lowering the most elementary transaction costs, coordination costs, by creating a virtual marketplace where supply and demand of intellectual property assets could meet. Transfer of intellectual property assets also involves high levels of motivation costs (12). That is why this website created a market for underused technology focused on big and well-known firms. In this way, potential motivation costs are mitigated thanks to the reputation effects of these firms as suppliers of technology. The reason we used this criterion (being a customer at yet2.com) to select the firms is the following: we can identify, from among all the patents that each of these firms has in its portfolio, the patents it chooses to offer on an Internet marketplace. We assume that this decision captures the fact that these are the firm’s sleeping patents. Sleeping patents are idle resources for the firm. They are patented projects the firm rejects because they are not profitable enough (given the firm’s opportunity cost) to warrant development or licensee search. Yet2.com has created an Internet marketplace for technology transfer that offers an alternative for all these projects by reducing the cost of the external option (licensing or selling). In most cases, however, licensing through the Web is not an alternative to traditional ways of licensing. Traditionally, licenses are signed, amidst great secrecy, among parties that transact repeatedly or that have some established reputation in the market for technology. The reason: the risks of disclosure to a third party (ex-post opportunism problems), which are minimized through market enforcement mechanisms such as reputation or repeated games. In an Internet marketplace, deals are offered in an open marketplace which almost everybody (11) yet2.com was founded in the year 2000 and had as initial competitors pl-x.com and ipex.com, which did not survive. Nowadays, only yet2.com (acquired by Scipher, December 2002), in the firm niche, and techex.com (acquired by UTEK Corporation, 2002), in the university niche, are devoted to the patented technology transfer business through the Internet. (12) Motivation costs are derived from information asymmetries between the two contracting parties that may result in opportunistic behaviour. In the licensing case, for instance, the licensor does not know about the performance of the technology in the licensee’s hands or how he will use the knowledge acquired in the licensing deal. Similarly, the licensee does not know about the actual quality of the technology and the degree.
(11) 8. in the industry can access. This may raise strategic concerns for the supplier regarding disclosure (the firm reveals information to the rest of the industry players about a given technology) and unknown potential licensees (who may use the knowledge acquired during the license period to develop a competing technology). Knowing the suppliers’ concerns, buyers may have their own concerns regarding the quality of the technology on offer in such a marketplace. Consequently, an Internet marketplace is unlikely to take the place of traditional licensing mechanisms. Instead, it will offer an alternative to own development (or strategic use) and traditional licensing. Thus, patents offered for sale via yet2.com are likely to be idle patents, that is, patents covering projects that the firm has decided not to develop, use strategically or license through traditional means. We restrict our attention to firms offering patents for sale or license in the “Chemicals” or “Biotechnology” categories as defined by the United States Patent Office (13). In these sectors, patents are an effective means of protecting inventions, and technology transfer between firms is commonplace (14). Therefore, chemical and biotech patents offered for sale on the Internet have interesting characteristics. First, they are patents that can actually enforce the protection of the invention transferred and so make the transfer of technology less costly (more likely). Second, since technology transfer already takes place in these sectors, firms have had the chance to license through traditional means before deciding to offer their patents in an Internet marketplace. Third, because of the effective protection conferred in this case, strategic use is also a relevant alternative. Therefore, we have patents that firms have actually chosen not to develop, use strategically or license through traditional channels. Having selected the sample of sleeping patents (955 observations), we identified the patentholders (101 firms). Then, from the NBER database, we identified the portfolios of patents granted to these firms in the chemicals and biotech categories from 1981 to 1999 (15). Having identified the population of non-sleeping patents, we drew from it a random sample of 18876 patents (16). From the NBER database, we retrieved individual patent information about the sleeping and non-sleeping patents, including application year, year granted, primary sector, number of citations made and received, and other primary and constructed variables. (13) yet2.com classification of technologies into categories is based on the patentholder’s criteria and does not necessarily correspond with the classification proposed by the NBER authors, based on the primary class the United States Patent Office (USPTO) assigns the patent. Consequently, we select the patents that fit the “Chemical” or “Drugs and Medical” categories under both classifications. This selection may introduce some bias, since we restrict the analysis to patents that fall within these categories according to their primary class. However, a given patent can have applications in more than one sector, and this is captured by both its primary and secondary classes. Thus, we are missing the effect of patents whose secondary classes are mapped into the chemicals and biotech sectors. Nevertheless, including all the patents identified under chemicals or biotech in yet2.com independently of their USPTO classification would have introduced more serious biases. (14) As Arora (1994) points out: “in the chemical industry (..) the object of discovery can be described clearly in terms of formulae, reaction pathways, operating conditions and the like”. This fact makes clear the object of the patent and, thus, strengthens the protection. This strong protection makes licensing specially feasible and a major strategy of rent appropriation in this sector, as opposed to others. (15) Sleeping patents identified are granted up to 2002, but the NBER database from which we extract the information only covers up to 1999. (16) The non-sleeping patent population (from chemicals and biotech) adds up to 64006 patents. Consequently, non-sleeping patents represent only 1.5% of the whole sleeping-patents population (see Table 1 for the distribution of sleeping and non-sleeping patents across patentholders). We therefore draw a random sample of the non-sleeping-patents population in order to achieve 5% sleeping-patents vs. 95% nonsleeping patents. The random sample was obtained by Stata7 by randomly selecting 28% of the whole portfolio of chemicals and biotech patents of these firms. The only restriction was to maintain the overall proportion of chemicals and biotech patents found in the sleeping-patent sample (86% vs. 13%)..
(12) 9. 3.2. Analysis We have used these data to estimate the probability of patent rejection by the firm. Each observation represents a patent. The outcome variable is a binary dependent variable: it captures the decision by the firm whether or not to offer a patent in the mentioned Internet marketplace (we assume that this decision reflects the sleeping or non-sleeping nature of the patent). We should therefore use a discrete choice model with the following specification for patent j in firm I: Y ij = β X ij+ε ij *. © ©. where. Y * ij > 0. Yij = 1 if Yij = 0. Y * ij ≤ 0. where Y*ij denotes the unobservable propensity to sleep, X is a vector of patentvarying exogenous variables and εij is the unobservable error term. Therefore, it is assumed that patent sleeping incidence is observed only when the patent’s propensity to sleep is greater than a threshold equal to zero. Nevertheless, we cannot assume independence on the error terms since, by construction, there are many patents in the sample owned by a given firm i. Thus, each firm represents a cluster of correlated observations. In order to capture unobserved firm-specific effects, we should introduce an extra variable to the model, αi.. Υ∗ij = αi + β'Xij + εij. j = 1,2,…Ni. ;. i = 1,2,…I. where αi captures the firm-specific unobserved characteristics. The dilemma is whether αi should be treated just as a constant term over firms (fixed effects model) or as a random variable just like the error term (random effects model). The latter approach obtains more efficient estimates but it requires the assumption that the αi’s are independent of the X’s, that is, the firm effects term should be uncorrelated with the explanatory variables (if our estimates are to be consistent). The Hausman test allows to test this assumption (Maddala, 1993). The results of the Hausman test differ with the specification of the model. Thus, we do not find conclusive evidence either for rejection or for acceptance of the null hypothesis of consistency of the random effects model. Nevertheless, we are interested in including some firm-invariant variables such as the size of a firm’s patent portfolio. In this case, if we use the fixed effects model we cannot estimate the parameters λ, because αi captures the effect of all the time-invariant variables. Therefore, since we do not find conclusive evidence for the rejection of the random effects model and we want to estimate the parameters λ, we treat αi as random. The specification is as follows: * ′ i + εij Y ij = αi + β ′X ij + γ z The probit regression is the most appropriate discrete choice technique to estimate it (Maddala, 1993). Therefore, we use a probit random effects model. 3.3. Variables 3.3.1. Dependent Variable The dependent variable reflects the sleeping or non-sleeping character of the patent. Patents are coded 1 if identified as being offered in yet2.com and thus considered sleeping patents, and 0 otherwise. There are 18876 observations coded as 0 and almost one thousand patents (955 observations) coded as 1, which represents five percent of the total. These patents correspond to a set of 101 different firms. Nevertheless, we shall drop observations from firms that have less than 1% of observations coded as 1. This results in a set of 86 firms with 10956 observations coded as 0 and 907 observations coded as 1, which represents 7.65% of the total..
(13) 10. 3.3.2. Predictor Variables – Importance Previous literature has suggested as a proxy for “patent value” the number of citations a patent receives from subsequent patents. When inventors patent an invention, they must cite the previous inventions their innovation builds upon. Patents that receive more citations are thus considered to be making a bigger contribution to the scientific community than patents with fewer citations. Therefore, citations received from subsequent patents reflect a given patent’s contribution to further research (see Jaffe et al., 2000 for evidence from a survey). The validity of this proxy has been tested by analyzing its correlation with other measures of value. Trajtenberg (1990) found that the more socially valuable patents were more frequently cited. Hall et al. (2000) concluded that companies with more frequently cited patents have higher stockmarket values. Harhoff et al. (1999) found that German patents renewed to full term (17) are more highly cited and that, among the full-term patents, the most valuable ones –according to the patentholder’s assessment– were also the most frequently cited. Citations present the following practical problem: because the data are truncated at a certain point in time, patents granted closer to this truncation date have a shorter time span to receive citations. As the NBER data reveal, a patent will have received only 50% of its citations in ten years from its granted year (Hall et al., 2001), although citation lags seem to have been shortening in recent years. These authors propose two methods to empirically deal with this situation: i) standardization, which removes variance due to truncation and also some variance due to real effects; and ii) econometric models, which allow us to identify these two sources of variance but require some assumptions about the process that may drive differences in citations across groups. We use the first method, standardization, because we are working with only two groups of patents (chemicals and biotech) which we do not expect to have very divergent citation patterns (we will subtract the same real variance, if any, in both cases). Alternatively, we simply introduce year dummies (18). – Strategic fit We measure strategic fit through self-citations received. Self-citations refer to citations received from patents owned by the same firm. Therefore, as citations received proxy the importance of a patent for the scientific community, self-citations received may proxy the importance of a patent for the firm. The more important a patent is for the firm, the more likely it is to be linked to the firm’s core technologies. As we will mention, the further away a technology is from the firm’s current assets and capabilities, the less incentive the firm will have to invest in that technology. Therefore, the more self-citations a patent receives, the more likely it will be to fit with the firm’s strategic core. We also consider the number of inventors as a proxy for strategic fit. Reitzig (2001) considers that a large number of inventors points to patent complexity. We believe that the number of inventors is an indicator of the resources the firm devotes to a particular research (17) Patents have a 20-year validity span. However, the patentholder must pay renewal fees (annual and progressive in the German case) in order to maintain the patent right valid. Otherwise, the patent right lapses. (18) As Shane(2001) does. See Henderson et al. (1998) and Lerner (2001) as empirical analyses using the standardization method..
(14) 11. line. Since an established firm has incentives to devote more resources to the projects that are closest to the firm’s already existing assets, the more resources the firm devotes to a project, the better it will fit with the firm’s strategy. Following the same reasoning, we suggest another potential indicator related to the strategic fit of the patent in the firm’s portfolio: the frequency in the firm’s patent portfolio of the patent class to which a given patent is assigned. We assume that the more frequent the patent class is in a firm’s patent portfolio, the more likely it is to represent a core research line in the firm. – Scope There have been different attempts to measure scope, i.e. the technological space a patent covers. The most widely used indicator (Lerner, 1994; Shane, 2001; Reitzig, 2001) is the number of patent classes a patent is assigned to, which reflects the number of potential sectors of activity in which the patent may be applicable. Instead, we use the number of patent classes the citations received by a patent are assigned to, as suggested by Trajtenberg et al. (1992). We consider that the spread across patent classes of citations received gives an idea of the technological space the patent covers (in which fields a given patent is considered as prior art). In the NBER paper, a Herfindhal-type concentration index for citations received (generality) is proposed: Generality j = 1 − ∑ k s2jk nj. s2jk = percentage of citations received by patent j that belong to patent class k out of nj patent classes A higher generality means a lower concentration of citations across patent classes and therefore, a higher spread of the patent impact. Therefore, the higher the generality, the higher the scope. As NBER authors point out, a general technology can be understood as a “general purpose technology”. We adjust this measure by the number of citations, since they introduce a bias (as suggested by Hall et al., 2001). Moreover, this adjustment allows to correct for correlation. We call the adjusted variable adjusted generality. AdjustedGenerality j = Generality j. C C −1. C = number of citations received We also use the number of claims, as proposed by Lanjouw & Schankerman (1999). Claims are the number of sentences that describe an invention; they can be interpreted as “units of invention” (Jaffe, Hall & Trajtenberg, 1999). The higher the number of such “units”, the broader the technological space the patent covers. We can think that this measure as highly endogenous (Reitzig 2001), because the firm may decide to break down the “actual” blocks of invention into the smallest possible pieces. However, the firm’s discretion in the way it describes the innovation is highly constrained by the type of technology and the patent officer examination..
(15) 12. – Radicalness/Innovativeness We measure the degree of innovativeness with a set of variables. First, we consider the number of citations the patent made to previous patents. The lower the number of citations made, the less derivative in nature the patent is, i.e. the less it builds upon previous research (Lanjouw & Schankerman, 1999) and the more innovative it can be considered. Second, we consider originality (adjusted originality), a Herfindhal-like index that measures the concentration of the citations a patents makes across patent classes. The wider the spread of citations made, the more original the invention. A high spread of citations made means that the invention is “breaking molds” (Hall et al., 2001) rather than being a mere sequential invention. Therefore, the more radical the innovation will be. We also consider as a proxy for innovativeness the mean time lag between the grant year of the patent and the grant year of the subsequent patents that refer to it (forward lag). The later the citations come, the later others realised about the potential of this area of research, meaning that the firm was initially working on it alone (19). We also introduce the analogous measure to forward lag but referring to citations made (backward lag). The older the patents the invention relies on, the less innovative it is considered. Finally, another potential proxy for radicalness more related to the degree of innovativeness inside the firm is self-citations made, i.e. the percentage of citations made to previous patents assigned to the same firm over all the citations made. The lower the ratio of self-citations made, the more recent this research line is to the firm. We propose more than one proxy for some of the patent dimensions that we want to analyze. Nevertheless, none of them aims to be “the” proxy for a given patent characteristic. Rather, they try to capture different dimensions of it. Looking at their correlation (Table 2), we can see that they are actually quite independent measures and that we will not suffer from multicollinearity problems if we use them in the same regression. 3.3.3. Control variables – Firm characteristics We control for the following firm characteristics: patent portfolio, size and diversification (20). These characteristics may affect the firm’s decision whether to shelve or to use a patent, as well as the characteristics of the patented invention. All these measures are from 1996, the last year for which we have patent data. The size measure is firm sales, obtained from Compustat. It may have a direct as well an indirect effect on the likelihood of keeping sleeping patents. On the one hand, size is a proxy for bargaining power. The larger the firm, the better positioned it is considered to be in potential licensing deals. This may affect its willingness to engage in such deals. This may mean either that the firm actually engages in more deals and, therefore, has fewer sleeping patents; or that it is more willing to wake up its patents once there is a less costly means of (19) Lanjouw & Schankerman (1999) suggest the interpretation for early citations (20) The latter two measures are available only for a certain set of firms (public US-based firms with more than $10 million in assets and 500 shareholders)..
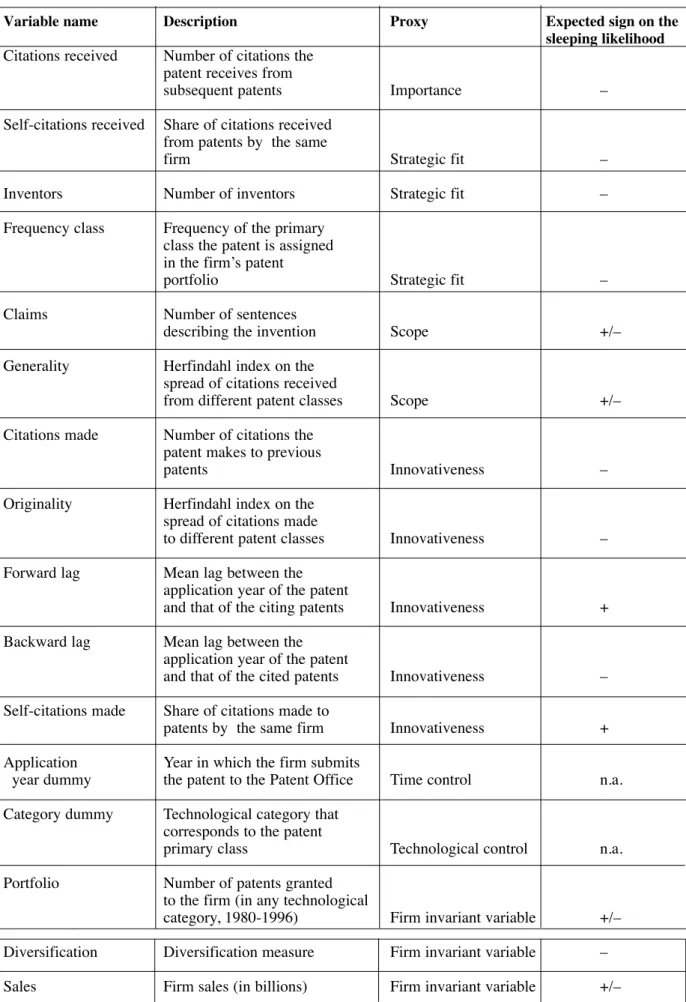
(16) 13. marketing them (such as a Web-based marketplace). On the other hand, we may expect size to affect the way the firm perceives different invention characteristics when considering whether to adopt or reject a project. We have mentioned, for instance, that bigger firms are more reluctant to adopt more innovative projects. The portfolio measure is a count measure on the number of patents granted to a given firm from 1980 to 1996. The patent portfolio is a more accurate proxy for the firm’s bargaining power than firm size. If the firm has a larger amount of patents, it will actually have a stronger position in a negotiation. Moreover, a firm with a larger patent portfolio will be more used to managing and exploiting its intellectual property through licensing or sale (it will probably have a technology transfer department, for instance). Therefore, the more patent-intensive the firm, the fewer sleeping patents it is likely to have. However, for the same reason, it will not be reluctant to wake up its patents in a Web-based marketplace. To compute the diversification measure, we use data on the firm’s sales at the business segment level, available in Form 10-K filed with the Securities and Exchange Commission (SEC), to compute a diversification measure (as proposed in Davis et al., 1994). The diversification measure takes the form: Diversification =. ∑ p ln(1/ p ) , i. i. pi = proportion of the firm’s sales made in segment i (21). We hypothesize that the more diversified the firm, the less likely it will have sleeping patents. In a diversified firm, there are more chances that a given invention will be exploited in some of the firm’s activities or that it will be licensed or sold to external partners, thanks to a larger and more diversified network. – Time This control is required because all citations or citations-related variables are timedependent. We control for the year in which the patent is applied for (from 1981 to 1999). – Technology classes The majority of the independent variables vary with the technology field of the patent, from claims to all citations-related measures. Thus, to compare patents from different fields, we should control for technology categories, which are built upon patent classes (Hall et al., 2001). These authors distinguish up to 6 technology categories, but here we shall focus only on two, Chemicals and Drugs & medical. Table 1 presents a summary of the variables.. (21) Segments identified according to the 4-digit level Standard Industrial Codes –SICs-.
(17) 14. Table 1. Summary of variables Variable name. Description. Proxy. Citations received. Number of citations the patent receives from subsequent patents. Importance. –. Share of citations received from patents by the same firm. Strategic fit. –. Inventors. Number of inventors. Strategic fit. –. Frequency class. Frequency of the primary class the patent is assigned in the firm’s patent portfolio. Strategic fit. –. Number of sentences describing the invention. Scope. +/–. Herfindahl index on the spread of citations received from different patent classes. Scope. +/–. Number of citations the patent makes to previous patents. Innovativeness. –. Herfindahl index on the spread of citations made to different patent classes. Innovativeness. –. Mean lag between the application year of the patent and that of the citing patents. Innovativeness. +. Mean lag between the application year of the patent and that of the cited patents. Innovativeness. –. Share of citations made to patents by the same firm. Innovativeness. +. Application year dummy. Year in which the firm submits the patent to the Patent Office. Time control. n.a.. Category dummy. Technological category that corresponds to the patent primary class. Technological control. n.a.. Number of patents granted to the firm (in any technological category, 1980-1996). Firm invariant variable. +/–. Diversification. Diversification measure. Firm invariant variable. –. Sales. Firm sales (in billions). Firm invariant variable. +/–. Self-citations received. Claims Generality. Citations made. Originality. Forward lag. Backward lag. Self-citations made. Portfolio. Expected sign on the sleeping likelihood.
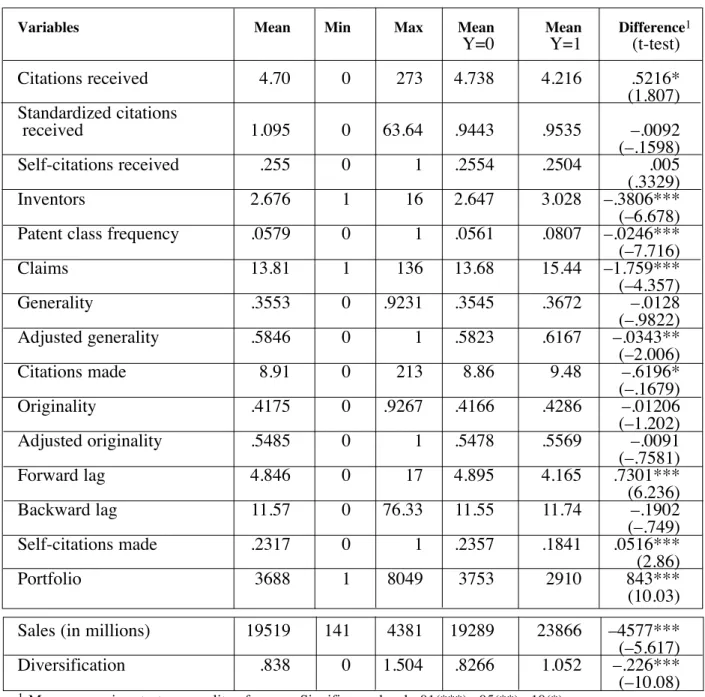
(18) 15. 4. Results 4.1. Descriptive statistics We report in Table 2 the descriptive statistics for the set of patent data that we will mainly use in the regression analysis. It corresponds to a set of 86 firms and 11863 observations (22). We can appreciate significant differences in means for the two subsamples: sleeping (Y = 1) vs. non-sleeping (Y = 0) patents. Variables with a significant and negative difference are claims, adjusted generality, citations made, inventors, frequency, sales and diversification. Variables with a positively significant difference include citations received, forward lag, self-citations made and patent portfolio. Table 2. Descriptive statistics (non-truncated sample) Variables. Citations received. Mean. Min. Max. Mean. Mean. Difference1. Y=0. Y=1. (t-test). 4.70. 0. 273. 4.738. 4.216. .5216* (1.807). Standardized citations received. 1.095. 0. 63.64. .9443. .9535. Self-citations received. .255. 0. 1. .2554. .2504. Inventors. 2.676. 1. 16. 2.647. 3.028. Patent class frequency. .0579. 0. 1. .0561. .0807. Claims. 13.81. 1. 136. 13.68. 15.44. Generality. .3553. 0. .9231. .3545. .3672. Adjusted generality. .5846. 0. 1. .5823. .6167. 8.91. 0. 213. 8.86. 9.48. Originality. .4175. 0. .9267. .4166. .4286. Adjusted originality. .5485. 0. 1. .5478. .5569. Forward lag. 4.846. 0. 17. 4.895. 4.165. Backward lag. 11.57. 0. 76.33. 11.55. 11.74. Self-citations made. .2317. 0. 1. .2357. .1841. Portfolio. 3688. 1. 8049. 3753. 2910. –.0092 (–.1598) .005 (.3329) –.3806*** (–6.678) –.0246*** (–7.716) –1.759*** (–4.357) –.0128 (–.9822) –.0343** (–2.006) –.6196* (–.1679) –.01206 (–1.202) –.0091 (–.7581) .7301*** (6.236) –.1902 (–.749) .0516*** (2.86) 843*** (10.03). 19519. 141. 4381. 19289. 23866. .838. 0. 1.504. .8266. 1.052. Citations made. Sales (in millions) Diversification 1. –4577*** (–5.617) –.226*** (–10.08). Mean comparison test on equality of means. Significance level: .01(***), .05(**), .10(*).. (22) Although we will report some results for the set of 101 firms, we mainly drop from the analysis the 15 firms with less than 1% of sleeping patents, since they may distort results..
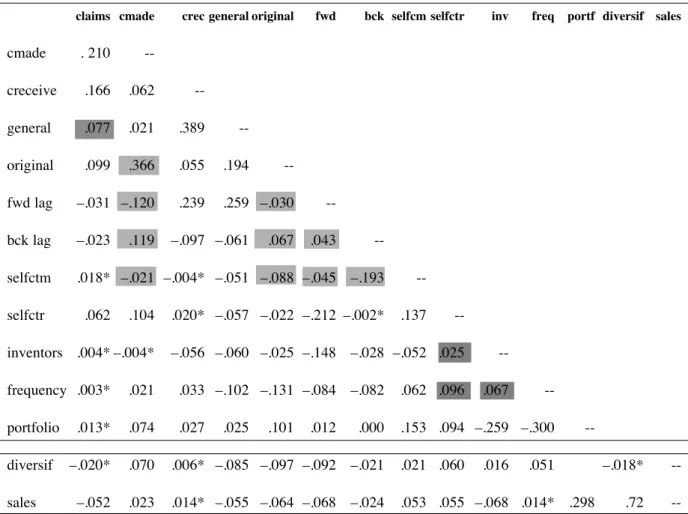
(19) 16. In Table 3 we present the correlation between the variables used as regressors. Many of them present a correlation significant at a one percent level. However, the highest correlation coefficients are ρ = .389 (between general and citations received) and ρ =.366 (between original and citations made) (23). The next highest correlation is ρ = .259 (between general and backward lag and portfolio and inventors). These levels of correlation do not suggest the presence of multicollinearity problems, as confirmed by the high tolerances. When we include diversification and sales, the highest correlation level is ρ = .727 (24). However, no multicollinearity problems are detected when computing their level of tolerance (.44 and .37 respectively). Table 3. Correlations ( non-truncated sample) claims cmade. crec general original. fwd. bck selfcm selfctr. cmade. . 210. --. creceive. .166. .062. --. general. .077. .021. .389. --. original. .099. .366. .055. .194. fwd lag. –.031 –.120. .239. .259 –.030. bck lag. –.023. selfctm. .018* –.021 –.004* –.051 –.088 –.045 –.193. selfctr. .062. .119. .104. inventors .004* –.004*. –.097 –.061. inv. freq. portf diversif sales. --. .067. -.043. --. .020* –.057 –.022 –.212 –.002*. -.137. --. –.056 –.060 –.025 –.148 –.028 –.052 .025. --. frequency .003*. .021. .033 –.102 –.131 –.084 –.082. .062 .096. portfolio. .013*. .074. .027. .153 .094 –.259 –.300. diversif. –.020*. .070. .006* –.085 –.097 –.092 –.021. .021 .060. –.052. .023. .014* –.055 –.064 –.068 –.024. .053 .055 –.068 .014* .298. sales. .025. .101. .012. .000. .067. .016. ---. .051. –.018*. --. .72. --. * NOT statistically significant at the 0.05 level.. (23) When we use the adjusted measures for generality and originality, these correlation coefficients drop to ρ =.035 and ρ =.136, respectively. (24) Despite their high correlation, we include both of them as regressors. Otherwise, all the effect is captured by one of them and the interpretation of results may be misleading..
(20) 17. 4.2. Empirical Results We log transform the independent variables in order to reduce their skewness (25). We present random effects probit models on a patent’s sleeping likelihood (26). In Table 4, we present results in the form of marginal effects at the median (27) for the set of 86 firms. Table 4. Probit Random Effects, Marginal effects at the Median Variables Importance Citations received Strategic fit Self citations received Inventors Frequency Scope Claims. Model 1. Model 2. Model 3. Model 4. .0016 (.0045). –.0013 (.0082). –.0003 (.0133). 9.07e-06 (.0134). .0235*** (.007) .0068 (.0045). –.0038 (.0213) .0355*** (.0113) .0202**(***) (.0085). .0441 (.0425) –.0411 (.0194) .0212** (.0086). .0398 (.0429) .0564*** (.0511). .0086* (.005). .014** (.014) .0184 (.0294). .0225*(**) (.0122) .0641(*) (.0418). .0223*(**) (.0123) .0674(*) (.0423). .0090 (.0057). –.0006 (.0049). –.0188** (.0096) .0713** (.032) .0149 (.396) .0172* (.0102) –.0406 (.2756). –.0277*(**) (.0089) .0721* (.0438) .07582*(**) (.0438) .0202 (.0183) –.0838* (.05225). –.0693**(***) (.0291) .0708(*) (.0439) .0748*(**) (.0438) .0210 (.0185) –.0834(*) (.05254). –.0298**(***) (.0123) .0357* (.0201). .0451*(**) (.0237). .0245** (.0107). Generality Innovativeness Cmade Originality Forward Backward Self citations made Interactions Inventors x Cmade Firm invariant Portfolio Controls Technological category Application year Constant Rho N Groups Wald χ2 – test. Model 5. –.0229 (.0239). .014 (.0088) –.0682*** (.0251). –.0262*** (.0049). –.0285*** (.0077). –.0408*** (.0125). –.0429*** (.0129). –.0253*** (.0052). Included*** Included Included .2801*** (.0218) 11066 84 40.33***. Included** Included Included .3051*** (.0268) 7879 83 189.18***. Included* Included Included .3210*** (.0326) 5871 82 160.19***. Included* Included Included .3253*** (.0321) 5871 82 163.45***. Included** Included Included .3052*** (.022) 9727 84 199.65***. Standard errors in parentheses. Confidence level of the marginal effect at 1%***, 5%**, 10%*. In parentheses, the confidence level of the coefficients if it differs from the confidence level of the marginal effect.. (25) In order not to lose observations with a zero value when taking logarithms, we add one to the original variable before doing the transformation. (26) We also performed fixed effects models. Results are basically the same, except for the non-inclusion of the firm invariant variables and the non-significance of the claims variable. This fact may suggest that the decision on the number of claims used to describe an invention in a patent is strongly firm-dependent. Results do change when we use robust probit models (without controlling for firm effects). (27) Note that the marginal effect is computed at the median of the log transformed variable. However, given that we compute it at the median, we can easily find the original value it corresponds to (i.e. the median of the original variable)..
(21) 18. Model 1 includes one proxy for each of the four magnitudes of the patented invention we are interested in: scope, importance, innovativeness and strategic fit. In particular, we introduce the raw variables that are known from a granted patent: the number of claims describing the invention, the citations received, the citations made and the number of inventors. Overall, the model is significant. The proportion of the total error variance accounted for by the random effects is significant (rho=.28, p<.000). Claims and inventors display significant positive coefficients on the patent sleeping likelihood. The magnitude of the effect of claims is reflected by the .85% increase in the sleeping likelihood when it increases by 1% from its median (Md = 11), with the rest of the variables constant at their median. The sign of this variable suggests that the effect of scope on the sleeping likelihood is actually positive. Similarly, the sleeping likelihood increases by 2.35% when the number of inventors increases by 1% from its median (Md = 2). Contrary to the prediction, this result suggests that the more inventors have been involved in a project and, therefore, the more strategic the patent, the more likely that the patent will end up sleeping. This striking result may be due to high research intensity in the firm’s core areas, which is likely to result in a high likelihood of project rejection, even if the project actually fits with the firm’s strategy. The proxy for importance, citations received, has a different sign from predicted, but is non-significant. Citations made displays the predicted negative sign as a proxy for innovativeness, but its coefficient is not statistically significant. Citations received displays an unpredicted negative sign, but its magnitude is almost nil (28). The firm-invariant portfolio variable has a negative coefficient significant at a 1% significance level, suggesting that the larger the firm’s portfolio and, therefore, the greater its bargaining power in licensing deals, the less likely it is to have sleeping patents. In particular, there is a 2.6% decrease in the sleeping likelihood when the patent portfolio increases 1% from its median (Md=3490). Model 2 adds all the constructed variables, i.e. those built on some of the raw variables. In particular, we include the (unadjusted) originality and generality measures, the percentage of self-citations and the citation lags, all of them derived from citations. The overall model is significant, as also is the proportion of the variance of the error accounted for by the random effect (rho=.305, p<.000), which increases with respect to the previous model (29). Three dimensions of the innovation appear to have a significant effect on the sleeping likelihood. First, the strategic fit of the invention shows up as a significant dimension, as reflected by the positive and significant coefficient on inventors. In fact, the increase in the sleeping likelihood is higher than in the previous model (an increase of 3.55% if it increases 1% from the median). Patent class frequency also displays a positive sign, but is only significant at a 13% level. Self-citations received is not significant but displays the predicted positive sign. The evidence, therefore, is inconclusive. However, it suggests that, contrary to predictions, the strategic fit dimension has a negative effect on the sleeping likelihood. Second, patent scope appears also as having a positively significant effect on the patent sleeping likelihood. Both claims and generality display a positive sign, even though only the former is significant (a 1.4% increase in the sleeping likelihood if claims increases by 1% from the median, Md=12). Therefore, the larger the space a patent covers, the greater the likelihood that the patent (or some of its applications) is (are) actually sleeping, instead of (28) An alternative specification with standardized citations received displays basically the same results. (29) We have to be careful when comparing results from this model with results from previous or subsequent models, since the analysis in this case is performed with a reduced set of patents, namely, the patents that have at least one citation made and one citation received. The reason lies in the fact that when we introduce citations derived variables in the analysis, some of them take missing values when citations made or received are equal to zero. These observations are then not included in the regression, having as a result a sample truncated at citations made and citations received equal to zero –note that citations are independent variables-..
(22) 19. a higher likelihood of being used. Third, the more innovative the invention, the higher the sleeping likelihood, as predicted. All the variables that proxy for this dimension have the predicted sign except backward lag, which is significantly negative at a 10% level. The negative effect of citations made becomes significant (30) (a 1% increase from Md=6 decreases the sleeping likelihood by 1.89%). Originality is the other significant variable; when it increases by 1% from its median value (Md=.5), it increases the sleeping likelihood by 7.13%. Therefore, the more radical the patented innovation is considered, the more likely it is to remain on the firm’s shelves. Citations received, as a proxy for importance, has a nonsignificant negative coefficient, but the effect is very close to zero. This result suggests that sleeping patents are not significantly less important than non-sleeping patents. On the other hand, the effect on the sleeping likelihood of the portfolio variable remains negative and significant. In Model 3 we replicate Model 2 with the originality and generality measures adjusted by the number of citations made and received, respectively. As mentioned in section 3.3.2., these adjustments correct for a downward bias in the measures as originally computed. However, they introduce another kind of bias in the regression: the sample is truncated at citations made or received equal to one (31). Results do change somewhat from the previous model. In this model, we find more conclusive evidence of the positive effect of the strategic fit dimension on the sleeping likelihood. The effect of inventors remains positive and significant, but it is stronger (a 1% increase in the number of inventors from its median increases the sleeping likelihood by 5.6%). The effect of frequency becomes significant and is non-negligible (a 2% increase in the sleeping likelihood for a 1% increase from its median, Md=.28). Self-citations received becomes positive, as predicted, but remains non-significant. Second, with respect to the scope dimension, claims is still positive and significant, but its effect is stronger, too (a 2.25% increase in the sleeping likelihood). The positive effect of generality on the sleeping likelihood becomes significant at a 10% significance level (even though the marginal effect is not significant in itself) and its effect is quite strong (a 6.4% increase in the sleeping likelihood when adjusted originality increases by 1% from its median, Md=.67). Third, along the innovativeness dimension, some changes are worth mentioning. Citations made (32) and originality remain significant and the effect of their coefficient is similar in dimension. Backward lag is no longer significant but maintains its contrary-to-predicted sign. Instead, the positive effect of forward lag becomes significant and quite strong (a 7.6% increase in the sleeping likelihood for a 1% increase from its Md=4.8). Self-citations made also becomes significant, with the strongest marginal effect of all the variables (8.4% decrease, Md=.11). The evidence of the positive effect on the sleeping likelihood of the innovative dimension is quite conclusive. However, many of these changes in the significance of the variables seems to be due to the sample truncation and not to the inclusion of the adjusted variables on originality and generality (33). Model 4 introduces the effect of interactions. In particular, we test the effect of the interaction between inventors and citations made (34), that is, between strategic fit and (30) Citations made becomes significant when we include the originality variable. (31) This is due to the adjustment made to these variables, which consists on multiplying the original variables by (citations/(citations-1)). Therefore, these adjusted measures take missing values when citations are equal to one. Consequently, the sample considered for the analysis with adjusted measures is truncated at one. (32) In this case, citations made becomes significant only when we control for originality, self-citations made and backward lag. (33) When we run Model 2 with the sample used in Model 3, i.e. a truncated sample at citations equal to one, we find the coefficients on frequency, forward lag (but not backward) and self-citations made significant, as we find with Model 3. The magnitude of the coefficients is more similar to the one in Model 3. (34) The rest of interactions display no significant effect when using the sample truncated at citations equal to one..
(23) 20. innovativeness. The inclusion of this interaction makes the inventors variable no longer significant. Citations made remains negative and significant. The interaction between the two displays a positive and significant coefficient. This means that a more innovative patent is more likely to remain shelved the lower its fit with the firm’s strategy. In contrast, a patent with a higher fit is more likely to be left sleeping the less innovative it is (35). These results suggest some very interesting conclusions about the rejection of projects by established firms. Specifically, firms are more likely to reject more innovative projects in strategically remote areas and to reject less innovative projects in strategically closer areas. The rest of the results remain basically the same. Model 5 predicts the likelihood of a sleeping patent taking into account only the information known at application date, that is, all the variables to do with the number of citations made as well as the number of inventors (36). Results differ slightly from previous specifications. The main difference is that claims, the proxy for scope, is positive but only significant at a 10.7% confidence level. Citations made, originality and self-citations made, which account for radicalness, remain significant and suggest the positive effect that this dimension has on the sleeping likelihood. The interaction of citations made and inventors remains positive and significant. The firm’s portfolio also remains positive and significant and with a similar magnitude than in previous models. These results suggest that with only the information available at grant date we are able to detect which invention dimensions affect the sleeping likelihood, except for scope. 4.2.1. Some more results In this section, we include two other firm-invariant characteristics that we believe may capture some of the firm effects considered unobserved in previous models and captured by the rho. In particular, we are interested in testing whether measures such as diversification or size change the results. However, these data are available for only a very reduced set of patentholders, namely 22 firms (37). Results are reported in Table 5. Results are very similar and divergences are due mainly to the restriction in the sample.. (35) Note that the effect of inventors is given by the sum of the coefficients on inventors and on the interaction. Even though the first coefficient is negative, the overall effect is positive, because the effect of the interaction is always positive –the sample is restricted to patents with more than one citation- and greater than the negative coefficient on inventors. (36) The specification reported as Model 5 includes the originality measure adjusted. Results do not change significantly in the alternative specification including the non-adjusted measure. (37) Four of these 22 firms have a proportion of observations coded with Y=1 lower than 1% and are eliminated from the analysis. However, results basically do not change when included..
(24) 21. Table 5. Probit Random Effects, Marginal effects at the Median. Sample big US firms Variables Importance Citations received. Model 0. Strategic fit Self citations received Inventors Frequency Scope Claims. Model 1. Model 2. Model 3. Model 4. –.0032 (.0058). –.009 (.0066). –.0100 (.0128). –.0096 (.0126). –.0428 (.0327) (.0402) .0357*** .0465*** (.0107) (.0166) .0185** .0264**(***) (.0081) (.0115). –.0017 (.0395) .0423**(***) (.0204) 267**(***) (.0116). –.0058. .0077 (.0069) .0082 (.043). Generality Innovativeness Cmade. –.0065 (.0067). Originality Forward Backward Self citations made. .0145 (.0103) .0208 (.0396). .016 (.0126) .0217 (.0389). Diversification Sales Controls Technological category Application year Constant Rho N Groups Wald _2 – test. –.0331 (.0494). .0322*** (.0095). .0157 (.0125). .0077 (.0065). –.0334** –.0369**(***) –.0628**(***) –.0162** (.0146) (.0187) (.0299) (.0079) .0795*(**) .0809 (*) .0799(*) .0176 (.0463) (.0433) (.0502) (.0232) .0369 .0622 (*) .0604(*) (.0293) (.0466) (.0458) .0219 .0272 .0270 .019* (.0157) (.0202) (.0198) (.0102) –.068* –.0545 –.0058 –.0557*** (.0402) (.0402) (.0395) (.0256). Interactions Inventors x Citations made Firm invariant Portfolio. Model 5. .0324(*) (.0222) –.052** –.0398*** (.00899) (.0106) .1494*** .1162*** (.0201) (.026) –.001* –.0016** (.0006) (.0000) Included * Included Included ** .1947*** (.0279) 6493 18 241.9 ***. Included * Included Included .1176** * (.0184) 6053 18 146.6***. –.0594*** (.0176) .1978 (.0507) –0021*** (.001). –.0832*** (.0293) .2730*** (.0891) –.0010 (.0000). –.0815*** (.0290) .2708*** (.0899) –.0011 (.0011). –.0427*** (.0097) .1333*** (.0241) –.0008 (.0006). Included ** Included Included .1729*** (.0304) 4569 18 174.8***. Included * Included Included ** .2652*** (.0495) 4620 18 133.07 ***. Included * Included Included * .2677*** (.0497) 3568 18 189.34***. Included * Included Included .1685*** (.0244) 5534 18 188.07***. Standard errors in parentheses. Confidence level of the marginal effect at 1%***, 5%**, 10%*. In parentheses, the confidence level of the coefficients if it differs from the confidence level of the marginal effect.. Model 0 includes only this new set of firm-invariant characteristics. Overall, the model is significant. We can observe that rho drops to quite low levels (rho=.114), but it is still significant. The variables capturing firm characteristics all display significant coefficients. The effect of portfolio remains negative, suggesting that, all the other firm characteristics equal, a firm with more patents in its portfolio is less likely to shelve patents. The reported marginal effect shows that the probability of a sleeping patent decreases by .043% when the firm’s portfolio increases by 1% above the median (Md=5192 patents). The effect of sales on the sleeping likelihood is positive. This finding may support the idea that bigger firms are not proactive in intellectual property management, whether because of organizational inertia, because of expected negative profitability, or for other reasons. The.
Figure

+2

Related documents
However, considering the environmental and social management framework that can be applied to the project, considering that all of the project’s environmental impacts are definitely
Once the company launched its business activities in the City of Lublin it was given support by the Strategy and Investor Service Department, the City Hall, which also offered
The fieldbus address is entered in the CPU & Power Module with the help of the display and the <up> and <down> keys.. 8.2.1 Display and
62 : University of Iowa, Iowa City IA, United States of America 63 : Department of Physics and Astronomy, Iowa State University,. Ames IA, United States
Korea Existing Chemicals Inventory (KECI) Not in compliance with inventory Philippines The Toxic Substances and Hazardous and Nuclear Waste. Control Act Not in compliance
The current guidelines for the treatment of oral mucositis suggest that compounded magic mouthwashes (with various combinations of viscous lidocaine, benzocaine, milk of magnesia,
FOCUS AREAS: Logical data warehouse; data integration and quality; enterprise information management; information architecture?. FOCUS AREAS: Data warehouse and integration;
Module Applied Information Science (I4) Course name Facebook Research Offered summer term 2015. Course form self-study course (seminar) / Module I3 (Informetrics) or I4
