Chapter 4
Tax, price and aggregate demand
for tobacco products
Introduction
Ever since the detrimental health impact of tobacco smoking was scientifically established in the 1950s and 1960s, the medical and public health community has called for interventions aimed at reducing smoking. This call was particularly strong in the United States, the United Kingdom, Canada, Australia and New Zealand, and these countries have implemented strong and effective tobacco control strategies. In the 1960s and 1970s, tobacco control strategy was driven
primarily by the dissemination
of information. In the 1980s and especially the 1990s the strategy became far more comprehensive, incorporating restrictions on public smoking, restrictions on advertising, legal challenges to the industry, and focused tax increases. Most other developed countries have subsequently implemented similar strategies, with the result that per- capita tobacco consumption in the developed world has been decreasing since the early 1980s (Gajalakshmi et al., 2000). Tobacco use in low- and middle-income countries has lagged tobacco use in high-income countries, although there has been a strong increase in tobacco use in the past half century. As a result, low- and middle-income countries have lagged developed countries in
tobacco control, but since the early 1990s several developing countries, among them Bangladesh, Brazil, India, Poland, South Africa and Thailand, have implemented effective tobacco control strategies (De Beyer and Waverley Brigden, 2003).
Of the tobacco control
interventions that are available, some (e.g. health warnings, restrictions on tar and nicotine content) have limited economic content, and as such, economists have little to say about these interventions. Other interventions (e.g. restrictions on smoking in hospitality establishments, advertising bans and restrictions of sales to minors) have definite
economic consequences (for
example, the alleged loss of revenue suffered by the hospitality industry after the imposition of clean indoor air legislation), but in the popular debate, the focus is usually on the non- economic aspects, such as freedom of choice and freedom of expression. The focus of this Handbook is not on these tobacco control interventions, thus they are not discussed further.
The primary theme of this book is that increases in the price of cigarettes are particularly effective in reducing the demand for cigarettes. This chapter provides a theoretical framework used in other chapters and reviews the literature that considers
demand studies that are estimated with aggregate data. Aggregate data is constructed by, in principle, adding the relevant data of individuals for the relevant variables (such as consumption, income and advertising expenditure). Typically aggregate data are produced by government agencies. A common theme in all these studies is that cigarette prices are a crucial determinant of the demand for cigarettes. The price elasticity of demand is typically the metric of interest. The more price- elastic the demand, the more effective is a cigarette price increase in reducing cigarette consumption. The relevant policy variable is the excise tax;; by increasing the excise tax, the government can raise the retail price of cigarettes. The policy implications of knowing the price elasticity of demand are: (1) it allows one to predict the likely decrease in consumption if the price of cigarettes were to increase by a certain percentage, and (2) it allows one to estimate the fiscal impact of a change in the excise tax on cigarettes.
The empirical literature on the demand for cigarettes is sizeable, and has several different focus points. In particular, in the past two decades there has been an explosion in the number of studies that are based on individual- or household-level data. These studies
are discussed in Chapters 5 and 6. The current chapter is limited to a review of studies based on aggregate data only. This literature grew rapidly before the 1990s, but has largely been eclipsed by studies based on micro-level data since then. In this chapter studies are categorized by geographical area: (1) the United States, (2) other developed countries and (3) developing countries. The rationale for this categorization is that studies from each of these geographic regions have tended to focus on different themes in the tobacco control literature.
The structure of the chapter is as follows. The theoretical framework underlying the demand for tobacco is considered in the first section. The following section provides a short overview of the econometric strategies that have been used to estimate the demand for tobacco using aggregate data. Next the relevant empirical literature is reviewed, focusing especially on price and income elasticities of demand. The chapter then concludes with a consideration of the issue of affordability and how this influences the demand for cigarettes.
Theoretical frameworks for the demand for tobacco
The negative relationship between the price of a product and the quantity demanded is a fundamental concept in economics. This relationship, the law of demand, applies not only for goods and services, but also to factors of production, in both micro and macro contexts. For example, within a microeconomic context, an increase in the price of a product decreases the quantity demanded of that product, if all other factors are held constant. Similarly, within a macroeconomic context, an appreciation of the
currency (effectively making imported products more expensive) decreases aggregate imports.
The law of demand is derived from a constrained utility maximizing
framework. Given consumers’
preferences, which are presented by the utility function, the imposition of a budget constraint allows one to derive the demand function for a product, where the quantity demanded is a negative function of the price of that product. Empirically the interesting aspect is typically not whether the negative relationship between price and quantity demanded exists, but rather how responsive the quantity demanded is to changes in the price. This responsiveness is captured in the price elasticity of demand. The price elasticity of demand, which is a number without units, indicates by what percentage the quantity demanded changes in response to a 1% change in the price.
The relationship between
cigarette price and consumption has opened up a lively methodological debate. One major source of contention is the theoretical modelling of addictive products, since the assumptions underlying the models
employed have fundamentally
different implications for the optimal tax level (Guhl and Hughes, 2006).
Modelling tobacco consumption
based on economic models of choice has undergone continuous evolution in response to expanding knowledge and insights into addictive behaviour. Initially the demand for tobacco was modelled with a contemporaneous specification. This means that current demand is specified as a function of current prices and current values of all other explanatory variables. Addictive behaviour was initially modelled through backward-looking “myopic” demand models, meaning that previous consumption (or the previous period’s prices) influences current
consumption. As an improvement on backward-looking demand models, forward-looking rational addiction models arose in the late 1980s. These were subsequently revised, at least on a theoretical level, by models of addictive behaviour that assumed that smokers were subject to time- inconsistent behaviour. This section describes this progression.
Underlying conventional demand models is the assumption that consumers are fully rational and sovereign in their decision-making. As such, they are the best judges of their own behaviour and on what goods and services to spend their money. Within this conventional framework tobacco is considered a good like any other good. A chosen behaviour is a priori assumed optimal because a person has rationally chosen it and the government has no reason, in the absence of market failures, to interfere with this revealed preference.
However, if a product is addictive,
the assumption of consumer
sovereignty applies no more. The addictiveness of the product “forces” a consumer to buy a product that she might not have bought had she not been addicted to it. Some early theorists have postulated that, given the addictive nature of nicotine, it was not conducive to standard economic analysis (Chaloupka, 1991). It also implies that the demand for tobacco products does not respond to changes in the price, and is thus perfectly price-inelastic (U.S. Department of Health and Human Services, 2000). If this view were true, it would imply that increases in the excise tax would be impotent as a measure to reduce
tobacco consumption. However,
as will be clear from this and other chapters in this book, this view does not have any empirical support.
Before the 1990s, empirical
studies that investigated the
were, in terms of their theoretical specification, not much different from studies that investigated the demand for other consumer products. Broadly speaking, tobacco consumption was specified as a function of the price of the tobacco product in question, an income variable, the prices of substitutes and complements, an advertising variable, and often some dummy variables aimed at capturing the impact of anti-tobacco measures. In some cases a lagged dependent variable was included in the regression equation to capture “habit persistence.” Other than improving the statistical fit of the regression equation, it also allowed one to differentiate between short- run and long-run price elasticities of demand, as will be pointed out in the next section.
Empirical tobacco demand
analyses in the past two decades have largely been underpinned by the rational addiction framework formally introduced by Gary Becker and Kevin Murphy in 1988. The model of rational addiction has become the standard approach to modelling the consumption of addictive goods. It has been applied to coffee (Olekalns and Bardsley, 1996), alcohol (Waters and Sloan, 1995;; Grossman et al., 1998) and tobacco (Chaloupka, 1991;; Becker et al., 1994). The essence of the rational addiction model is that people with stable preferences may rationally decide to engage in an addictive behaviour since this maximizes their lifetime utility (Becker and Murphy, 1988).
Becker and Murphy distinguish between myopic and rational addiction. A myopically addicted person’s current consumption is determined by his/her past consumption. However, such a person does not consider the future in determining current consumption. As such, the future is discounted at an infinitely high rate.
A rationally addicted person’s current consumption, on the other hand, is determined not only by past consumption (which in turn is determined by past prices), but also by future prices. For instance, if consumers of addictive goods predict that the price of the product will increase in future, that knowledge will cause his/her consumption in the current period to decrease.
Importantly, the full price of the product includes not only the monetary price of the product, but also the negative health effects and the legal sanctions associated with consumption. For example, the full price of drugs includes the fines, prison sentences and increased mortality associated with drug use, over and above the purchase price of the drugs. Similarly, for alcohol, the full price includes the increased risk of accidents, domestic violence and increased morbidity and mortality, while for tobacco, the full price includes social disapproval, increased morbidity and premature death, over and above the prices paid for these products. As an illustration, Becker and Murphy (1988) argue that the US Surgeon General’s report published in January 1964 (U.S. Department of Health Education and Welfare, 1964) greatly increased the full price of tobacco smoking. Between 1964 and 1975 per-capita cigarette consumption in the US decreased by 34%. Becker and Murphy argue that this large decrease in consumption is consistent with rational (i.e.
forward-looking) behaviour, and
inconsistent with myopic behaviour. If smokers were myopic they would not respond to information about future consequences of their activities.
The rational addiction framework provides a theoretical model to describe three important concepts in the addiction literature, namely
tolerance, reinforcement and
withdrawal (Chaloupka, 1991).
Tolerance implies that a given quantity of current consumption yields less additional satisfaction as the cumulative past consumption of the product increases. This implies that, to obtain the same amount of additional satisfaction, consumers would have to consume increasingly larger quantities of the product. Reinforcement means that current consumption of the product increases future consumption, and that past
consumption increases current
consumption. Stated differently,
the more one consumes, the more one wants to consume. Withdrawal means that the smoker’s total utility/satisfaction falls if cigarette consumption is reduced.
Furthermore, Becker and
Murphy (1988) show that the rational addiction model can explain the observation that heavily addicted smokers often quit their consumption abruptly, i.e. “cold turkey.” The explanation lies in the fact that if the addiction is strong, reinforcement in consumption is larger than had the addiction been weak. As the level of reinforcement increases, so does the degree of (adjacent) complementarity between current and future consumption. A person who wishes to reduce consumption slowly would be incurring a loss of utility over a long time period. On the other hand, by quitting abruptly, the consumer incurs a large immediate loss of utility, but this utility loss is smaller than the utility losses that would have been incurred had the quitting period been extended over a period of time.
Becker and Murphy (1988) point out some important interactions
between time preference and
addiction. First, people who discount the future more heavily are more likely to become addicted. Second, addicts with higher discount rates
will be relatively more responsive to changes in the price than those with lower discount rates. They tend to be more affected by short-term shocks, e.g. current cigarette price increases, than by long-term implications of smoking, e.g. detrimental health consequences in middle and old age. These two theoretical results explain why young and poor people are more likely to initiate smoking than older and richer people and typically have higher price elasticities of demand, as indicated in Chapters 6 and 7. Third, the long-run price elasticity of demand will be greater, in absolute terms, than the short-run price elasticity. Fourthly, the impact of an expected change in the price of the addictive good will be greater than the impact of an unanticipated price change.
The Becker-Murphy model has been empirically tested in a variety of contexts, using both aggregate data and cross-sectional data, and generally the studies find support for the hypothesis of rational addiction. These studies are discussed in later in this chapter and in Chapter 5. While studies differ in the econometric detail, the contribution of the Becker- Murphy approach lies in the fact that forward-looking behaviour is explicitly modelled into the demand equations.
However, the rational addiction framework has been severely criticized from some quarters. For many addiction researchers the
concept of rational addiction is
oxymoronic. Why would a person pursue an activity that he/she becomes addicted to? Becker and Murphy answer this question as follows. First, the model applies to a large range of human activities and endeavours. People become addicted to different things, some of which are not necessarily bad. For instance, Becker and Murphy point out that people can be addicted
to “good” things like work, music, television, religion, other people, etc. Second, the model assumes that people recognize the addictive nature of the products they choose to consume, but they may still make them because the gains of consuming the product exceed the cost of future addiction. The model does not suggest that if an addict is rational, he/she is “happy.” In fact, in real life addicts are often unhappy and depressed. Sometimes the addiction results from anxiety-raising and depressing events like death or divorce, which lowers their utility. Becker and Murphy (1988) argue that their model recognizes that people become addicted precisely because they are unhappy. However, they would be even unhappier if they were prevented from consuming the addictive goods.
The most criticized aspect of the rational addiction model is the assumption of perfect foresight (Chaloupka and Warner, 1999). The model assumes that people rationally decide that they will maximize their discounted lifetime utility by consuming an addictive product. According to Akerlof (Chaloupka et al., 2000a), the rational addiction model does not allow the possibility that people regret that they ever started smoking, given that they are assumed to be fully aware of the consequences of their consumption of a potentially addictive good when making these decisions. This is unrealistic, because surveys have shown that most smokers indicate that they want to quit and regret that they started smoking (Gruber and Köszegi, 2001). Similarly, numerous studies find that individuals do not have sufficient knowledge on which to base their consumption decisions (Guhl and Hughes, 2006). Chaloupka and Warner (1999), for example, observe that adolescents often
underestimate the addictive nature of smoking.
Auld and Grootendorst (2002) attack the rational addiction model on a different level. While the rational addiction model has been successfully applied to several obviously addictive products (Grossman et al., 1998;; Auld and Grootendorst, 2002), presumably the strength of the theory should lie in the fact that it would find that people are not addicted to things that clearly are not addictive. Auld and Grootendorst (2002) found that the standard methodology is generally biased in the direction of rational addiction. Using aggregate time series data, they found that milk, eggs and oranges were rationally addictive, and, specifically, that milk was more addictive than cigarettes. This result implied that the estimable rational addiction model tends to yield spurious evidence in favour of the rational addiction hypothesis when aggregate data are used.
The rational addiction framework assumes that consumers discount the future at an exponentially declining discount factor d(t) =
įW ZKHUH į 7KH GLVFRXQW IDFWRU į LV RIWHQ H[SUHVVHG DV
(1+r), where r is a discount rate.
Exponential discounting implies
that consumers are time-consistent, i.e. have stable preferences. Any discounting is premised on the idea that people are impatient;; they place a higher value on a unit of consumption today and demand compensation to defer consumption until tomorrow. In 2001 Gruber and Kozsegi added to both the theoretical and empirical debate by arguing that consumer preferences may not be stable over time. Preferences are time-inconsistent if a person, when asked on different occasions, displays different relative preferences. Camerer and Loewenstein (2002)
preferences, one mathematical form of time-inconsistent discounting, as follows:
“Hyperbolic time discounting implies that people will make relatively far-sighted decisions when planning in advance— when all costs and benefits will occur in the future—but will make relatively short-
sighted decisions when
some costs or benefits are immediate. The systematic
changes in decisions
produced by hyperbolic time discounting create a time- inconsistency in intertemporal choice not present in the
exponential model. An
agent who discounts utilities exponentially would, if faced with the same choice and the same information, make the same decision prospectively as he would when the time for a decision actually arrives. In contrast, somebody with time-inconsistent hyperbolic
discounting will wish
prospectively that in the future he will take far-sighted actions;; but when the future arrives he will behave against his earlier wishes, pursuing immediate gratification rather than long- run well-being.”
If a person discounts the future at a hyperbolic rather than an exponential rate, time-inconsistent preferences are a likely outcome. Results from laboratory experiments and psychological research suggest that consumers are time-inconsistent and exhibit self-control problems (Gruber and Köszegi, 2002). Self- control problems are introduced into economic models through the idea of a competing internal self, where an individual’s preferences change at different times with a view to improving the current self’s
welfare, sometimes at the expense of the future self’s (O’Donoghue and Rabin, 2003). Most people exhibit present-biased preferences;; they have a tendency to pursue immediate gratification in a way that they themselves may disapprove of in the long run. For instance, a smoker might indicate that he wishes to quit, but only in a year’s time. In this scenario the future self makes the decision. However, if one were to ask him in a year’s time whether he has quit smoking, the typical answer would be “no.” Despite the commitment of a year earlier, the current self dominates the decision. The large time delay between exposure and disease makes smokers particularly prone to this phenomenon, since the health consequences of their current actions are only realized at a future date (Jha et al., 2000). This type of time-inconsistency, which describes smoking as an outcome of “multiple selves”, strongly accords with common sense and conventional wisdom (O’Donoghue and Rabin, 2003). Many smokers want to quit smoking, but the immediate gratification from nicotine dominates the desire to quit. In this framework, cigarette consumption is more appropriately modelled based on the assumption that consumers are time-inconsistent. The existence of an “internality,” arising from the
psychological phenomenon of
hyperbolic discounting and unstable preferences, supports an argument for a cigarette tax, not only on externality grounds, but on the grounds that smoking creates “internal” costs that markets fail to correct.
If consumers exhibit present- biased preferences (i.e. the time- inconsistent model), the assumptions of rational and time-consistent behaviour (i.e. the rational addiction model) may be seriously flawed. More importantly, the optimal tax rate prescribed by each model will
differ significantly. Under the rational
addiction hypothesis, tobacco
consumption decisions are governed by the same rational decision- making process as any other good (Gruber and Mullainathan, 2002). Under this paradigm the optimal role for government is to correct for the “external costs” of smoking. Addiction per se does not constitute market failure, and the costs smokers impose on themselves are irrelevant for taxation unless they are rooted in misperceptions about the harmfulness of smoking (Guhl and Hughes, 2006). In comparison, the policy conclusion from the time-inconsistency approach is that “internality costs” should be accounted for in the same way as externality costs when setting government policy. Taxation may thus be theoretically justified even where no externalities are present (Gruber and Köszegi, 2001). As a result, time-inconsistency models generally prescribe an optimal tax level which is higher than that of the rational addiction model, since the internal costs often dwarf the external costs (Gruber and Köszegi, 2002).
The empirical strategy
Over the past decades there have been vast improvements in the techniques that are available for time series econometricians. Time series data are data that are published at regular intervals and that refer to well-defined time periods, e.g. years, quarters or months. Most of the studies discussed in this chapter consider the time series data for a particular country, and thus derive appropriate coefficients for that country. However, in a limited number of cases researchers have used a pooled set of time-series data. A pooled (or in some cases a panel) data set consists of the time series data of several countries (or regions).
Pooling data results in many more observations and more often yields statistically meaningful results. Early econometric studies that investigated the demand for tobacco and other commodities would be regarded as quite out-of-date by many applied time series econometricians today. However, since these studies were important then, and since many recent studies have not employed the most up-to-date techniques, it is worthwhile to discuss the methodology of such studies.
The typical starting point for estimating the price and income elasticities of demand is to specify a demand equation. According to standard demand theory, the quantity demanded of a product is a function of the price of the product, an income variable, the prices of substitutes and/or complements, advertising, and possibly some product specific factors. Within the context of tobacco demand studies, price and income are the most important and most commonly used variables. Earlier studies1 often included an advertising
variable in the regression equation (either advertising expenditure, some measure of the stock of advertising or some rudimentary count of the levels of advertising). Relatively few studies included the price of complementary and substitute goods in the regression equation. A notable exception is the seminal study by Chapman and Richardson (1990), who included the price of substitutes in their demand equations (leaf tobacco prices in the demand for cigarettes and cigarette prices in the demand for leaf tobacco). Similarly, Hsieh et al. (1999) included imported cigarette prices in the demand for local cigarettes and local cigarette
prices in the demand for imported cigarettes.
The mathematical form of the regression equation is important. Many studies use a log-log
specification, primarily because
this results in a constant and easily derived elasticity estimate. The price elasticity is simply the coefficient on the (logged) price variable, and similarly the income elasticity can be read off as the coefficient on the (logged) income variable. It is important to note that this
specification assumes a constant
elasticity, over time or at different points on the demand curve. Of course such a specification would not allow one to determine whether there are changes in the price elasticity over time, whether the elasticity differs for various price levels, or whether the elasticity differs for different magnitudes of price changes.
Another standard mathematical form is a linear specification. The coefficients cannot be interpreted as elasticities, but with minor effort elasticity estimates can be calculated. Usually the elasticity is calculated at the mean quantity and price (or income, if one wishes to estimate the income elasticity).2
The added advantage of the linear specification is that is allows one to estimate the elasticity at any point in time (Bardsley and Olekalns, 1999;; Van Walbeek, 2002).
In some studies the addictiveness of tobacco was modelled by including a lagged dependent variable in the regression equation. This is a standard econometric technique, based on the concept of “habit persistence” (Gujarati, 2003). If the product is addictive, it is intuitively
obvious that past consumption determines current consumption. An econometric specification that includes a lagged dependent variable has the property that one can differentiate between short-run and
ORQJUXQ SULFH HODVWLFLW\ ,I İP is the VKRUWUXQSULFHHODVWLFLW\DQGĮLVWKH
coefficient on the lagged dependent
YDULDEOH Į WKHQ WKH ORQJ UXQ SULFH HODVWLFLW\ LV HTXDO WR İP/(1- Į 7KH ORQJUXQ HODVWLFLW\ LV DOZD\V
greater (in absolute terms) than the short-run elasticity, suggesting that a current change in the price will have a greater impact on consumption in the long run than in the short run.
To test the rational addiction hypothesis, the focus is on future price or future consumption, explaining current consumption. Becker et al. (1994) tested their theoretical model using US state-level time series data. The forward-looking nature of the model made them include next-period consumption (i.e. Ct+1) LQWR WKH GHPDQG HTXDWLRQ ,I Į1 is
the coefficient on Ct-1 DQG Į2 is the
coefficient on Ct+1, then rational DGGLFWLRQ ZRXOG LPSO\ WKDW Į2 is VWDWLVWLFDOO\ VLJQLILFDQW ,I RQO\ Į1 is
significant, this would suggest that smokers are myopically addicted. Also, within this framework, the short-run elasticity is derived from the coefficient on Pt, while the long- UXQHODVWLFLW\LVHTXDOWRİPĮ1Į2).
If smokers are rationally addicted, one would find that the long-run price elasticity is greater than if smokers are myopically addicted.
In the econometric literature the potential problem of identification (i.e. distinguishing between supply and demand) has been an important issue. The price-quantity combination at any moment in time is an equilibrium point,
1 Hamilton (1972), McGuinness and Cowling (1975), Fujii (1980), Witt and Pass (1981), Bishop and Yoo (1985), Leeflang and Reuijl (1985), Radfar (1985), Abernethy and Teel (1986),
Baltagi and Levin (1986), Chetwynd et al. (1988), Kao and Tremblay (1988), Duffy (1991), Seldon and Boyd (1991), Tegene (1991), Wilcox and Vacker (1992), Valdés (1993), Duffy
(1995), Tremblay and Tremblay (1995), and Cameron (1997).
2 See Warner (1977), Warner (1981), Leeflang and Reuijl (1985), Warner (1989), Flewelling et al. (1992), Becker et al. (1994), Wilcox et al. (1994), Tremblay and Tremblay (1995), Van
i.e. the intersection of the supply and the demand curve. Any change in the equilibrium position from one period to another is the result of a change in the demand or the supply curve, or both. To identify the demand curve a systems approach is recommended. If the system meets certain criteria, one can specify both the supply and the demand curves. Very few studies follow this approach, with notable exceptions being Bishop and Yoo (1985) and Tremblay and Tremblay (1995). Bishop and Yoo (1985) point out that a single equation demand
model can provide consistent
estimates if the supply curve is either perfectly elastic or perfectly inelastic. An assumption of a perfectly inelastic supply curve, given the storability of tobacco, is unrealistic. On the assumption that the supply curve is perfectly elastic, changes in the price will trace out a demand curve. Most studies assume that the demand curve is stable in price- quantity space and that movements in the curve are a result of changes in the other demand determinants. In the absence of data on costs and other supply determinants, and given that tobacco companies often have significant market power (which results in them not having identifiable supply curves), it is little wonder that so few studies attempt to estimate supply equations.
The dependent variable is almost always the quantity of
cigarettes consumed, although
some variations have been used. The quantity consumed is typically calculated in one of two ways. The first method is to obtain, or derive, the quantity consumed from the fiscal authorities. By dividing the total excise tax revenue by the average excise tax amount per cigarette, one can calculate the quantity of cigarettes consumed. This considers the consumption of legal cigarettes
only;; counterfeit and smuggled cigarettes are not considered. If the proportion of smuggled cigarettes remains constant over time, then the price elasticity estimates and other coefficients will not be affected. However, if the proportion of smuggled cigarettes increases in response to an increase in price, the legal sales of cigarettes will understate true cigarette consumption. To the extent that this may occur, the price elasticity estimate (in absolute terms) will be biased upwards. The second
approach calculates cigarette
consumption as cigarette production, plus imports, less exports. The method of data collection could also lead to biases. Local production may be underreported (because of illicit manufacturing, for example) or imports may be underreported (through large-scale or small-scale smuggling). If such underreporting were to increase in sympathy with increases in the real price of cigarettes, the absolute value of the price elasticity estimates would be biased upwards. Essentially, consumption cannot be directly observed, and what is termed as consumption is proxied by a measure that represents tax paid production or shipments. Furthermore, timing issues may affect the composition of the series since retailers or consumers might increase purchases in response to an anticipated price increase, thereby artificially increasing consumption now and reducing consumption in some future period. This becomes more of an issue in higher-frequency data.
Cigarette prices and income enter the models as independent variables and are presented in real terms by dividing the nominal variable (or index) by an appropriate deflator (usually the consumer price index). The conversion of nominal price and nominal income to real
price and real income is critical, since the prices of almost all goods (both substitutes and complements) rise over time. The absolute change in nominal cigarette prices is not important;; what is important is by how much cigarette prices change relative to the changes in the prices of all other goods. Models using only nominal values are also likely to provide spurious results, since all both price and income are likely to trend upward over time. Real income can be presented in aggregate or per-capita terms. Some studies regress aggregate consumption on aggregate income and the real price while other studies regress per capita consumption on per-capita income and a price variable (examples). Most studies use the adult population (aged 15 or 16 and older) as the appropriate population measure with which they obtain per-capita values, although this is not a strict rule.
Other variables that have been included in demand equations revolve around policy interventions (e.g. advertising restrictions, counter advertising, smoke free policies, age restrictions, etc). The most common way to account for policy interventions is by means of dummy variables. For example, the counter-advertising that was legislated through the Fairness Doctrine in the USA in the late 1960s and early 1970s is typically captured by a variable that had a value of one in the period 1968 to 1970, and zeroes in all other years (Hamilton, 1972;; Kao & Tremblay, 1988).
The most tested interventions
are advertising bans and
restrictions. Initially the approach was to investigate the relationship between cigarette consumption and advertising expenditure (or other measures of advertising including stocks and counts), controlling for other demand determinants (Hamilton, 1972;; Fujii, 1980;; Bishop
& Yoo, 1985;; Abernethy & Teel, 1986;; Holak & Reddy, 1986;; Kao & Tremblay, 1988;; Wilcox & Vacker, 1992). The argument was that if a positive relationship between these two variables was found, a reduction in advertising expenditure would result in a reduction in tobacco consumption. This would be the empirical foundation for a ban on tobacco advertising. No consistently strong relationships were found. However, this finding was subsequently rationalised on the grounds that, since tobacco products were among the most advertised products in the world, and advertising expenditure is probably subject to decreasing returns, moderate changes in the advertising expenditure are unlikely to be picked up in substantial changes in cigarette consumption (Saffer and Chaloupka, 2000). Subsequent studies have tested the impact of advertising bans, rather than advertising expenditure, on consumption and have found that bans have typically resulted in significant declines in consumption (see the last section of this chapter for a more comprehensive discussion of this literature).
Since the early 1990s there have been significant advances in time series econometrics. This has been primarily in reaction to the long-known but largely suppressed fact that regression
on non-stationary variables
can easily result in statistically
significant but economically
meaningless relationships. Most
economic variables are non-
stationary, meaning that they tend to be subject to long-run upward or downward trends. To prevent such spurious relationships, cointegration techniques were developed. The technical details of cointegration are available in any standard econometric textbook (for example, Hamilton,
1994, Pindyck and Rubinfeld 1998, Enders, 2004). The first studies that used cointegration techniques
used the Engle-Granger two-
step procedure. Subsequently the Johansen procedure was developed, which is theoretically less restrictive than the Engle-Granger approach. In similar vein, econometric techniques that placed fewer restrictions on the data, like vector autoregression, were developed.
The uptake of the more advanced econometric techniques has been relatively slow in tobacco demand studies based on aggregate data. The primary reason seems to be a lack of data. Time series data are typically of annual, quarterly or monthly frequency, and even when the series are relatively long, the data demands of the new techniques are often such that the modern techniques are not applied. In developing countries this problem is more acute than in developed countries. In many instances the data are available only at an annual frequency, and consists of no more than 20 or 30 observations. The quality and accuracy of data in developing countries are likely to be inferior to that in developed countries. In cases where the data are limited or of dubious quality, state-of-the- art techniques will not always be possible. However, data limitations should not provide a licence for researchers to ignore modern developments in econometrics. At the very minimum, one should test for the time series properties of the data, and possibly perform the regression in first differences. The review of the literature suggests that many studies in the past two decades do not employ these econometric developments.
The proportion of tobacco demand studies that use aggregate data has been declining relative to
studies that use microeconomic or household cross sectional data. Studies that use household data are discussed and reviewed in Chapters 5 and 6. Studies based on aggregate data have some significant drawbacks. The first is the relative paucity of data. Data sets in excess of 50 time series observations are scarce (Prest, 1949;; Tegene, 1991, being important exceptions). In contrast, the number of observations in household surveys is limited only by the budget of the survey. Second, the questions one can answer with aggregate data are limited. One can estimate price and income elasticities, but one cannot, for example, estimate the impact of price or income changes on the consumption of different groups (by gender, race, income, education, etc.), or determine changes in smoking prevalence or smoking intensity. Household data sets are much richer than aggregate data sets, and are better suited to answering such questions. Third, data limitations may result in biased parameter estimates. A high degree of multicollinearity between the independent variables, a very common problem in time series data, results in large standard errors on the estimated coefficients.
Regressions may also suffer
from omitted variable bias. Some variables might be omitted because the data do not exist or because the inclusion of the data worsens the multicollinearity problem to the extent that the researchers decide to exclude variables that they regard as important. Similarly, autocorrelation in the residuals, a very common problem in time series data, results in inefficient coefficients. Having said this, studies based on household data are subject to similar and other estimation and data problems.
A more recent development has been the estimation of cross-
country (or, in the USA, cross-state) panel models, which are essentially cross sectional models based on the aggregated data of a country (or state). The first study in this genre was by Baltagi and Levin (1986), who exploited the fact that different US states had different excise tax regimes, and they could thus estimate price elasticity of demand, making appropriate adjustments for small-scale smuggling from low- tax to high-tax states. Models that are based on country data provide global estimates of price and income elasticities;; in most cases these models control for price and income effects when testing the effectiveness of advertising bans and restrictions on a global level. Earlier models were elementary and did not use fixed effects to control for cross- country differences nor the addictive nature of cigarettes (Laugesen and Meads 1991;; Stewart 1993). More recent additions to the literature have made significant improvements in methodology and estimation techniques. Saffer and Chaloupka (2000) applied country-specific fixed effects. Nelson (2003) tested the endogeneity of advertising bans, and Blecher (2008) extended the sample of countries to include a large number of developing countries.
Empirical literature
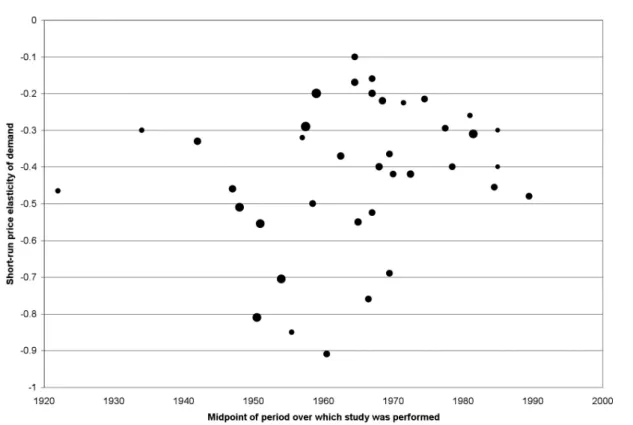
A survey of tobacco demand studies reveals that the focus of attention has changed several times in the past 60 years. In fact, several “waves” of empirical studies into the demand for tobacco can be identified.
In what could be termed the first wave, a small number of studies investigated the demand for tobacco in the 1940s to 1960s (Stone, 1945;;
Prest, 1949;; Koutsoyiannis, 1963). These studies were part of a growing literature that aimed to investigate the demand for household goods. Price and income elasticities were estimated, but the public health implications of these estimates were not discussed, presumably because the health impact of smoking was not well publicized at that time.
The focus of tobacco-related
empirical research changed
significantly in the early 1970s. During the 1970s–1990s, which could be called a second wave, researchers began to draw policy conclusions from their results. The focus in this period shifted away from the estimation of price and income elasticities to the impact of advertising and health awareness on the demand for tobacco products. In estimating the impact of advertising and health awareness on cigarette demand, price and income were included as control variables in the regression equation, but these were often not the focus of the investigation. During this period the lines between “pro- industry” research and “pro-tobacco control” research were drawn, and the debate between these two camps was vigorous and often acrimonious.
The first two waves focused exclusively on developed countries, and the empirical results were based on time series data. The third wave had its origins in 1990, when price elasticity estimates were published for Papua New Guinea, the first developing country studied (Chapman and Richardson, 1990). During the 1990s the focus gradually shifted towards developing countries. This shift in research focus was in reaction to the large increase in smoking in the developing world, and the likely impact that this would
have on mortality patterns in the 21st
century (Jha and Chaloupka, 1999). The focus in most of the developing country studies was on the price elasticity of demand.
United States of America
In terms of methodological
complexity, the USA-based studies are generally the most advanced, and have addressed issues that have not been addressed by researchers in other countries. Researchers in the US have several significant advantages over their colleagues in other countries. First, tobacco control is high on the authorities’ agendas3 and attracts large financial
resources from government and private institutions. Consider the following examples. In 2000 the 11th
World Conference on Tobacco or Health, held in Chicago, received a US$10 million sponsorship from two US health societies and a private foundation. This is more than ten times any previous World Conference.4 In 2002 the Fogarty
International Centre made US$18 million available for tobacco control research around the world. One of the requirements was that the research teams in other countries be linked to established research bodies in the US. Subsequently much larger amounts have been made available by US aid agencies, primarily for tobacco-related research in low-and middle-income countries. These studies are often anchored by US researchers. More than 40 working papers have been published by the prestigious National Bureau for Economic Research (NBER) on matters relating to the economics of tobacco control. There is a pool of researchers who specialize in
3 This is generally true for most states and particularly true for states like California and New York State. However, the tobacco-growing states like Kentucky and the Carolinas do not
have a strong tobacco control focus.
the economics of tobacco control research, unmatched in any other country. As an illustration, of the 39 authors that contributed to Tobacco Control in Developing Countries (Jha and Chaloupka, 2000), arguably the most comprehensive book on the economics of tobacco control to date, 19 were from academic and/or governmental institutions in the USA, while another eight were from the World Bank, World Health Organization or the International Monetary Fund. Of the remaining 12 authors, ten were from developed countries (especially the United Kingdom and Australia), and two were from developing countries.
Second, the existence of more than 50 states and territories, each with separate legislative, excise tax and retail pricing systems, often creates a research design environment that allows researchers to test phenomena that would have been virtually impossible to test otherwise. For example, changes in state-specific excise taxes were used to obtain quasi-experimental price elasticities of demand (Baltagi and Goel, 1987). Also, studies that employ individual-level data to determine price elasticities of demand for specific demographic groups can take advantage of the fact that there is a large degree of variation in individual states’ tobacco excise tax regimes and other tobacco control interventions.5
Third, there are some very large survey data sets that specifically
investigate smoking behaviour,
especially among the young.
Because these surveys are often
repeated year after year, changes in smoking behaviour over time can be monitored. For example, several waves of the Monitoring the Future Surveys have been used to estimate the price elasticity of demand for cigarettes among secondary school pupils, and various demographic groups within this sample (e.g. Chaloupka and Grossman, 1996;; Chaloupka and Pacula, 1998). These studies are discussed in detail in Chapters 5 and 6.
As indicated in the discussion
of econometric strategies, the
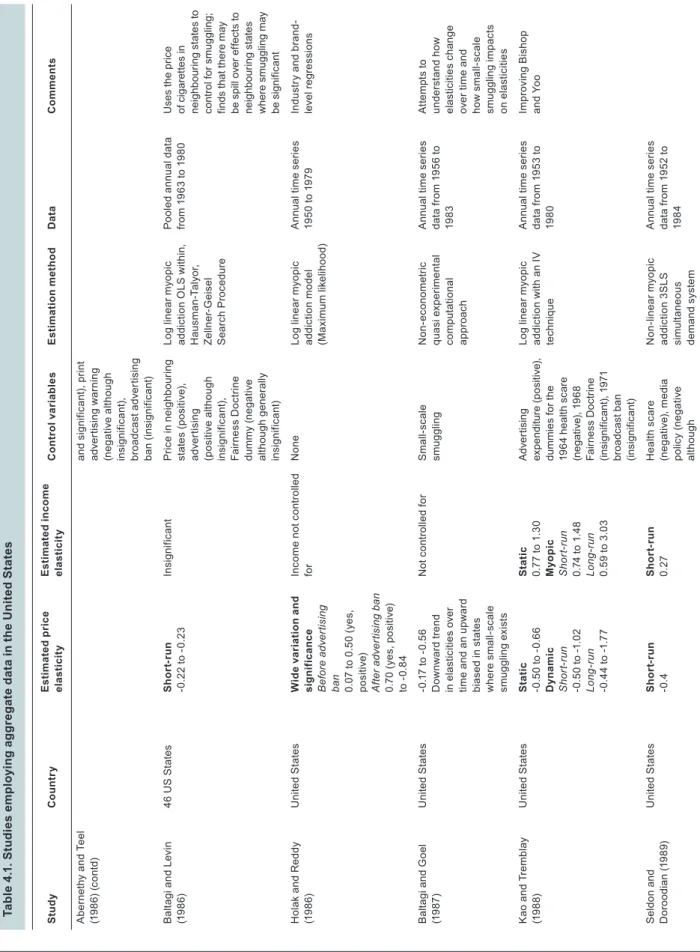
demand for cigarettes is typically specified as a function of price, income and some tobacco control interventions. For most US studies, the prime focus of the study is on the impact of cigarette prices on quantity consumed. However, some studies focused primarily on the effect of a non-price determinant of the demand for cigarettes (such as advertising, health publicity or other tobacco control interventions), and in such cases the price would enter the regression equation as a control variable. Table 4.1 is a comprehensive chronological summary of studies of cigarette demand in the US using aggregate data studies. The studies differed in many respects, including: (1) the frequency of data,6 (2) the use
of econometric or non-econometric estimation techniques,7 (3) the use
of single equation versus multiple equation regression techniques, and (4) the use of national or state-specific data.8
While the techniques for estimating the demand equations are similar enough to not list all the US studies
5 For example, see Chaloupka and Wechsler (1997), Chaloupka and Pacula (1998), Tauras and Chaloupka (1999), and Tauras et al., (2001). These studies are dealt with separately
in Chapters 5 and 6.
6 Most studies made use of annual data. Flewelling et al. (1992), Wilcox and Vacker (1992), Duffy (1995) and Hu et al. (1995a) use quarterly data, while Keeler et al. (1993), Hu et al.
(1994 and 1995b) and Gruber and Köszegi (2001) use monthly data.
7 Studies that have estimated price elasticities without using econometric techniques include Baltagi and Goel (1987) and Peterson et al. (1992). In these studies the researchers
assessed the magnitude of changes in cigarette consumption following state-specific cigarette tax increases.
8 Of all US states, California (closely followed by New York) has the most stringent tobacco control legislation. Published studies that have investigated the impact of tobacco control
interventions on the demand for cigarettes in California include Flewelling et al. (1992), and Hu et al. (1994 and 1995b). Most US studies that investigate the demand for cigarettes
focus on the country as a whole. Some studies take cognizance of differences in taxes between states and try to account for the small- and large-scale smuggling between low-tax and high-tax states (Baltagi and Levin, 1986, Baltagi and Goel, 1987 and Thursby and Thursby, 2000).
in this chapter, some seminal articles, as well as those that are in some way unique, are briefly discussed here.
Warner (1977) estimated the impact of various health scares and other high-profile anti-smoking publicity campaigns on the demand for cigarettes. In his study he did not estimate the price elasticity of demand, but included the impact of price into the regression model by assuming that the demand curve was linear in price-quantity space and that the price elasticity of demand was the mean price and quantity for the period (1947–70) being studied. Imposing a price elasticity onto the regression equation, rather than allowing the data to estimate the price elasticity, was rationalised on the grounds that including price in the regression equation would result in unacceptable levels of multicollinearity. Based on this analysis, Warner concluded that the various anti-smoking campaigns resulted in a significant decrease in smoking. In fact, he suggests that per capita consumption of cigarettes would have been 20–30% higher in 1975 had it not been for the success of the anti-smoking campaign. What is interesting about this study is that changes in the excise tax on cigarettes were not presented as a particularly effective tobacco control instrument. The focus was on anti-tobacco publicity, and excise- induced changes in the retail price appear to have entered the analysis as somewhat of an afterthought.