Water Desalination across Nanoporous Graphene
David Cohen-Tanugi and Jeffrey C. Grossman
*
Department of Materials Science and Engineering, Massachusetts Institute of Technology, Cambridge, Massachusetts 02139, United States
*
S Supporting InformationABSTRACT: We show that nanometer-scale pores in single-layer freestanding graphene can effectively filter NaCl salt from water. Using classical molecular dynamics, we report the desalination performance of such membranes as a function of pore size, chemical functionalization, and applied pressure. Our results indicate that the membrane’s ability to prevent the salt passage depends critically on pore diameter with adequately sized pores allowing for water flow while blocking ions. Further, an investigation into the role of chemical functional groups bonded to the edges of graphene pores suggests that commonly occurring hydroxyl groups can roughly double the water flux thanks to their
hydrophilic character. The increase in waterflux comes at the expense of less consistent salt rejection performance, which we attribute to the ability of hydroxyl functional groups to substitute for water molecules in the hydration shell of the ions. Overall, our results indicate that the water permeability of this material is several orders of magnitude higher than conventional reverse osmosis membranes, and that nanoporous graphene may have a valuable role to play for water purification.
KEYWORDS: Desalination, graphene, molecular dynamics, materials, nanofluidics
D
esalination is one of the most promising approaches to supply new fresh water in the context of a rapidly growing global water gap. But although oceans and seas contain about 97% of the world’s water, desalination today only accounts for a fraction of a percent of the world’s potable water supply.1 This is because existing commercial techniques for desalination suffer from important drawbacks, most importantly large energy footprints and high capital costs. Reverse osmosis (RO) is the most energy-efficient desalination technique to date with a record of 1.8 kWh/m3 recently achieved in acommercial plant (compared with an average∼5 kWh/m3 in the 1990s).2Meanwhile, thermal desalination methods such as multistageflash and multiple-effect distillation are several times more energy-intensive.1,3 Despite the wide availability of seawater, desalination can only become a sustainable water supply option if dramatically new technologies are developed.
Nanoporous materials have a great deal to offer over existing technologies for desalination. In contrast with classical RO membranes, where water transports slowly via a solution-diffusion process, nanoporous membranes can allow for fast convective waterflow across well-defined channels. Thanks to their small dimensions, nanopores can be used asfilters on the basis of molecular size, since small molecules can pass through them while larger ones cannot. And because the dimensions of the nanopores are also comparable to the Debye screening length for electrostatic interactions and smaller than the mean free path between molecular collisions in water, the pores can also make use of other physical principles, such as charge or hydrophobicity, to reject ions or other molecular solutes. Nanofluidics studies of synthetic nanostructures such as carbon nanotubes (CNTs) suggest that water inside such structures
can exhibit “hyperlubricity” and flow at rates greater than predicted by continuum fluid dynamics.4 Metal−organic frameworks (MOFs) such as zeolites have also been examined for desalination technology.5 However, to date none of these nanomaterials have proved successful for desalination. Mem-branes based on CNTs have been limited by low salt rejection rates and the difficulty of producing highly aligned and high-density CNT arrays.6,7As for zeolites, studies suggest that their relatively low water permeability may pose a challenge for desalination applications.8
Because flux across a membrane scales inversely with the membrane’s thickness, new types of ultrathin membranes offer the promise of greatly increased water permeability. Graphene, which consists of a 2D sheet of sp2-bonded carbon atoms in a hexagonal honeycomb lattice, is the ultimate thin membrane. This relatively new material has advanced quickly toward large-scale manufacturability with roll-to-roll production of 30 in. graphene films already available.9 Potential advantages of graphene over existing RO membranes include negligible thickness (one or several atomic layers) and high mechanical strength,10 which may enable faster water transport, low pressure requirements, and a wider range of operating conditions than previously possible. Nanopores can be introduced into graphene’s structure with the unsaturated carbon atoms at the pore edge passivated by chemical functional groups. Recently, experimental studies have begun to explore a wide variety of methods for introducing nanopores Received: April 4, 2012
Revised: June 1, 2012
pubs.acs.org/NanoLett
in graphene with rapid progress in performance. Earlier approaches relied on electron beam exposure, but the most recent methods make use of diblock copolymer templating, helium ion beam drilling, and chemical etching to achieve both higher porosity and a more precise pore size distribution.11−14 Although existing studies have already found potential applications of nanoporous graphene in fields such as DNA sequencing and gas separation,15−19 the potential role of this material for water desalination remains largely unexplored.
In this Letter, we report computational results indicating that single-layer graphene can effectively separate salt from water for use in desalination systems. Using classical molecular dynamics simulations, we examined how the desalination dynamics change with pore size, pore chemistry, and applied hydrostatic pressure. Our calculations demonstrate that water can flow across a graphene membrane at rates in range of 10−100 L/ cm2/day/MPa while still rejecting salt ions, which is 2 to 3
orders of magnitude higher than diffusive RO membranes.
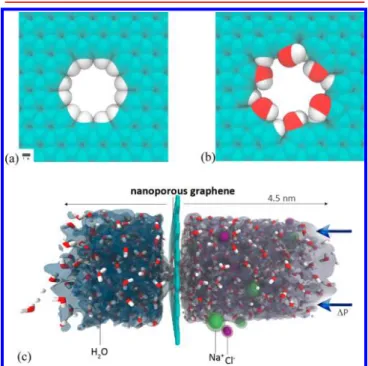
Computational Methods.The pore sizes were varied from 1.5 to 62 Å2, and we analyzed both pores passivated with commonly occurring hydroxyl groups (which are hydrophilic in nature) and hydrogen atoms (which are hydrophobic) in order to examine the effect of pore chemistry on desalination dynamics (see Figure 1). Our choice of pore sizes was based on
indications from previous studies. In particular, molecular dynamics studies by Suk et al. found that pure water can continue toflow across graphene pores with diameters below 1 nm,20and calculations by Sint et al. suggest that the chemical functionalization of graphene nanopores could be tuned to selectively reject certain solvated ions.21
Water was modeled using the TIP4P potential,22 while interactions for all other atomic species were modeled using Lennard-Jones (LJ) and Coulombic terms. The parameters employed for each interaction type are summarized in the Supporting Information. The TIP4P model allows for water polarization arising at the intermolecular level via orientational rearrangement,23 while intramolecular contributions to water
polarizability (due to bond and angle deformations as well as changes in electronic structure) are not explicitly included. These additional components of polarizability are known to affect several water properties including dimer stability,24but as we shall see, it is the orientational contribution that dominates the physics of the system studied here. In order to ensure quantitatively that this is the case, we performed an auxiliary set of simulations that allowed for enhanced water polarizability within individual water molecules by allowing forflexible bonds and angles (i.e., geometric polarizability23) using the SPC/F (flexible) force field.25 This component of polarizability is in addition to the orientational component, which is already captured in the TIP4P model. The results of these flexible water simulations, which will be discussed below, indicate that the rigid TIP4P model provides similar dynamics at lower computational cost.
All simulations were performed using the LAMMPS package.26 Hydrogenated pores were obtained by passivating each carbon at the pore edge with a hydrogen atom. For hydroxylated pores, the unsaturated carbons along the pore edge were alternatively bonded with H- and OH-groups. Although this pore chemistry also contains hydrogen groups, our calculations indicate these pores are more thermodynami-cally stable with this alternating pattern because it prevents steric interactions between neighboring OH -groups. Fur-thermore, the OH-groups primarily govern the water−pore interactions because they extend further from the pore edge. The size of each pore was measured by plotting atoms as van der Waals spheres and calculating the amount of contiguous area not obstructed by any atomic representations. Pore diameters were obtained from the open pore area measure-ments by the straightforward formula d = 2√(A/π), which results in nominally smaller diameters than the center-to-center measurements employed in other works.20In order to decouple the transport behavior of saltwater through the membrane from mechanical deformation phenomena, the carbon atoms in the membrane were held fixed during the simulations. We employed a nonpolarizable model for salt ions. Although this approximation impacts the distribution of ions in the vicinity of interfaces,27−29this is expected to have a negligible effect on the transport properties examined in this work, since the passage (or rejection) of salt ions is primarily determined by the high applied pressure and not by their equilibrium position with respect to the membrane. To the extent that polarization of the ions modifies the ion dynamics at the water/membrane interface, the polarizability would be expected to result in an enhanced salt rejection, as Cl-ions become more strongly repelled by the graphene interface.30
The saltwater in our system contained 16 Na-ions and 16 Cl-ions solvated by 825 water molecules, corresponding to a salt concentration of 72 g/L.31A higher salinity than seawater (∼35 g/L) was chosen in order to increase the occurrence of ion− pore interactions and obtain more precise results for a given system size and simulation time. The initial system consisted of a box measuring 75 Å in thez-direction and periodicx−yplane with a unit cell cross-section of 30 × 30 Å. The graphene membrane was fixed at z = 60 Å, and a rigid piston was originally placed atz= 0 and subsequently allowed to push the water toward the membrane at a prescribed external pressure. After initially subjecting the system to pressures ranging from 1 MPa all the way to 1500 MPa, we focused our calculations in the 100−200 MPa range in order to obtain well-converged statistics for the time scales involved in these MD calculations. Figure 1.Hydrogenated (a) and hydroxylated (b) graphene pores, and
(c) side view of the computational system investigated in this work.
dx.doi.org/10.1021/nl3012853|Nano Lett.XXXX, XXX, XXX−XXX B
Although these pressure values are significantly higher than what is typical for desalination (a few MPa), the fact that the time scales forflow scale linearly with applied pressure strongly suggests that our results will also hold valid at low pressures.
The NVT ensemble was used with a Nosé−Hoover thermostat at 300 K with an initial Gaussian velocity distribution consistent with this temperature. After an equilibration time of 100 ps during which the external piston pressure was kept atP= 0, we carried out runs on the order of 5−10 ns with a time step of 1 fs. The properties calculated below were obtained by averaging over 5 separate runs starting from different sets of initial conditions for each configuration to ensure that the quantities are converged.
Water Permeability.The waterflow across three different hydroxylated pores as a function of time is shown in Figure 2.
Theflow profiles show that theflow rate of water is constant in time and increases with pore size and applied pressure. For narrow enough pores, water molecules are unable to pass and no water permeation is observed during the entire trajectory. Conversely, when the water flow is fast enough, the curve eventually reaches a saturation point indicating that the entire reservoir of water molecules on the feed side has become depleted before the end of the simulation.
Each trajectory begins with a linear regime in which water
flows at a constant rate: the behavior of the system indicates that the effects of thefinite size of the periodic simulation box, including the relative increase in feed salinity as water is graduallyfiltered through the membrane, are negligible in this regime. The slope of eachflow curve in Figure 2 corresponds to the flow rate per unit of time, which was found to be proportional to applied pressure. Thus, we can extrapolate the dynamic quantities derived here down to the operating conditions more typical of reverse osmosis plants, (ΔP ≈ 5 MPa) by defining a water permeability normalized per unit of applied pressure. Assuming a relatively conservative membrane porosity of 10%, we have estimated the effective water permeability achieved in each system (see Figure 3). The water permeability, expressed in liters of output per square centimeter of membrane per day and per unit of applied pressure, ranges from zero (for the narrowest hydrogenated
pore) to 129 L/cm2/day/MPa in the case of the largest hydroxylated pore simulated here. The permeability scales linearly with pore area, as expected from the Hagen−Poiseuille equation in classicalfluid dynamics forflow across a cylindrical pore32(see Figure 3).
On the other hand, the effect of pore chemistry has no clear analog in macroscopic fluid dynamics. For a given pore size, water permeability is significantly enhanced by hydroxylation: the permeability across the ∼25 Å2 pores (and the ∼50 Å2 pores) is larger by 69% (and 115%, respectively) compared with the hydrogenated case. This behavior is due to the fact that hydrophilic functional groups increase the water flux by allowing for a greater number of hydrogen-bonding confi g-urations inside the pore, as will be discussed below.
Salt Rejection. While pores must exceed a critical size in order to permeate water molecules, they must also be narrower than a maximum diameter in order to effectively hinder the passage of salt ions. Our data for permeate salinity suggests that this maximum diameter is around 5.5 Å, that is, that the majority of salt ions approaching the pore entrance are able to pass through the membrane beyond this diameter.
The calculated salt rejection for each nanoporous membrane is shown in Figure 4. Salt rejection is calculated from the salinity of the permeate solution att=t1/2(defined as the time
Figure 2.Waterflow in hydroxylated pores as a function of simulation time. Flow rates, given by the slope of each curve, increase as a function of applied pressure as well as pore size. The largest pores allow water toflow at a constant rate that is proportional to applied pressure until the entire feed reservoir has become depleted.
Figure 3. Computed water permeability for nanoporous graphene functionalized with hydrogen and hydroxyl groups for various pore sizes. Water permeability scales roughly linearly with the area of hydroxylated or hydrogenated pores.
Figure 4.Average salt rejection as a function of pore type and pressure differential. The results indicate that smaller pores are capable of effectively rejecting salt, but that rejection performance decreases with higher pressures. Moreover, hydrogenated pores exhibit a stronger salt rejection performance than hydroxylated ones.
dx.doi.org/10.1021/nl3012853|Nano Lett.XXXX, XXX, XXX−XXX C
when half the water hasflowed to the permeate side) relative to the initial salinity of the feed for the range of pore systems. For a perfectly rejecting membraneR= 100%, the permeate salinity is zero, while a membrane with no salt rejection (R = 0%) would yield the same salinity in the permeate as in the initial feed. Figure 4 shows that salt rejection is close to 100% for the smallest hydrogenated and hydroxylated pore as well as for the medium hydrogenated pore. For the remaining pores, the salt selectivity decreases both with pore size and applied pressure, reaching a minimum of 33% for the largest OH-functionalized pore at 222 MPa.
While salt rejection decrease with increasing pore size is expected from a size exclusion argument, the dependence of salt rejection on applied pressure is noteworthy. In particular, we find that the salt rejection of a given pore decreases at higher applied pressures, which is the opposite of what is observed in diffusive RO membranes.33 We attribute this difference in behavior to the large effective volume of ions in solution, which causes them to respond more sensitively to pressure increases than water molecules. This is in contrast with the kinetics of ion passage across diffusive RO membranes, in which the governing driving force for salt passage is osmotic pressure and where waterflux increases faster than saltflux with rising pressure.
By comparing the salt rejection predicted using the flexible SPC/F water model with the main results presented here using
the TIP4P water model, we are able to infer that intramolecular vibrations and polarizability play a negligible role in the dynamics of saltwater transport. Indeed, a set of five SPC/F calculations performed at 148 MPa for the largest and second-largest hydrogenated pores yields salt rejection values within 1% of the TIP4P results (see Figure 4). This suggests that molecular polarizability, while important for predicting other properties in water, is not a leading-order effect in the desalination performance studied here.
Our results indicate that pore chemistry also has a notable effect on salt rejection. For a given pore size and applied pressure, the salt rejection is lower for hydroxylated pores. We attribute this effect to the fact that OH functional groups can hydrogen-bond with salt ions much like water molecules do, which results in a lower free energy barrier to ionic passage.
Water Structure in the Pore Vicinity.The organization of water molecules in the vicinity of the pores plays a dominant role in both the water permeability and the salt rejection of a nanoporous graphene membrane. The water structure is in turn determined both by size effects (i.e., pore size) and chemical effects (i.e., pore functionalization). In order to further understand why hydroxylated pores exhibit higher water permeability and why hydrogenated pores are more effective at rejection salt, we have investigated several properties that indicate how waterflows across each pore.
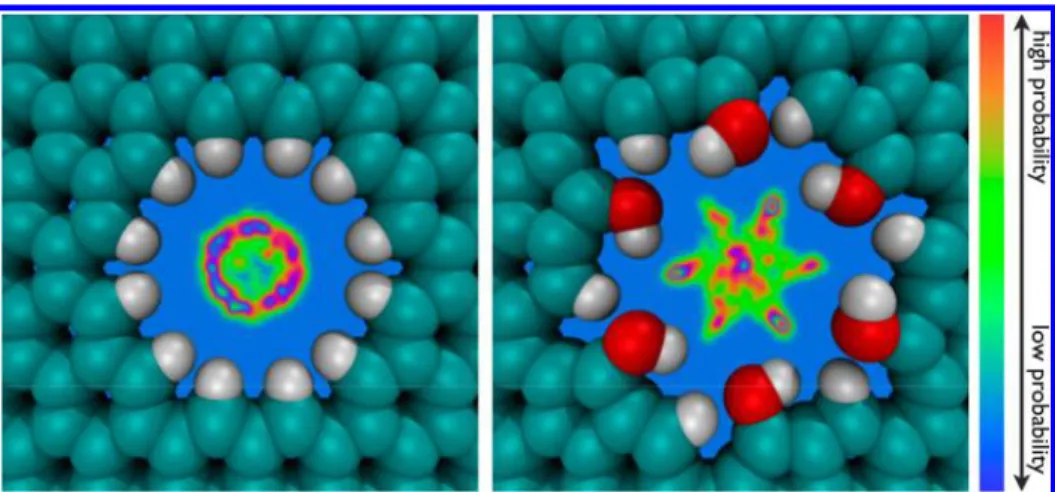
Figure 5.Oxygen density maps at inside a hydrogenated (left) and hydroxylated pore (right), with open pore areas of 23 and 28 Å2respectively. Light blue indicates the region in which no water oxygens are found, while red regions indicate the highest probability offinding an oxygen atom.
Figure 6.Angular distribution function (ADF) of water molecules with respect to the plane of the graphene membrane as a function of position. Red depicts increasingly positive values of cos(α), indicating that the molecule’s hydrogen atoms lie toward the membrane, while blue indicates negative values. The ADF is averaged over 5 Å on the feed side of the membrane for a hydroxylated pore (left) and hydrogenated pore (right).
dx.doi.org/10.1021/nl3012853|Nano Lett.XXXX, XXX, XXX−XXX D
In principle, the higherflow rates across hydroxylated pores could arise from either a broadening of the cross-sectional area available to water molecules, or from faster passage of each water molecule. To identify which effect is dominant here, we have calculated the density maps for oxygen atoms of water molecules inside H- and OH-functionalized pores (shown in Figure 5). Although the shapes of the density surfaces differ to reflect the radial and 6-fold symmetry of the H- and OH-functionalized pore respectively, thefigure reveals that the total cross-sectional area available for water passage across the H-functionalized pore is only smaller by about 25%. This decrease alone is insufficient to explain the 69−113% drop in water permeability found in hydrogenated pores, and therefore another factor must be at play.
We attribute this additional factor to an entropic effect. To illustrate this, the angular distribution function of water molecules in the vicinity of a graphene nanopore is plotted in Figure 6. Thefigure shows that water is more ordered in the vicinity of a hydrogenated pore. This higher level of ordering is consistent with the fact that hydrogen passivation is hydro-phobic and hence restricts the number of hydrogen-bonding configurations available to water molecules traversing the membrane. In contrast, OH-groups can hydrogen-bond with water and offer a smoother entropic landscape for water molecules to traverse, thus allowing for faster overall waterflow. The effect of pore chemistry on water structure can thus explain why hydroxylated pores have higher water permeability than hydrogenated pores.
Kinetic Behavior.We are able to reproduce the qualitative behavior of water desalination across a nanoporous graphene membrane, including the entropic effect of pore chemistry and the salt rejection drop at higher pressures, with a simplified kinetic model involving a reduced number of variables. Assuming an Arrhenius model for both water and salt passage and neglectingfinite size effects, we can approximate the rates of water and salt passage respectively as
̇ = −Ω − Δ + Δ
Nw A e0 wP ( E T S)/kT
̇ = −Ω − Δ + Δ
Ns B e0 sP ( E T S)/kT
HereA0(T) andB0(T) represent the attempt rates for water and salt passage, respectively. These attempt rates may be treated as constant for a given pore size, chemistry, applied pressure, temperature, and salt concentration. Ωi denotes the
effective volume of a molecule of speciesi; this effective volume multiplied by the applied pressure acts as a driving force for species passage. The (ΔE + TΔS) terms represent the free energy barrier for speciesiassociated with traversing the pore. For nanometer-scale pores, this free energy barrier is expected to be a large quantity, and our MD results described above indicate that it should be larger for a hydrophobic pore compared to a hydrophilic one since the entropic barrier for entering the pore is higher. In this kinetic model, the steady-state permeate salinity is given by the ratio of the two permeation rates,Ṅs/Ṅw.
The larger volume of solvated ions relative to water molecules can explain the observed salt rejection drop at higher pressures: although salt and water permeation rates both increase linearly with pressure, the salt has a larger effective volume. Accordingly, the saltflow rate increase is steeper than that of water and results in a lower overall salt rejection for increasing pressure. We take representative values for the
effective volumes (Ωw ∼10−28 m3, Ω
s ∼10−27 m3,T = 300)
and the attempt rates expected from kinetic theory (A0∼1011
s−1, B
0 ∼ 1010 s−1). To test our hypothesis that an entropic
barrier can account for the contrasting properties of hydrophilic versus hydrophobic pores, we assign a larger value ofΔSto the hydrogenated pore than to the hydroxylated pore (ΔS = 4.5 and 5.5 k, respectively). For simplicity, we assume that the entropic barrier for salt passage is higher than for water passage by a factor of 10%. The choice of an energy barrier ΔE is arbitrary since it does not appear in the expression for salt rejection. A further refinement to this model would be to specify two different values ofΔEfor salt ions across OH- and H-functionalized pores, but the results below show that the present level of detail is enough to qualitatively reproduce the main observed trends.
The steady-state salt rejection predicted by this model is plotted in Figure 7. The plots indicate that the simple kinetic
model proposed here qualitatively replicates the trends observed in the MD trajectories: (a) salt rejection is a decreasing function of applied pressure; (b) salt rejection is higher for a hydrogenated pore.
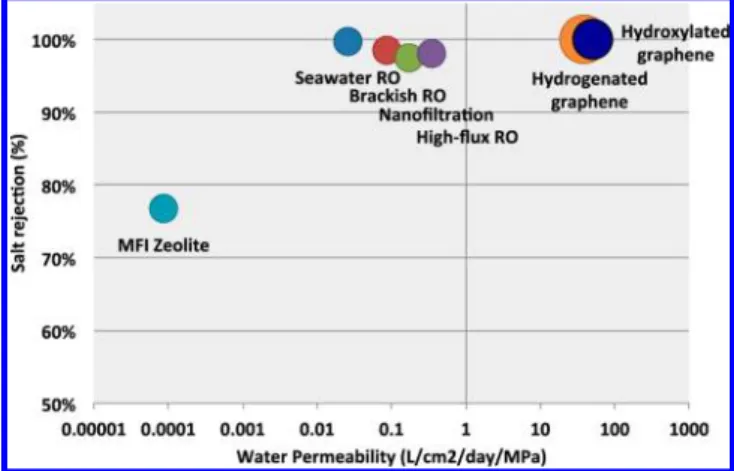
Overall, our results indicate that graphene could act as a high-permeability desalination membrane. For illustrative purposes, the theoretical performance of the optimal graphene pore configurations examined here is plotted along with the experimental performance of RO in Figure 8. Among the pore configurations that exhibited both full salt rejection and water passage (23.1 Å2hydrogenated pore and 16.3 Å2hydroxylated
pore), the water permeability ranged from 39 to 66 L per cm2·day·MPa. In contrast, experimentally observed
perme-abilities for RO barely exceed a few Cl per cm2·day·MPa (and values predicted from MD simulations lie in this range as well34).
Regarding the question of whether a material such as nanoporous graphene could be practical for commercial-scale desalination, we believe that graphene, and analogous 2D porous materials, represent far more than a theoretical study Figure 7.Predicted salt rejection across a hydrogenated (upper line) and hydroxylated (lower line) pore from a simple kinetic model. The model qualitatively replicates the observed decrease in salt rejection with increasing pressure, as well as the higher salt rejection performance of a hydrogenated pore. While this kinetic model neglects certain features of the MD system, including osmotic effects, finite size effects, and collective phenomena, it qualitatively replicates the observed behavior. This lends support to the hypothesis that hydrophilic membrane chemistries enable faster flow rates by increasing the range of conformations and bonding configurations allowed inside the pore.
dx.doi.org/10.1021/nl3012853|Nano Lett.XXXX, XXX, XXX−XXX E
system. In particular, the two main challenges to this material, its mechanical stability under applied pressure and its pore size distribution, may find some promising solutions ahead. Mechanical stability, while beyond the direct scope of the present study, may be achieved using similar strategies to the conventional RO industry, where a highly porous polysulfone layer serves to support the thin-film active layer. Such a support layer would add to graphene’s inherent mechanical strength. Indeed, previous computational work has found that graphene monolayers pinned every 40−160 Å could withstand pressures upward of 500 MPa without ripping,35 with experimental results also confirming graphene’s high robustness in bulge tests.36
The second challenge is to achieve an extremely narrow pore size distribution in the membrane, as our calculations indicate that salt rejection performance is highly sensitive to pore diameter. Rapid experimental progress toward accurately synthesizing highly ordered porous graphenes strongly suggests that the practical feasibility of this system may be less far off than was believed just a few years ago. To the extent that the approach introduced here is not strictly limited to graphene, surface-assisted self-assembly could help 2-dimensional gra-phene-like materials16 reach the economies of scale already achievable in non-porous graphene.9 Overall, the enhanced water permeability of nanoporous graphene could offer important advantages over existing RO technology. For a given water output, such a membrane would enable lower energy requirements due to lower operating pressures. It could also mean smaller and more modular desalination plants thanks to smaller membrane area requirements.
Conclusion.Our MD simulations indicate that nanoporous graphene membranes are able to reject salt ions while letting waterflow at permeabilities several orders of magnitude higher than existing RO membranes. By simulating saltwater flow across a variety of pore diameters and chemical functionaliza-tions, we have established that desalination performance is most sensitive to pore size and pore chemistry. Our examination of the structure of water in the pore vicinity revealed that the hydrophobic character of hydrogenated pores reduces the waterflow by imposing additional conformational order on the system, even as the limited hydrogen bonding allows for greater salt rejection relative to hydroxylated pores.
This work highlights the promise of atomically thin, periodic nanostructures like graphene for water desalination. Our approach strongly suggests that a bottom-up, systematic redesign of desalination membrane materials can yield significant improvements over existing technological methods. We expect that this work will add to the understanding of next-generation membranes for clean water technology.
■
ASSOCIATED CONTENT*
S Supporting InformationComputational details including system composition, forcefield parameters, and postprocessing tools employed in this work. This material is available free of charge via the Internet at http://pubs.acs.org.
■
AUTHOR INFORMATIONCorresponding Author *E-mail: jcg@mit.edu.
Notes
The authors declare no competingfinancial interest.
■
ACKNOWLEDGMENTSThe authors thank Drs. Joo-Hyoung Lee, Ateeque Malani, and Alexie Kolpak for useful discussions. D.C.-T. was funded by the MIT Energy Initiative and the John S. Hennessey Fellowship. This research was also partially funded by the MITei Seed Fund Program. Calculations were performed using NERSC comput-ing resources.
■
REFERENCES(1) Addams, L.; Boccaletti, G.; Kerlin, M.; Stuchtey, M.Group, 2. W. R.; McKinsey and Company Charting Our Water Future: Economic Frameworks to Inform Decision-making; 2030 Water Resources Group, 2009.
(2) Elimelech, M.; Phillip, W. A.Science2011,333, 712−717. (3) Spiegler, K.; El-Sayed, Y.Desalination2001,134, 109−128. (4) Alexiadis, A.; Kassinos, S.Chem. Rev.2008,108, 5014−5034. (5) Pendergast, M. M.; Hoek, E. M. V.Energy Environ. Sci.2011,4, 1946−1971.
(6) Fornasiero, F.; In, J. B.; Kim, S.; Park, H. G.; Wang, Y.; Grigoropoulos, C. P.; Noy, A.; Bakajin, O.Langmuir2010,26, 14848− 14853.
(7) Fornasiero, F.; Park, H. G.; Holt, J. K.; Stadermann, M.; Grigoropoulos, C. P.; Noy, A.; Bakajin, O.Proc. Natl. Acad. Sci. U.S.A.
2008,105, 17250−17255.
(8) Hu, Z.; Chen, Y.; Jiang, J.J. Chem. Phys.2011,134, 134705. (9) Bae, S.; Kim, H.; Lee, Y.; Xu, X.; Park, J.-S.; Zheng, Y.; Balakrishnan, J.; Lei, T.; Ri Kim, H.; Song, Y. I.; Kim, Y.-J.; Kim, K. S.; Özyilmaz, B.; Ahn, J.-H.; Hong, B. H.; Iijima, S.Nature2010,5, 574− 578.
(10) Lu, Q.; Huang, R.Int. J. Appl. Mech.2009,1, 443−467. (11) Garaj, S.; Hubbard, W.; Reina, A.; Kong, J.; Branton, D.Nature
2010,467, 190−193.
(12) Bell, D. C.; Lemme, M. C.; Stern, L. A.; Williams, J. R.; Marcus, C. M.Nanotechnology2009,20, 455301.
(13) Bieri, M.; Treier, M.; Cai, J.; Aït-Mansour, K.; et al. Chem. Commun.2009, 6919.
(14) Kim, M.; Safron, N. S.; Han, E.; Arnold, M. S.; Gopalan, P.Nano Lett2010,10, 1125−1131.
(15) Postma, H.Nano Lett2010,10(2), 420−425.
(16) Xu, P. T.; Yang, J. X.; Wang, K. S.Chin. Sci. Bull.2011,57. (17) Hauser, A. W.; Schwerdtfeger, P.J. Phys. Chem. Lett. 2012,3, 209−213.
(18) Schrier, J.; McClain, J.Chem. Phys. Lett.2012,521, 118−124. Figure 8.Performance chart for functionalized nanoporous graphene
versus existing technologies. The graphene nanopores examined in this work could reject salt ions with a water permeability 2−3 orders of magnitude higher than commercial RO. The data for RO and MFI zeolites is adapted from Pendergast et al.5
dx.doi.org/10.1021/nl3012853|Nano Lett.XXXX, XXX, XXX−XXX F
(19) Blankenburg, S.; Bieri, M.; Fasel, R.; Muellen, K.; Pignedoli, C. A.; Passerone, D.Small2010,6, 2266−2271.
(20) Suk, M.; Aluru, N. R.J. Phys. Chem. Lett.2010,10(1), 1590− 1594.
(21) Sint, K.; Wang, B.; Kral, P.J. Am. Chem. Soc.2008,130(49), 16448−16449.
(22) Jorgensen, W. L.; Chandrasekhar, J.; Madura, J. D.; Impey, R.; Klein, M. L.; Chandrasekhar, J.J. Chem. Phys.1983,79, 926−935.
(23) Yu, H.; van Gunsteren, W.Comput. Phys. Commun.2005,172, 69−85.
(24) Sprik, M.; Klein, M. L.; Watanabe, K.J. Phys. Chem.1990,94, 6483−6488.
(25) Mizan, T. I.; Savage, P. E.; Ziff, R. M.J. Phys. Chem.1994,98, 13067−13076.
(26) Plimpton, S.J. Comput. Phys. 1995,117, 1−19.
(27) Vrbka, L.; Mucha, M.; Minofar, B.; Jungwirth, P.; Brown, E.; Tobias, D.Curr. Opin. Colloid. Interface Sci.2004,9, 67−73.
(28) Levin, Y.; Santos dos, A. P.; Diehl, A.Phys. Rev. Lett.2009,103, 257802.
(29) Carignano, M.; Karlstrom, G.; Linse, P.J. Phys. Chem. B1997,
101, 1142−1147.
(30) Cole, D. J.; Ang, P. K.; Loh, K. P.J. Phys. Chem. Lett.2011,2, 1799−1803.
(31) Humphrey, W.; Dalke, A.; et al.J. Mol. Graphics1996,14, 33− 38.
(32) Deen, W. M. Analysis of Transport Phenomena; Oxford University Press: New York, 1998; p 597.
(33) Williams, M.EET Corporation and Williams Engineering Services Company, lnc. 2003, http://www.eetcorp.com/heepm/RO_TheoryE. pdf on 11/22/2011.
(34) Luo, Y.; Harder, E.; Faibish, R. S.; Roux, B.J. Membr. Sci.2011,
384, 1−9.
(35) Jun, S.; Tashi, T.; Park, H. S.J. Nanomater.2011,2011, 1−6. (36) Bunch, J. S.; Verbridge, S. S.; Alden, J. S.; van der Zande, A. M.; Parpia, J. M.; Craighead, H. G.; McEuen, P. L.Nano Lett. 2008,8, 2458−2462.
dx.doi.org/10.1021/nl3012853|Nano Lett.XXXX, XXX, XXX−XXX G