Pace Law Review
Pace Law Review
Volume 37
Issue 1 Fall 2016 Article 7
March 2017
Survivor Funds
Survivor Funds
Jonathan Barry Forman University of Oklahoma Michael J. Sabin
Follow this and additional works at: https://digitalcommons.pace.edu/plr
Part of the Banking and Finance Law Commons, Retirement Security Law Commons, and the
Securities Law Commons
Recommended Citation Recommended Citation
204
Survivor Funds
Jonathan Barry Forman
1& Michael J. Sabin
2 ABSTRACTThis Article explains how to create “survivor funds”—short-term investment funds that would pay more to those investors who live until the end of the fund’s term than to those who die before then. For example, instead of just investing in a ten-year bond and dividing the proceeds among the investors at the end of the bond term, a survivor fund would invest in that ten-year bond but divide the proceeds only among those who survived the full ten years. These survivor funds would be attractive investments because the survivors would get a greater return on their investments, while the decedents, for obvious reasons, would not care.
Survivor funds would work like short-term tontines. Basically, a tontine is a financial product that combines features of an annuity and a lottery. In a simple tontine, a group of investors pools their money together to buy a portfolio of investments, and, as investors die, their shares are forfeited, often with the entire fund going to the last survivor. For example, imagine that ten 65-year-old men each contribute 1. Alfred P. Murrah Professor of Law, University of Oklahoma; B.A. 1973, Northwestern University; M.A. (Psychology) 1975, University of Iowa; J.D. 1978, University of Michigan; M.A. (Economics) 1983, George Washington University; Professor in Residence at the Internal Revenue Service Office of Chief Counsel, Washington, D.C. for the 2009-2010 academic year. Thanks to Richard Fullmer, to the participants in the University of Oklahoma/University of Houston Law Faculty Exchange Program held at the University of Houston Law Center, Houston, Texas, April 20, 2015, and to the participants in the Fourth Annual ERISA, Employee Benefits, and Social Insurance Conference held at the Drexel University Thomas R. Kline School of Law, Philadelphia, Pennsylvania, March 27, 2014.
2. Independent consultant, Sunnyvale, California, B.S. (Electrical Engineering) 1977, University of Florida; M.S. 1979, Ph.D. 1984 (Electrical Engineering), Stanford University; Member of Technical Staff, Bell Laboratories, 1977-1981; Assistant Professor (Electrical Engineering & Computer Sciences), University of California Berkeley, 1984-1986; Senior Scientist, Cylink Corporation, 1986-1995.
2016 SURVIVOR FUNDS 205
$1000 to a fund that buys a large diamond for $10,000 and that the men agree that the last “survivor will get the diamond. Accordingly, after the ninth man dies, the tenth man gets the diamond, and he can keep it or sell it.
Of course, the survivor principle—that the share of each, at death, is enjoyed by the survivors—can be used to design financial products that would benefit multiple survivors, not just the last survivor. For example, elsewhere, we showed how tontines could be used to create so-called “tontine annuities” and “tontine pensions” that would benefit lots of retirees. In this Article, we show how the survivor principle can be used to create survivor funds that would only make payments to those who survive for a specified number of years.
INTRODUCTION
“Steve and Mark are camping when a bear suddenly comes out and growls. Steve starts putting on his tennis shoes. Mark says, ‘What are you doing? You can’t outrun a bear!’ Steve says, ‘I don’t have to outrun the bear—I just have to outrun you!’”3
This Article explains how to create survivor funds —short-term investment funds that would pay more to those investors who live until the end of the fund’s term than to those who die before then. For example, instead of just investing in a ten-year zero coupon bond4 and dividing the proceeds among the
3. You Can’t Outrun a Bear, BOYS’ LIFE,
http://boyslife.org/jokes/6953/you-cant-outrun-a-bear/ (last visited Oct. 30, 2016).
4. Zero Coupon Bonds, U.S. SEC.& EXCH. COMM’N., (Mar. 29, 2010),
http://www.sec.gov/answers/zero.htm (“Zero coupon bonds are bonds that do not pay interest during the life of the bonds. Instead, investors buy zero coupon bonds at a deep discount from their face value, which is the amount a bond will be worth when it “matures” or comes due. When a zero coupon bond matures, the investor will receive one lump sum equal to the initial investment plus the imputed interest . . .”). Historically, bonds were issued in the form of bearer certificates, with interest coupons printed on the certificate. See, e.g., Coupon Bond, INVESTINGANSWERS,
http://www.investinganswers.com/financial-dictionary/bonds/coupon-bond-1039 (last visited Oct. 30, 2016). As each interest payment came due, the bearer would detach (“clip”) the coupon and exchange it for the interest payment. Id.
investors at the end of the bond term, a survivor fund would invest in that ten-year zero coupon bond but divide the proceeds only among those who survived the full ten years. These survivor funds would be attractive investments because the survivors would get a greater return on their investments, while the decedents, for obvious reasons, would not care.
Survivor funds would work like short-term tontines.5
Basically, “[a] tontine is a financial product that combines the features of an annuity and a lottery.”6 “In a simple tontine, a
group of investors pool their money together to buy a portfolio of investments and, as investors die, their shares are forfeited, with the entire fund going to the last surviving investor.”7 “For
example, in an episode of the popular television series
M*A*S*H, Colonel Sherman T. Potter, as the last survivor of
his World War I unit, got to open the bottle of cognac that he and his buddies brought (and share it with his Korean War compatriots).”8 Similarly, in the reality television show
Survivor, contestants are stranded in a remote location, and
the last “survivor” gets a million-dollar prize.9
Of course, the survivor principle—”that the share of each, at his death, is enjoyed by the survivors”10—can be used to
design a variety of financial products that would benefit multiple survivors, not just the last survivor. In the seventeenth and eighteenth centuries, for example, many European governments used multi-beneficiary tontines to raise
5. Tontines are named after Lorenzo de Tonti, the seventeenth century Italian banker who came up with the idea. See, e.g., MOSHE A. MILEVSKY,
KING WILLIAM’S TONTINE: WHY THE RETIREMENT ANNUITY OF THE FUTURE
SHOULD RESEMBLE ITS PAST 42 (2015).
6. Jonathan Barry Forman & Michael J. Sabin, Tontine Pensions, 163 U. PA. L. REV. 755, 757 (2015) [hereinafter Forman & Sabin, Tontine
Pensions]. “An annuity is a financial instrument (e.g., an insurance contract)
that converts a lump sum of money into a stream of income payable over a period of years, typically for life. The person holding an annuity is called an annuitant.” Id. at 757 n.1.
7. Id. at 757.
8. Id. (referring to M*A*S*H: Old Soldiers (CBS television broadcast Jan. 21, 1980)).
9. Survivor (TV Series 2000-), http://www.imdb.com/title/tt0239195/ (last visited Oct. 30, 2016).
10. Tontine, WORDNIK, https://www.wordnik.com/words/tontine (last
2016 SURVIVOR FUNDS 207 money.11 Similarly, elsewhere, we have described how tontines
could be used to create so-called tontine annuities and tontine pensions that would benefit lots of retirees.12
In this Article, we show how the survivor principle can be used to create survivor funds that would only make payments to those who survive for a specified number of years. We believe that many investors would be attracted to these survivor funds. These are people who want the higher returns that survivors could get with survivor funds and who would be willing to accept the losses that they would incur if they died before the survivor-fund term ended. In short, we believe that there would be a demand for short-term survivor funds, and given that demand, there would be companies that want to offer them.
Indeed, we believe that many investors would be attracted to survivor funds, and this Article explains how those survivor funds would work. At the outset, Part I of this Article discusses the individual-cohort method for reallocating the balances in the accounts of those who die before the survivor-fund term ends. Part II explains the date-aligned method for reallocating those account balances. Part III discusses the difficulty of selecting the correct mortality table for a survivor fund to use (when one is needed), and Part IV shows how the
age-aligned method for reallocating account balances losses can
avoid that difficulty. Finally, Part V shows that survivor funds could work with all types of investments, and Part VI discusses how to resolve some of the technical problems that would arise with survivor funds.
11. See, e.g., MILEVSKY, supra note 5;ROBERT W.COOPER,AN HISTORICAL
ANALYSIS OF THE TONTINE PRINCIPLE (1972); Kent McKeever, A Short History
of Tontines, 15 FORDHAM J.CORP.&FIN.L. 491 (2009).
12. See Forman & Sabin, Tontine Pensions, supra note 6, at 790-801 (tontine annuities), 802-07 (tontine pensions); Michael J. Sabin, Fair Tontine
Annuity (Mar. 26, 2010) (unpublished manuscript),
I. ASIMPLE SURVIVOR FUND:THE INDIVIDUAL
-COHORT METHOD
A. Longevity Risk, Annuities, and Bonds
“Longevity risk—the risk of outliving one’s retirement savings—is probably the greatest risk facing current and future retirees.”13 Individuals use a variety of approaches to
“hedge” against living too long. Traditional lifetime annuities offer a particularly good way for individuals to generate income throughout their retirement years. For example, for a 65-year-old man who purchased a $100,000 immediate, level-payment annuity without inflation protection as of December 1, 2015, the annual payment would be around $6540 (6.54% of the annuity’s purchase price.14
Of course, people rarely choose to buy annuities voluntarily.15 Even if they have no particular desire to leave
assets to their heirs,16 many investors just hate the idea that
13. Forman & Sabin, Tontine Pensions, supra note 6, at 761. See, e.g., Youngkyun Park, Retirement Income Adequacy With Immediate and
Longevity Annuities, EBRI ISSUE BRIEF, No. 357, May 2011,
http://www.ebri.org/pdf/briefspdf/EBRI_IB_05-2011_No357_Annuities.pdf;
Common Retirement Risks, AMERIPRISE FIN.,
https://www.ameriprise.com/retirement/retirement-planning/common-retirement-risks/ (last visited Oct. 30, 2016).
14. SeeImmediate Annuities Update, ANNUITY SHOPPER BUYER’S GUIDE,
Jan. 2016, at 8, 17 tbl.5,
https://www.immediateannuities.com/pdfs/as/annuity-shopper-2016-01.pdf (showing average payments to a 65-year-old man of $545 per month, $6540 per year). Because women tend to live longer than men, the annual payments for a 65-year-old woman who elected an immediate, level-payment annuity as of December 1, 2015 would be only $6132, or 6.13% of the annuity’s purchase price (showing an average payment to 65-year-old woman of $511 per month). Id. Inflation-adjusted annuities offer an even better way to hedge against living too long. With inflation-adjusted annuities, annual payments would start out lower than level-payment annuities, but could end up higher. For example, if the hypothetical 65-year-old man in the last paragraph instead chose an annuity stream with a 3% annual escalator, the initial annual payment would be just $4728, but, eventually, the annual payments would exceed the $6540 per year fixed under the level-payment life annuity. Id. (showing average monthly payments to 65-year-old men with a 3%-cost-of-living adjustment of $394 per month in the first year of his retirement [$4728 in the first year]).
15. Forman & Sabin, Tontine Pensions, supra note 6, at 800.
2016 SURVIVOR FUNDS 209 an early death seems to benefit the insurance company.
Instead, many investors prefer to invest in stocks and bonds. Pertinent here, many investors buy bonds. While bonds can often be sold without penalty before they mature, many investors—especially retired investors—hold their bonds until maturity, and then they either reinvest or spend the proceeds as needed. In order to minimize interest-rate risk and increase liquidity, it can make sense to create a “laddered bond” portfolio where the bonds’ maturity dates are evenly spaced over several years so that bonds are maturing and being reinvested at regular intervals.17 For example, rather than
buying just one bond worth $100,000 that matures in ten years, a retiree might buy ten bonds worth $10,000 each that were laddered so that one bond matured in each of the next ten years.
All in all, there is a large demand for bonds,18 and there is
relatively little demand for lifetime annuities.19 That is where
ANNUITY DIGEST, http://www.annuitydigest.com/bequest-motive/definition
(last visited Oct. 30, 2016). People with a “bequest motive” value the prospect of leaving wealth to family, friends, or good causes. See, e.g., Lee M. Lockwood, Bequest Motives and the Annuity Puzzle, AMER.RISK &INS.ASSOC.
(Dec. 7, 2010), http://www.aria.org/meetings/2011%20papers/Bequest%20Motives%20and%2
0the%20Annuity%20Puzzle.pdf.
17. See, e.g., How and Why to Build a Bond Ladder, FIDELITY (Nov. 24,
2015), https://www.fidelity.com/viewpoints/bond-ladder-strategy.
18. For example, in 2014, there was $39,034 billion in outstanding U.S. bond market debt. US Bond Market Outstanding tbl. 2.1 (Outstanding U.S. Bond Market Debt, last updated Dec. 23, 2015) SIFMA (last visited Jan. 15, 2016),
http://www.sifma.org/uploadedFiles/Research/Statistics/StatisticsFiles/CM-US-Bond-Market-SIFMA.xls?n=27525. Also, in 2015, $6,436.9 billion in new U.S. bonds were issued. US Bond Market Issuance, Monthly tbl. 1.1 (Issuance in the U.S. Bond Markets, last updated Jan. 14, 2015) SIFMA (last
visited Jan.15, 2016),
http://www.sifma.org/uploadedFiles/Research/Statistics/StatisticsFiles/CM-US-Bond-Market-SIFMA.xls?n=27525.
19. In 2014, just $229.4 billion of annuities were sold in the U.S. IRI
Issues Fourth-Quarter and Year-End 2014 Annuity Sales Report, INSURED
RET.INST. (Mar. 25, 2015),
http://www.irionline.org/research/research-detail-view/iri-issues-fourth-quarter-and-year-end-2014-annuity-sales-report. On the relatively low demand for annuities, see, e.g., Shlomo Benartzi, Alessandro Previtero & Richard H. Thaler, Annuitization Puzzles, 25 J.
ECON. PERSP.143 (2011); Franco Modigliani, Life Cycle, Individual Thrift,
and the Wealth of Nations, 76 AM.ECON.REV. 297 (1986); Menahem E. Yaari,
survivor funds come in. As more fully described below, with a survivor fund, the investor would get a higher rate of return than she would get with a regular bond—as long she is willing to lose her investment if she does not survive until the survivor fund matures. As with regular bonds, an investor could hold a single survivor fund or a laddered portfolio of survivor funds. At bottom, with a survivor fund, an investor could take on some modest mortality risk over the short term of the survivor fund, as opposed to the lifetime mortality risk that comes from investing in a lifetime annuity.20
B. The Survivor Principle and a Simple Survivor
Fund
In a simple tontine, investors “contribute equally to buy a portfolio of investments that is awarded entirely to the last surviving member[;] [a]lternatively, each time a member of a tontine pool dies, her account balance could be divided among the surviving [investors].”21 “The key point is that variations
on the [survivor] principle—that the share of each, at death, is enjoyed by the survivors—can be used to create a variety of attractive” financial products, including survivor funds.22
1. A Simple Zero Coupon Bond
At the outset, imagine that 1000 otherwise identical 65-year-old men each contribute $1000 to an investment fund that invests $1,000,000 in 10-year zero coupon bonds, each with a 5% yield to maturity. At maturity in ten years, those bonds would have a maturity value of $1,628,894.63,23 and, at the end
ECON.STUD.137 (1965).
20. Here, we use the term “mortality risk” to refer to the risk that an investor will lose all or a portion of her investment because of death. There is relatively little risk that an investor will lose her investment over the short-term of a survivor fund. On the other hand, when an investor buys a lifetime annuity, she has a fairly high probability of dying before she has fully recovered her initial investment. See infra note 27 and accompanying text (explaining mortality gains and losses).
21. Forman & Sabin, Tontine Pensions, supra note 6, at 774. 22. Id.
2016 SURVIVOR FUNDS 211 of the 10-year period, each investor (or his heirs) would get
around $1629 on his $1000 investment.24
2. A Simple Survivor Fund Using the Individual-Cohort Method
Now imagine that we instead divide that $1,628,894.63, but only among the men who survived those ten years. For example, suppose that only 800 of our original group of 1000 men survived ten years to age 75.25 Then, each survivor would
get around $2036,26 while those who died during the term of
this survivor fund would lose their investments. That is, the “winners” who survived all ten years would have mortality
gains of around $407,27 while the “losers” who died during the
10-year period would have mortality losses of around $1629.28
In short, some “outran” the bear, and some got eaten.29
For the survivors, it is as if they earned a yield to maturity of around 7.37% on this survivor-fund investment rather than
http://www.financeformulas.net/Zero-Coupon-Bond-Effective-Yield.html#Calc-Header (last visited Oct. 31, 2016). $1,628,894.63 = $1,000,000 × (1.00 + 0.05).
24. $1628.89 = $1,628,894.63/1000. In this Article, computations involving money are usually rounded to the nearest penny, and many other computations are rounded to two digits after the decimal point.
25. At this point in the Article, suffice it to say that 20% is a very reasonable mortality rate, but see Part III, infra, for a discussion about what mortality tables are appropriate for survivor funds.
26. $2036.12 = $1,628,894.63/800.
27. $407.23 = $2036.12– $1628.89. “Individuals who invest in annuity-like products have mortality gains and losses depending on when they die. Individuals who live longer than their peers get mortality gains from those who precede them, while individuals who die earlier than their peers suffer mortality losses.” Forman & Sabin, Tontine Pensions, supra note 6, at 776 n.105 (citing David Blake, Annuity Markets: Problems and Solutions, 24
GENEVA PAPERS ON RISK &INS. 358, 371 (1999) (explaining that a mortality
cross-subsidy “arises because some annuitants will die shortly after taking out an annuity thereby releasing a ‘mortality profit’ which insurance companies share with longer-surviving annuitants . . . “). In the specific case of a survivor fund, individuals who survive to the end of the period get mortality gains from those who died during the period.
28. Regardless of when a loser dies, the amount he loses is $1628.89, the final value of his investment.
just the 5% earned on the underlying zero coupon bond.30 That
is, the survivors would get a 2.37% higher yield to maturity.31
Put differently, the yield to maturity for this survivor fund32
would be 47% higher than the yield to maturity on the underlying zero coupon bonds.33
The survivors cannot possibly do worse investing in this
survivor fund than they would by holding the underlying zero coupon bonds directly;34 and the more investors that die, the
better the survivors would do. In short, assuming that they survive, investors in a survivor fund have nothing to lose and everything to gain. For an investor with no “bequest motive”35
(e.g., no heirs) who currently buys and holds short-term bonds, buying a short-term survivor fund, instead, would make a lot of sense.36
We call the simple method that we used to create the hypothetical 65-year-old-man survivor fund above the “individual-cohort method.” A cohort is defined as a group of people who are the same age37 (and, perhaps, the same gender,
i.e., 65-year-old men). Theoretically, an investment company wishing to offer survivor funds could simply create a separate survivor fund for each and every cohort, just as we did for the 65-year-old-male cohort above.
30. 7.36935% = ($2036.12/$1000.00)0.1– 1.
31. 2.37% = 7.37% – 5.00%.
32. As this survivor fund is invested entirely in zero coupon bonds, we could call it a “survivor bond” instead.
33. 47.4% = (7.37% – 5.00%)/5.00%. Put differently, the survivors get 25% more from the survivor fund than from the underlying 5% zero coupon bonds. 1.25 = $2036.12/$1628.89. See also Jonathan Barry Forman & Michael J. Sabin, Using Survivor Funds to Boost 401(k) returns, PENSIONS &
INVESTMENTS (June 27, 2016, 12:01 AM),
http://www.pionline.com/article/20160627/ONLINE/160629917/using-survivor-funds-to-boost-401k-returns.
34. If, miraculously, none of the investors died during the 10-year bond period, all of the investors would get the 5.00% yield to maturity on the underlying zero coupon bonds.
35. See supra note 16 and accompanying text.
36. Almost all of the survivor fund examples in this Article refer to 10-year investment periods, and we refer to these investments as “short-term.” Of course, the same principles could be used to create survivor funds with longer or shorter durations.
37. Cohort, VOCUBULARY.COM,
2016 SURVIVOR FUNDS 213 These individual-cohort survivor funds would certainly be
fair to all investors, as each investor in a given survivor fund would be the same age (and, perhaps, the same gender), each investor would make the same initial contribution, and each survivor would get an equal share of from the accounts of the investors who died during the survivor-fund term. Unfortunately, the individual-cohort method has some practical problems.
C. Projecting Investment Outcomes for the Survivors
in a Survivor Fund Using the Individual-Cohort Method
At the outset, an individual-cohort survivor fund would have trouble accurately projecting the investment outcomes that the survivors could anticipate receiving. Under the individual-cohort method, the actual investment outcomes that the survivors would receive would depend on two principal factors: 1) the underlying performance of the investment assets; and 2) the actual mortality experience of the survivor-fund investors.38 These are discussed in turn.
1. The Underlying Performance of the Investment Assets
First, for now, there is not much to say about the underlying performance of the investment assets. While, in principle, a survivor fund could invest in anything from simple zero coupon bonds to complicated hedge funds,39 at this point in
38. Administrative costs could also play a role in investment outcomes, but we assume that these would be trivial. See infra Part V.B.2.
39. See infra Part V. See Hedge Fund, INVESTOPEDIA,
http://www.investopedia.com/terms/h/hedgefund.asp (last visited Nov. 7, 2016). The definition reads:
Hedge funds are alternative investments using pooled funds that may use a number of different strategies in order to earn active return, or alpha, for their investors. Hedge funds may be aggressively managed or make use of derivatives and leverage in both domestic and international markets with the goal of generating high returns (either in
the Article, it is simplest to assume that all of our hypothetical survivor funds would invest in 10-year zero coupon bonds with a 5% yield to maturity.40
2. The Actual (and Projected) Mortality Experience of Survivor-fund Investors
Second, however, there is a great deal to say about how the actual mortality experience of the survivor-fund investors will affect their actual investment outcomes. In that regard, in making a projection of the anticipated investment outcomes for survivors of a specific survivor fund, an investment company would have to make some assumptions about the mortality experience of the survivor-fund investors (based on some kind of mortality table), but—and this is critical—the actual
investment outcomes for the survivors will depend on the
actual mortality experience of the survivor-fund investors and
not on the investment company’s mortality assumptions. For example, in Part 2 above, we assumed that 1000 65-year-old men each invested $1000 in a 10-year survivor fund that invested in 10-year zero coupon bonds with a 5% yield to maturity, and we further assumed that 800 of them would live to age 75—that is, 200 would die before then. As a result, each of the 800 survivors got $2036 on their $1000 investments,41
which is a 47% larger yield to maturity than if they had instead invested $1000 directly in the underlying 5% zero coupon bonds.42
Pertinent here, if fewer than 200 investors had died during the 10-year term of that survivor fund, the survivor fund’s yield
an absolute sense or over a specified market benchmark). Because hedge funds may have low correlations with a traditional portfolio of stocks and bonds, allocating an exposure to hedge funds can be a good diversifier.
Id.
40. We note, in passing, that if the underlying investments in a survivor fund generated a higher-than-anticipated yield to maturity, the survivors would have better investment outcomes, and if the underlying investments generated a lower-than-anticipated yield to maturity, the survivors would have worse investment outcomes.
41. See supra note 26.
2016 SURVIVOR FUNDS 215 to maturity for the survivors would have been lower.43 On the
other hand, if more than 200 investors had died, the survivor fund’s yield to maturity would have been higher. To be sure, it is unlikely that exactly 200 investors would die, but it is incumbent upon the investment company to base its projected yield to maturity on the correct mortality table. After all, U.S. securities laws require that investment companies provide accurate information (and projections) to investors,44 and using
an incorrect mortality table for a given population of investors would result in inaccurate projections of the projected (and advertised) yields to maturity.
We have much more to say about how to select the correct mortality table when one is needed.45 For now, it is enough to
reiterate that the individual-cohort method’s reliance on mortality tables could lead to significant discrepancies between the projected and the actual investment outcomes for survivors.
D. The Individual-Cohort Method Would Require
Way Too Many Survivor Funds
To be sure, there is a much larger practical problem with the individual-cohort method: an investment company using the individual-cohort method would have to offer way too many
43. The effect of mortality experience is more fully discussed in Part III,
infra. See Table 12 and accompanying text.
44. See, e.g., What We Do, U.S.SEC.&EXCH.COMM’N (June 10, 2013),
http://www.sec.gov/about/whatwedo.shtml#.VQm1w010zPQ. The Commission states:
The laws and rules that govern the securities industry in the United States derive from a simple and straightforward concept: all investors, whether large institutions or private individuals, should have access to certain basic facts about an investment prior to buying it, and so long as they hold it. To achieve this, the SEC requires public companies to disclose meaningful financial and other information to the public. This provides a common pool of knowledge for all investors to use to judge for themselves whether to buy, sell, or hold a particular security. Only through the steady flow of timely, comprehensive, and accurate information can people make sound investment decisions.
Id.
different survivor funds. After all, in addition to having to offer different survivor funds for each and every age cohort (and possibly for each and every age-gender cohort), an investment company would also want to offer each investor a choice of investments. Some people would want to invest in government bonds, but others would want to invest in corporate bonds, large cap stocks,46 small cap stocks,47 global equities, real
estate, commodities, hedge funds, or other alternative investments.48
Moreover, not every investor would want to invest exactly the same amount. Some would want to invest $1000, but others would want to invest $10,000 or even $100,000. Furthermore, as the easiest way to design a survivor fund is to have all the investors come in at roughly the same time, an investment company would need to create new and separate survivor funds every month or, at least, every quarter. All in all, if an investment company tried to rely on the individual-cohort method, it could easily end up having to offer hundreds of different survivor funds. That would certainly drive up the company’s administrative costs, and it is likely that many of the survivor funds would be undersubscribed and have a very tough time performing as projected.
We believe that investment companies would want to offer a much smaller number of survivor funds, and in Parts II and
46. See Large Cap - Big Cap, INVESTOPEDIA,
http://www.investopedia.com/terms/l/large-cap.asp (last visited Nov. 6, 2016). “Large Cap - Big Cap” is a term used by the investment community to refer to companies with a “market capitalization value of more than $5 billion.” Id. Large cap is an abbreviation of the term “large market capitalization.” Id. “Market capitalization is calculated by multiplying the number of a company’s shares outstanding by its stock price per share.” Id.
47. See Small Cap, INVESTOPEDIA,
http://www.investopedia.com/terms/s/small-cap.asp (last visited Nov. 6, 2016). “Small Cap” refers to stocks with a “relatively small market capitalization.”
Id. “The definition of small cap can vary among brokerages, but it is generally a company with a market capitalization of between $300 million and $2 billion.” Id.
48. See Alternative Asset, INVESTOPEDIA,
http://www.investopedia.com/terms/a/alternativeassets.asp (last visited Nov. 6, 2016). “Alternative Asset” refers to any “non-traditional asset with potential economic value that would not be found in a standard investment portfolio.” Id. “Due to the unconventional nature of alternative assets, valuation of some of these assets can be difficult.” Id.
2016 SURVIVOR FUNDS 217 III below we offer some viable alternatives to the
individual-cohort method. Before moving on to our explanations of those alternatives, however, we will use the much-simpler individual-cohort method to explain the troublesome variability
in investment outcomes that would occur whenever a survivor fund has relatively few investors.49
E. The Statistics of Getting Survivor Funds to
Behave as Investors Expect
Investment companies offering survivor funds would very much want to assure investors that their survivor funds would have predictable outcomes. For example, an investment company might want to tell a 65-year-old man that, if he survives to age 75, his investment in a 10-year survivor fund would have a projected yield to maturity of, say, 7.6%, and that there would be a 95% chance that the actual yield to maturity would be in the range from 7.3% to 7.9% (i.e., 7.6% ± 0.3%). Unfortunately, because of the variability in mortality experience that would inevitably occur with any survivor fund that has relatively few investors, our hypothetical investment company would have a hard time relying on the individual-cohort method to achieve investment outcomes in that small of a range.50
49. See Variability, INVESTOPEDIA,
http://www.investopedia.com/terms/v/variability.asp (last visited Nov. 6, 2016). “Variability” refers to “the extent to which data points in a statistical distribution or data set diverge from the average, or mean, value as well as the extent to which these data points differ from each other. There are four commonly used measures of variability: range, mean, variance and standard deviation.” Id.
50. Depending on the underlying investments, variability in investment performance would also be an issue for survivor funds. To be sure, at this point in the Article, we are assuming that all survivor funds would invest in 5% zero coupon bonds. On the other hand, in Part V, infra, we explain how survivor funds could be designed to invest in all types of asset classes, many of which can be quite volatile. For now, it is enough to say that if the rates of return on the underlying investments are volatile, then investment outcomes would vary both because of variability in mortality experience and also because of that investment volatility. For example, if an investment company were to market a survivor fund that invested in small cap stocks instead of zero coupon bonds, the actual investment performance would be more variable, and it would be far less likely that 95% of the investment
This is a practical problem that is best understood in terms of some simple mathematics (statistics, to be precise). It comes down to this: with a small number of investors in a given survivor fund, the actual yields to maturity for the survivors could vary dramatically from the projected yield to maturity. That is where the law of large numbers comes into play.51 If
the number of investors in a survivor fund is large, then the actual mortality experience of the investors in that fund would tend to be very close to what was expected, and, as a result, the actual yield to maturity would tend to be very close to what was projected. On the other hand, if the number of investors is small, then the actual mortality experience of the investors would be likely to vary rather significantly from what was expected, and that would cause the actual yield to maturity to vary significantly from what was projected. Simply put, the more investors there are in a survivor fund, the smaller the variance from the projected yield to maturity.
At the outset, consider a hypothetical survivor fund with
100 65-year-old men, and assume that the mortality rates of these 100 men follow the 2010 Social Security Administration area population mortality table shown in Appendix Table 1.52
outcomes would fall within ± 0.3% of the expected rate of return on those small cap stocks.
51. See, e.g., Law Of Large Numbers, INVESTOPEDIA,
http://www.investopedia.com/terms/l/lawoflargenumbers.asp (last visited Jan. 11, 2016). A principle of probability and statistics which states that “as a sample size grows, its mean gets closer and closer to the average of the whole population.” Id. The law of large numbers in the financial context has a different connotation, which is that a “large entity which is growing rapidly cannot maintain that growth pace forever. The biggest of the blue chips, with market values in the hundreds of billions, are frequently cited as examples of this phenomenon.” Id.
52. Appendix Table 1 is drawn from the Social Security Administration’s 2010 period life table for the Social Security area population included in an e-mail from K. Mark Bye, Soc. Sec. Admin., to Jonathan Barry Forman (Dec. 3, 2014, 10:03 a.m. EST) (on file with authors). Cf.Actuarial
Life Table, SOC. SEC. ADMIN. (2013),
https://www.ssa.gov/oact/STATS/table4c6.html (last visited Nov. 6, 2016). The 2013 table states:
A period life table is based on the mortality experience of a population during a relatively short period of time. Here we present the 2013 period life table for the Social Security area population. For this table, the period life expectancy at
2016 SURVIVOR FUNDS 219 Loosely speaking, that table suggests that 21.59% of
65-year-old men are expected to die before reaching age 75.53
Obviously, in a group of 100 men, it is not possible for exactly 21.59% of them to die, since the number of deaths must be a whole number; for example, twenty-one of the men could die, or twenty-two, but not 21.59. Indeed, it is possible that the number of deaths could be any whole number in the range from zero to 100. Of course, the number of deaths is likely to be some whole number close to 21.59. In that regard, Figure 1 shows that the number of deaths over the 10-year term of this survivor fund would take the approximate form of a normal
distribution54 around the mean value of 21.59,55 and we will
a given age is the average remaining number of years expected prior to death for a person at that exact age, born on January 1, using the mortality rates for 2013 over the course of his or her remaining life.
Id.
53. Appendix Table 1 implies that of the 100,000 live male births in the table, 80,729 made it to age 65 and 63,300 of them made it to age 75. That is, 17,429 (21.58952%) of the 80,729 men alive at age 65 would die before reaching age 75 (17,429 = 80,729 – 63,300; 21.58952% = 17,429/80,729). We say “implies” because the table only offers one-year death probabilities, and while we think that this footnote offers a reasonable way to approximate the 10-year death probability for 65-year-old men, we assume that, if called upon to do so, the actuaries would use a much better approach and get a slightly different number. An individual’s (one-year) death probability is his probability of dying within one year. For example, Appendix Table 1 shows that a 65-year-old male has a 1.6% chance of dying before his next birthday (death probability, qi, of 0.015927).
54. Normal Distribution, INVESTOPEDIA,
http://www.investopedia.com/terms/n/normaldistribution.asp (last visited Nov. 6, 2016). “Normal Distribution” is “the probability distribution that plots all of its values in a symmetrical fashion, and most of the results are situated around the probability’s mean.” Id. “Values are equally likely to plot either above or below the mean. Grouping takes place at values that are close to the mean and then tails off symmetrically away from the mean.” Id. A “Normal Distribution” is also known as the Gaussian distribution or “bell curve.” Id. See also Deborah J. Rumsey, How to Find the Normal
Approximation to the Binomial with a Large Sample N, DUMMIES,
http://www.dummies.com/how-to/content/how-to-find-the-normal-approximation-to-the-binomi.html (last visited Nov. 6, 2016).
55. See, e.g., Arithmetic Mean, INVESTOPEDIA,
http://www.investopedia.com/terms/a/arithmeticmean.asp (last visited Nov. 6, 2016). “The arithmetic mean is a mathematical representation of the typical value of a series of numbers, computed as the sum of all the numbers in the series divided by the count of all numbers in the series. The arithmetic mean is sometimes referred to as the average or simply as the mean.” Id.
work with such fractional numbers throughout this Article.
With 100 65-year-old men, the standard deviation56—
which is a measure of the dispersion of the number of deaths about the mean—is 4.11.57 In a normal distribution, 95.45% of
56. The standard deviation is a mathematical measure of variance. Literally, the standard deviation is the square root of the variance, and the variance is the average of the squared differences between population values and their mean. See, e.g., Standard Deviation and Variance, MATH IS FUN,
http://www.mathsisfun.com/data/standard-deviation.html (last visited Nov. 6, 2016); see also Standard Deviation, INVESTOPEDIA,
http://www.investopedia.com/terms/s/standarddeviation.asp (last visited Nov. 6, 2016). “Standard deviation is a measure of the dispersion of a set of data from its mean.” Id. The more spread apart the data, the higher the deviation. Id. “Standard deviation is calculated as the square root of variance. . . .” Id.
57. Calculated using the formula for the standard deviation of a binomial distribution: 4.11445 = σ = √(np(1 – p) = (np(1 – p))0.5 = (100 × 0.2159
× (1 – 0.2159))0.5,where n is the sample size and p is the individual
probability.
0
10
20
30
40
Number of Deaths
Figure 1. Probability Density of Number of
Deaths Over 10 Years for a Group of
100
65-year-old Men
Shaded Area is
95% Probability
Range
(from 13.37 to
29.81)
2016 SURVIVOR FUNDS 221 the outcomes fall within two standard deviations of the mean;
that is, there is a 95.45% probability that the actual number of deaths in a 100-man sample would be in the range from 13.37 to 29.81.58 For ease of wording, however, we will usually
abbreviate “95.45%” as “95%” and the “95.45% range” as the “95% range.” In summary, for our hypothetical 100 -65-year-old-man survivor fund, we project that the mean number of deaths will be 21.59 and that there is a 95% probability that the number of deaths occurring will be in the range from 13.37 to 29.81.
Continuing with our hypothetical example, we further assume that each of the 100 65-year-old men invested $1000 in a survivor fund that would hold 10-year zero coupon bonds with a 5% yield to maturity, so that the value of each man’s original investment would grow to $1628.89 at the end of the 10-year survivor-fund term. As we projected that 21.59 of those men would die during the 10-year term of the zero coupon bonds, the 78.41 men who survived the ten years would have a projected mortality-gain distribution of $448.51,59 and,
therefore, we project that each of the survivors would collect $2077.40 at that time ($2077.40 = $1628.89 + $448.51). Figure 2 shows the near-normal distribution of the projected mortality-gain distributions for the survivors of this survivor fund.60
58. Two standard deviations below the mean is 13.37 = 21.59 – (2 × 4.11), and two standard deviations above the mean is 29.81 = 21.59 + (2 × 4.11).
59. $448.51 = (21.59 × $1628.89)/78.41. Recall that in supra note 53, we showed that 21.59% of 65-year-old men are expected to die before reaching age 75, which means that 78.41% are expected to survive. 21.59 = 100 × 21.59%; 78.41 = 100 × 78.41%; 78.41% = 100% – 21.59%.
60. The formula for mortality-gain distributions is $1628.89 × d/(100 –
d), where d is the number of deaths. As we discussed in note 52 and accompanying text, the number of deaths (d) is normally distributed. See
supra Figure 1. On the other hand, the function (d/(100 – d)) is not normally
Figure 2 also shows the 95% range of mortality-gain distributions, based on the 95% range of deaths from Figure 1 (from 13.37 to 29.81 deaths). At one end of the 95% range, if there were 13.37 deaths, then each of the 86.63 survivors would receive a mortality-gain distribution of $251.39.61 At the
other end of the 95% range, if there were 29.81 deaths, then each of the 70.19 survivors would receive a mortality-gain distribution of $691.80.62 In summary, the investment
company could fairly advertise that there would be a 95%
61. $251.39 = (13.37 × $1628.89)/86.63; 86.63 = 100 – 13.37. 62. $691.80 = (29.81 × 1628.89)/70.19; 70.19 = 100 – 29.81.
$0
$200
$400
$600
$800
$1,000
Mortality-gain Distribution
Figure 2. Probability Density of
Mortality-gain Distribution for the Survivors of an
Individual Cohort of
100
65-year-old Men
Shaded Area is
95% Probability
Range
2016 SURVIVOR FUNDS 223 probability that survivors would receive a mortality-gain
distribution of from $251 to $692.
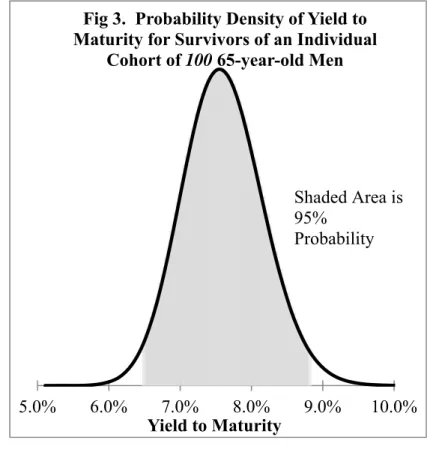
Finally, the investment company could also express these survivor-fund investment outcomes in terms of yields to maturity on the survivor’s original $1000 investments. That is, the investment company could fairly advertise that investors could anticipate a projected yield to maturity of around 7.59%63
and that there would be a 95% probability that those survivors would receive a yield to maturity of from 6.5% to 8.8%.64 See
Figure 3.
63. 7.58507% = (($1628.89 + $448.51)/$1000.00)0.1 – 1. Recall that the
projected yield to maturity happens when the actual mortality-gain distribution equals the projected mortality-gain distribution. See supra note 59 and accompanying text (for $1628.89 and $448.51).
64. 6.51782% = (($1628.89 + $251.39) /1000.00)0. – 1; 8.78317% =
(($1628.89 + $691.80) /1000.00)0.1 – 1.
5.0%
6.0%
7.0%
8.0%
9.0%
10.0%
Yield to Maturity
Fig 3. Probability Density of Yield to
Maturity for Survivors of an Individual
Cohort of
100
65-year-old Men
Shaded Area is
95%
Unfortunately, 6.5% to 8.8% is a rather large 95%-yield-to-maturity range for an investment company that is trying to promote an investment product. This 95%-yield-to-maturity range is large because, with only 100 investors, the standard deviation of the number of deaths (4.11) is sizable relative to the mean number of deaths (21.59). If the survivor fund could attract more than 100 investors, however, the 95%-yield-to-maturity range would shrink. Basically, the larger the sample size, the smaller the standard deviation of the sample.65 For
example, with 1000 65-year-old men, the 95%-yield-to-maturity range would shrink to just 7.2% to 7.9%.66 More generally,
Figure 4 shows how the 95%-yield-to-maturity range would shrink as the number of 65-year-old male investors in a survivor fund using the individual-cohort method increases.
65. The formula is σS = σ/√n, where σS is the standard deviation of the sample, σ is the standard deviation of the population, and n is the sample size. See, e.g., Douglas G. Altman & J Martin Bland, Standard Deviations
and Standard Errors, 331 BRITISH MED. J. 7521 (2005),
http://www.ncbi.nlm.nih.gov/pmc/articles/PMC1255808/; Deborah J. Rumsey,
How Sample Size Affects Standard Error, DUMMIES,
http://www.dummies.com/how-to/content/how-sample-size-affects-standard-error.html (last visited Nov. 6, 2016).
66. For 1000 65-year-old male investors, the mean number of deaths would be 215.9, and the standard deviation of the number of deaths would be 13.01 = (1000 × 0.2159 × (1 – 0.2159))0.5. Two standard deviations below the
mean would be 189.88 = 215.9 – (2 ×13.01), for a lower mortality-gain distribution of $381.79 = 189.88/(1000 – 189.88) × $1628.89, and a lower yield to maturity of 7.23444% = (($1628.89 + $381.79)/$1000.00)0.1 – 1. Two
standard deviations above the mean would be 241.92 = 215.9 + (2 × 13.01), for an upper mortality-gain distribution of $519.81 = 241.92/(1000 – 241.92) × $1628.89, and an upper yield to maturity of 7.94874% = (($1628.89 + $519.81)/$1000.00)0.1 – 1.
2016 SURVIVOR FUNDS 225
It seems reasonable to conclude from Figure 4 that a survivor fund using the individual-cohort method could operate with as few as 500 identical investors; that is to say that the 95%-yield-to-maturity range for such a fund would be acceptably narrow. Still, we doubt that investment companies would want to offer a different survivor fund for each age-gender cohort, nor would they want to require that each investor put in exactly the same amount in exactly the same type of investment. For example, we would be surprised if an investment company could even find 500 73-year-old women who were willing to each invest exactly $1000 in the 10-year survivor fund that started on May 1, 2017 and that invested in small cap stocks. We doubt that any investment company would be willing to take on that kind of marketing risk.
Instead, we believe that investment companies offering survivor funds would want to offer just a few different survivor funds for investors each month (or quarter). To reduce the number of survivor funds that an investment company would
6.0%
6.5%
7.0%
7.5%
8.0%
8.5%
9.0%
0
5000
10000
Y
ield to Maturity
Number of Members
Figure 4. Yield-to-maturity Range for Survivors
of an Individual Cohort of 65-year-old Men
Likely Range of Yield to Maturity
(95% Probability)
need to offer, we need to find a fair way to combine different cohorts of investors together into the same survivor fund, and we also need to find a fair way to combine investors who make different levels of investment.
Ideally, then, separate survivor funds should not be created based on individual investor characteristics like age, gender, or investment amount. Instead, separate survivor funds should combine various cohorts of investors, but be designed only to offer different kinds of underlying investments. For example, we can imagine that each month an investment company would offer a handful of 10-year survivor funds where each fund invested in different assets, such as government bonds, corporate bonds, large cap stocks, small cap stocks, and so on. The individual-cohort method could not be used to fairly reallocate mortality gains in such multi-cohort survivor funds, but both the date-aligned method that we discuss in Part II below and the age-aligned method that we discuss in Part IV below could be used to achieve such fair reallocations.
II. DESIGNING SURVIVOR FUNDS THAT ARE FAIR TO
ALL TYPES OF INVESTORS:THE DATE-ALIGNED
METHOD
In a simple survivor fund, when an investor dies, the balance in her account (i.e., her contribution plus investment earnings) would be divided equally among the surviving investors. Unfortunately, if the survivor fund included a variety of investors, that approach would result in an unfair situation, for example, because it would favor younger investors who are likely to live longer and receive more mortality-gain distributions. On the contrary, if a survivor fund has investors with different ages, genders, and investment levels, “the surviving investors should not get equal portions of a dying member’s balance. Instead, the [mortality-gain] distributions should be made in unequal portions, carefully chosen to provide fair bets for all investors. In short, a [survivor] fund should be governed by a fair transfer-plan
2016 SURVIVOR FUNDS 227 probability)67 and investment level.”68 In this Part, we describe
how such survivor funds could be designed.
The Basic Design and Operation of a Survivor Fund: The Date-Aligned Method
This subpart explains in greater detail the basic design and operation of survivor funds. More specifically, this subpart develops the so-called “date-aligned method” that can be used to design survivor funds that are fair to a broad range of investors, including those with different ages, genders, and investment levels.69
At the outset, Table 1 shows the membership of a simple survivor fund. To keep this initial example as simple as possible (and also to keep it consistent with the simple, single-cohort survivor fund that we described in Part 2 above), we assume: 1) that there are just ten investors in this survivor fund; 2) that each member (i) is a 65-year-old male who has contributed $1000 (ci) to an account that invests in 10-year zero
coupon bonds; and 3) that each zero coupon bond has a 5% yield to maturity leading to a final account value (si) for each
member of $1628.89.70 That $1628.89 is the amount that each
member would receive after ten years if none of the ten investors died. We do not have to worry about the value of the account at any intermediate time; it suffices (and it is more convenient) to just work with the account value at maturity (i.e., t = 10).
67. The term “fair transfer-plan” is derived from Sabin, supra note 12, at 5. See also Forman & Sabin, Tontine Pensions, supra note 6, at 776. Recall that an individual’s death probability is his probability of dying within one year. See supra note 54 and accompanying text.
68. Forman & Sabin, Tontine Pensions, supra note 6, at 776 (emphasis added).
69. The approach parallels what we did in Forman & Sabin, Tontine
Pensions, supra note 6, at 776-84.
Table 1. A Simple Survivor Fund with Ten 65-year-old Male Members Member (i) Age (xi) Gender (gi) Contribution (ci) Account Value at Maturity (si) 1 65 male $1000 $1628.89 2 65 male $1000 $1628.89 3 65 male $1000 $1628.89 4 65 male $1000 $1628.89 5 65 male $1000 $1628.89 6 65 male $1000 $1628.89 7 65 male $1000 $1628.89 8 65 male $1000 $1628.89 9 65 male $1000 $1628.89 10 65 male $1000 $1628.89
The survivor fund starts with the members all making their contributions at time 0, and nothing happens until the end of the 10-year investment term (i.e., until the maturity date of the underlying zero coupon bonds). At that time (i.e., time 10), the survivor fund will create a fair transfer-plan to reallocate the balances in the accounts of any members who died before time 10 among the survivors in a way that provides fair bets for all of the members.
For example, suppose that two of the ten members (20%) died during the 10-year-survivor-fund term.71 At time 10, we
would reallocate the $1628.89 in the accounts of those two decedents, one at a time, and in the order that their deaths occurred. We call this the “date-aligned method,” and here is how it would work:
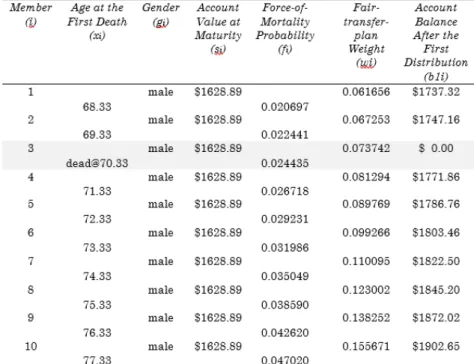
Suppose that member 3 was the first member to die and that his death occurred 3.33 years after the start of the survivor fund (when all ten members of the survivor fund were 68.33 years-old, 68.33 = 65 + 3.33). Since this would be the first death to occur, all ten members would compete equally in the first fair plan, and we would use that fair
transfer-71. Again, 20% is a very reasonable mortality rate for a population of 65-year-old men. See supra note 25 and accompanying text, and recall that we showed in supra note 53 that approximately 21.59% of 65-year-old men in the 2010 Social Security area population mortality table could be expected to die before reaching the age of 75.
2016 SURVIVOR FUNDS 229 plan to distribute dying member 3’s $1628.89 to the nine
survivors. Table 2 shows the results after that first death.
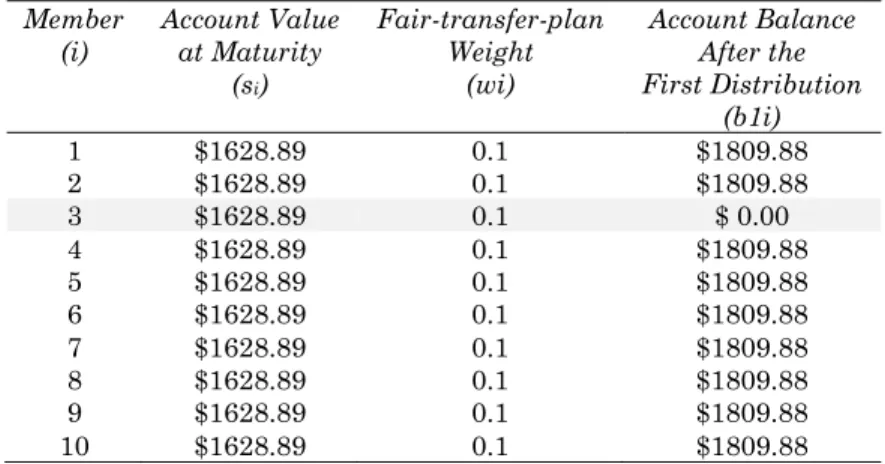
Table 2. Accounting for the First Death, Date-aligned Method Member
(i) Account Value at Maturity (si) Fair-transfer-plan Weight (wi) Account Balance After the First Distribution (b1i) 1 $1628.89 0.1 $1809.88 2 $1628.89 0.1 $1809.88 3 $1628.89 0.1 $ 0.00 4 $1628.89 0.1 $1809.88 5 $1628.89 0.1 $1809.88 6 $1628.89 0.1 $1809.88 7 $1628.89 0.1 $1809.88 8 $1628.89 0.1 $1809.88 9 $1628.89 0.1 $1809.88 10 $1628.89 0.1 $1809.88
Column 1 of Table 2 shows the member (i) and column 2 shows the account value in that member’s account at maturity (si).72 Column 3 of Table 2 shows a parameter that we call the
fair-transfer-plan weight (wi). When a member of a survivor
fund dies, the maturity value of his account is forfeited and divided among the survivors, with each survivor receiving some fraction of the decedent’s account which is based on that survivor’s fair-transfer-plan weight (wi).
More specifically, if member j dies, each surviving member
i would receive some fraction of j’s $1628.89 account value at maturity. Mathematically, the fraction that each member i
would receive of member j’s account (sj) is equal to wi/(1 – wj),
for i ≠ j. The fair-transfer-plan weights (wi) are positive values
that sum to one, so the denominator (1 – wj) is the sum of all
fair transfer-plan weights (wi) except that of member j.
Meanwhile, member j would forfeit all $1628.89 in his account. Pertinent here, since all ten members in our simple survivor fund were the same age when member 3 died (68.33 years-old), the same gender (male), and made the same contribution ($1000), all ten members would have the same fair-transfer-plan weight, wi = 0.1 = 1/10 (see column 3 of Table
2). Accordingly, at time 10, when it is time to divide the $1628.89 in member 3’s account among the nine members who survived him, each of those nine survivors would receive $180.99 = s3 × wi/(1 – w3) = $1628.89 × 0.1/(1 – 0.1),73 and, of
course, member 3 would forfeit the $1628.89 in his account. In short, each of the nine survivors would get a mortality gain of $180.99 and would enter the next distribution with an account balance after the first distribution (b1i) of $1809.88 = $1628.89 + $180.99 (see column 4 of Table 2).74 We refer to the $180.99
distributions to members 1, 2, and 4-10 as mortality-gain
distributions; meanwhile, member 3 had a $1628.89 mortality
loss.
Now suppose that member 7 was the second member to die and that his death occurred 6.67 years after the start of the survivor fund (when the nine surviving members of the survivor fund were 71.67 years-old (71.67 = 65 + 6.67). As before, we would create a fair transfer-plan, but this time just for the nine members who survived to age 71.67. Those nine survivors would compete equally in the second fair transfer-plan, and we would use that fair transfer-plan to reallocate dying member 7’s $1809.88 to the eight members who survived him. Table 3 shows the results after that second mortality-gain distribution.
73. Put differently (and, perhaps, more simply), $180.99 is $1628.89 divided equally among the nine identical survivors ($180.99 = $1628.89/9).
2016 SURVIVOR FUNDS 231
Table 3. Accounting for the Second Death, Date-aligned Method
Member
(i) Account Balance After the First Distribution (b1i) Fair-transfer-plan Weight (wi) Account Balance After the Second Distribution (b2i) 1 $1809.88 0.111111 $2036.11 2 $1809.88 0.111111 $2036.11 3 $ 0.00 [email protected] $ 0.00 4 $1809.88 0.111111 $2036.11 5 $1809.88 0.111111 $2036.11 6 $1809.88 0.111111 $2036.11 7 $1809.88 0.111111 $ 0.00 8 $1809.88 0.111111 $2036.11 9 $1809.88 0.111111 $2036.11 10 $1809.88 0.111111 $2036.11
Column 1 of Table 3 shows the member (i), and column 2 of Table 3 shows the value of each member’s account balance after the first distribution (b1i).75 Column 3 of Table 3 shows
the applicable fair-transfer-plan weights (wi) for each of the
nine members who survived until time 6.67. As all nine surviving members were the same age when the second member died (71.67 years-old), the same gender (male), and have the same balances in their account after the first mortality-gain distribution (b1i = $1809.88); all nine have the same fair transfer-plan weight, wi = 0.111111 = 1/9.
Accordingly, at time 10, when it is time to divide the $1809.88 in member 7’s account among the remaining eight members who survive him, each of those eight survivors will receive a mortality-gain distribution of $226.23 = b17 × wi/(1 – w7) =
$1809.88 × 0.111111/(1 – 0.111111),76 and each ends up with an
account balance after the second distribution (b2i) of $2036.11 = $1809.88 + $226.23 (see column 4 of Table 3).77 Of course,
member 7 would forfeit his $1809.88 and end up with a zero account balance (see column 4 of Table 3).
75. These values come from column 4 of Table 2.
76. Put differently (and, perhaps, more simply), $226.243 is $1809.88 divided equally among the eight remaining survivors ($226.235 = $1809.88/8).
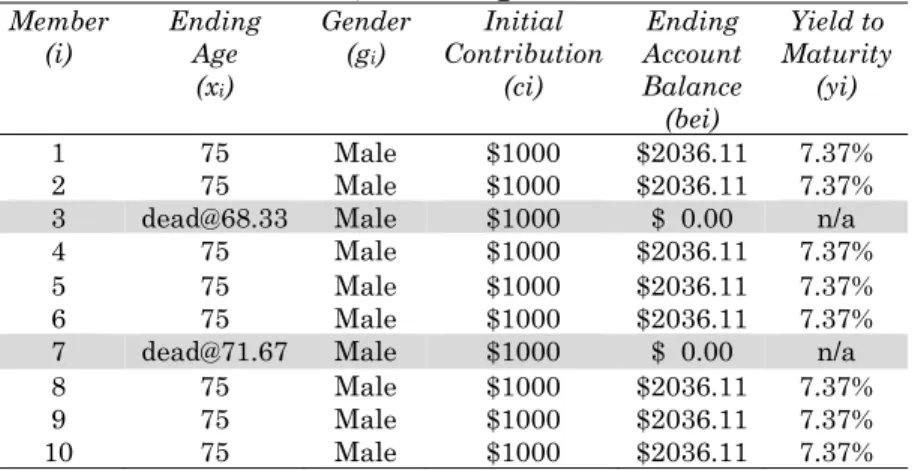
As we assumed that there were no further deaths during the 10-year survivor-fund term, that $2036.11 account balance after the second distribution (b2i) would also be the ending account balance (bei) for the eight surviving members (see column 5 of Table 4), and each of these eight survivors would have that $2036.11 distributed to them at that time (again, at t
= 10). Column 6 of Table 4 also shows that the yield to maturity (yi) for these eight survivors would be 7.37%, as opposed to the 5% yield to maturity on the underlying zero coupon bonds.78
Table 4. The End of a 10-man Survivor Fund with Eight Survivors, Date-aligned Method
Member
(i) Ending Age
(xi) Gender (gi) Initial Contribution (ci) Ending Account Balance (bei) Yield to Maturity (yi) 1 75 Male $1000 $2036.11 7.37% 2 75 Male $1000 $2036.11 7.37%
3 [email protected] Male $1000 $ 0.00 n/a 4 75 Male $1000 $2036.11 7.37%
5 75 Male $1000 $2036.11 7.37%
6 75 Male $1000 $2036.11 7.37%
7 [email protected] Male $1000 $ 0.00 n/a
8 75 Male $1000 $2036.11 7.37%
9 75 Male $1000 $2036.11 7.37%
10 75 Male $1000 $2036.11 7.37%
Not surprisingly, with this group of investors who are identical in age, gender, and investment level, the date-aligned method reaches the exact same results as the individual-cohort method would. More specifically, the date-aligned method here got the same $2036 ending account balance and the same 7.37% yield to maturity that we found in Part 2 above (where we divided the $1,628,894.63 proceeds from $1,000,000 worth of 10-year, zero coupon bonds among the 800 survivors of that
1000-65-year-old-man, individual-cohort survivor fund).79
Indeed, both the individual-cohort method and the date-aligned method would result in fair reallocations any time all of
78. 7.36930% = ($2036.11/$1000.00 )0.1 – 1.
79. There is a one-cent difference in the ending account balances here ($2036.11) and there ($2036.12) due to rounding of intermediate calculations.
2016 SURVIVOR FUNDS 233 the survivor-fund members are identical (i.e., have the same
age and gender and have made exactly the same level of contributions). As we will see in the next few subparts of this Article, however, only something like the date-aligned method that we developed in this subpart could be used to achieve fair reallocations when members of a survivor fund have different ages, genders, or investment levels.
Survivor Funds Using the Date-Aligned Method Would Be Fair to Investors of Different Ages
This subpart shows that survivor funds using the date-aligned method would be fair to investors of different ages. For example, Table 5 shows another 10-man survivor fund. We again assume that each member (i) has invested $1000 (ci) in
the survivor fund and that the survivor fund invests in zero coupon bonds that mature in ten years with a 5% yield to maturity for a final value at maturity for each member of $1628.89 (si), but, this time, our ten male investors are different
ages. This survivor fund again starts at time 0, and nothing happens until the end of the 10-year, survivor-fund term. At that time (time 10), the survivor fund would again use a fair transfer-plan to reallocate the balances in the accounts of the members who died before time 10 among the survivors.
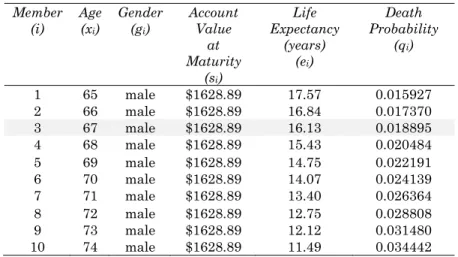
Table 5. A Survivor Fund with 10 Male Members of Different Ages, Date-aligned Method
Member (i) Age (xi) Gender (gi) Account Value at Maturity (si) Life Expectancy (years) (ei) Death Probability (qi) 1 65 male $1628.89 17.57 0.015927 2 66 male $1628.89 16.84 0.017370 3 67 male $1628.89 16.13 0.018895 4 68 male $1628.89 15.43 0.020484 5 69 male $1628.89 14.75 0.022191 6 70 male $1628.89 14.07 0.024139 7 71 male $1628.89 13.40 0.026364 8 72 male $1628.89 12.75 0.028808 9 73 male $1628.89 12.12 0.031480 10 74 male $1628.89 11.49 0.034442
Because our members are different ages, however, we would use death probabilities from a mortality table to create the fair transfer-plan.80 As a starting point, column 2 of Table
5 shows the age (xi) of each man, column 5 shows his initial life
expectancy at that age (ei),81 and column 6 shows his death
probability (qi) at that age. These values are drawn from the
2010 Social Security Administration area population mortality table in Appendix Table 1. For example, member 3 in Table 5 is a 67-year-old man (columns 2 & 3) who has a life expectancy (ei) of 16.13 years (column 5) and a 1.9% chance of dying before
reaching age 68 (column 6; i.e., a death probability, qi, of
0.018895).
To make comparisons easy, we again assume that two members of this survivor fund would die over the 10-year survivor-fund term:82 member 3 would die at time 3.33, and
member 7 would die at time 6.67. We again use the
date-80. Recall that an individual’s death probability is his probability of dying within the next year. See supra note 53 and accompanying text.
81. Recall that life expectancy at a given age is the average remaining number of years expected prior to death for a person at that exact age. See
supra note 52 and accompanying text.
82. We note, in passing, that this example is not quite as reasonable as the one in Part I.A (Table 1): given the relatively older population in the survivor fund in Table 5, it is likely that more than two (out of 10) members would die over the 10-year, survivor-fund term.
2016 SURVIVOR FUNDS 235 aligned method that we developed in Part I.A. As all ten
members would be alive when the first death occurs at time 3.33, all ten would compete in the first fair transfer-plan, and we would again create a fair transfer-plan to reallocate dying member 3’s $1628.89 to the nine survivors. Table 6 shows the results after that first mortality-gain distribution.
Table 6. Accounting for the First Death in a Survivor Fund with Members of Different Ages, Date-aligned Method
Column 1 of Table 6 shows the member (i), and column 2 shows the ages of the members at the time of the first death (t
= 3.33), ranging from 68.33-years-old for member 1 (68.33 = 65 + 3.33) to 77.33-years-old for member 10 (77.33 = 74 + 3.33). Column 4 of Table 6 shows the $1628.89 account value at maturity (si) for each of the founding investors in this survivor
fund.
Pertinent here, as the ten members are different ages, they should have different fair-transfer-plan weights. In general, a fair transfer-plan should reallocate more of each decedent’s mortality losses to older survivors than to younger survivors