University of Kentucky
UKnowledge
Agriculture and Natural Resources Publications
Cooperative Extension Service
1-2015
Organic Corn Production in Kentucky
Michael Bomford
Kentucky State University
Lee Meyer
University of Kentucky, lmeyer@uky.edu
Thomas Sikora
University of Kentucky, tom.sikora@uky.edu
William Martin
University of Kentucky
Sam McNeill
University of Kentucky, sam.mcneill@uky.edu
See next page for additional authors
Right click to open a feedback form in a new tab to let us know how this document benefits you.
Follow this and additional works at:
https://uknowledge.uky.edu/anr_reports
Part of the
Agriculture Commons
, and the
Environmental Sciences Commons
This Report is brought to you for free and open access by the Cooperative Extension Service at UKnowledge. It has been accepted for inclusion in Agriculture and Natural Resources Publications by an authorized administrator of UKnowledge. For more information, please contact
UKnowledge@lsv.uky.edu.
Repository Citation
Bomford, Michael; Meyer, Lee; Sikora, Thomas; Martin, William; McNeill, Sam; Montross, Michael D.; Ritchey, Edwin L.; and Lee, Chad, "Organic Corn Production in Kentucky" (2015).Agriculture and Natural Resources Publications. 172.
Authors
Michael Bomford, Lee Meyer, Thomas Sikora, William Martin, Sam McNeill, Michael D. Montross, Edwin L. Ritchey, and Chad Lee
COOPERATIVE EXTENSION SERVICE
UNIVERSITY OF KENTUCKY COLLEGE OF AGRICULTURE, FOOD AND ENVIRONMENT, LEXINGTON, KY, 40546
Organic Corn Production
I N K E N T U C K Y
Organic Corn Production in Kentucky
Michael Bomford, Kentucky State University; Lee Meyer, Thomas Sikora, and William Martin,UK Agricultural Economics; Sam McNeill and Mike Montross, UK Biosystems and Agricultural Engineering; and Edwin Ritchey and Chad Lee, UK Plant and Soil Sciences
Cover photo: William Martin
Introduction...5
Organic Farm Planning under the USDA’s National Organic Program ...5
The Organic Corn Marketplace ...7
Profitability of Organic Corn Production ...8
Marketing Organic Corn ... 13
Organic Corn Crop Management ...14
Fertility Management for Organic Corn Production ...17
Harvesting, Drying and Storing Organic Corn ... 22
T
he number of organic dairy cows in Kentucky has been steadily in-creasing for years, yet there’s not enough organic corn produced in the state to feed the growing herds. In fact, most of the organic corn consumed in Kentucky is produced outside of the state. The growing organic livestock and poultry industries in Kentucky face the same feed constraints. In short, a new market has developed in the state, but few local farmers are taking advantage of it. Kentucky farmers are no strangers to corn, but the mere mention of organic corn often elicits strange looks. While the image of a hand-hoe and a backyard garden might come to mind for some, the reality is that most organic cornfields are virtually indistinguishable from their neighboring conventional cornfields.Growing corn organically, however, uti-lizes different management, cultural and marketing practices and requires new skills. And, importantly, organic produc-tion must follow an approved farm plan that allows farmers to sell their corn as certified organic.
Transitioning to organic production can be a challenging undertaking, but it comes with its rewards. The price of certified organic corn is consistently 1.5 to 2.0 times the price of conventional corn. Unfortunately, that does not mean that an organic corn farm is 1.5 to 2 times as profitable as a conventional farm. Managing weeds and soil fertility can be difficult, often requiring additional labor. Even with additional labor, most organic farms do not match the yields of their conventional counterparts. And
organic corn is just one element of a lon-ger rotation. Nevertheless, many studies have shown that it can be more profitable than conventional production. It is an especially viable enterprise for those who are constrained by land and are looking for ways to intensify their production. This publication is designed to be both an introduction to a new enter-prise as well as a practical manual for those interested in pursuing organic corn production on their own farms. Pertinent topics are organized into seven individual sections: organic certification, the organic corn marketplace, market-ing, profitability management, fertility, and post-harvest handling. Additionally, readers who wish to do further research on the subject will find a collection of resources listed in the last chapter.
Introduction
William Martin, UK Agricultural Economics
Organic Farm Planning under the USDA’s National Organic Program
Michael Bomford, Kentucky State UniversityT
he United States Department of Agriculture (USDA) has regulated organic agriculture since 2002. By federal law, farmers growing organic products for sale in the U.S. must develop and follow a farm plan that responds “to site-specific conditions by integrating cultural, biological, and mechanical practices that foster cycling of resources, promote ecological balance, and con-serve biodiversity.”In other words, a detailed and unique plan is tailored to each organic farm. The plan includes cultural aspects of the operation, such as row spacing and orien-tation, cultivation, or irrigation methods. It considers the organisms used on the farm, through crop rotation, variety selection, habitat for beneficial insects, and even the microbes introduced for nitrogen fixation or biological control. Finally, it considers the mechanical tools and equipment used, such as cultivators, mowers, seeders, and harvesters. All
aspects of the farm plan are supposed to work together to reduce the farm’s de-pendence on external inputs by retaining nutrients and working with renewable resources such as sunlight, soil, wind, and rainfall. The farm is intended to host a diverse array of living things, including abundant soil life, a complex cropping system, and healthy populations of ben-eficial organisms to keep pests in check. In these ways, organic farms are intended to mimic natural ecosystems.
A USDA-accredited organic certifier must approve the farm plan and inspect the farm every year. The only exemp-tion is for farms selling less than $5,000 worth of organic products through direct market channels. These exempt operations do not have to submit a writ-ten farm plan but must still adhere to all other requirements of the federal organic standards. They cannot use the USDA Organic seal. The Kentucky Department of Agriculture (KDA) requires
registra-tion of organic farms based in Kentucky that claim exempt status. Those who sell products as organic in violation of federal law can be fined up to $11,000 and excluded from the national organic program for up to five years.
The KDA is the only USDA-accredited organic certifier based in Kentucky. The KDA only certifies Kentucky-based op-erations. It currently charges $125 per year to submit an organic crop produc-tion plan, regardless of farm size. The fee includes the required farm inspection. The KDA’s fee is perhaps the lowest of any organic certifier in the country. Another eight out-of-state certifiers also certify organic farms in Kentucky. Their fees are generally higher than the KDA’s, with additional fees assessed for farm inspec-tions or by the acre.
The organic farm plan is intended to reduce dependence on off-farm inputs and synthetic substances. Most synthet-ics—including chemical pesticides,
herbi-cides, fertilizers, and genetically modified organisms—are prohibited entirely. This practice contributes to the popular, but inaccurate, perception that organic farm-ing is simply farmfarm-ing without pesticides. Most naturally derived substances—in-cluding fertilizers and pesticides made by plants, animals or microbes—are allowed for use on organic farms, but a few are restricted or even prohibited. For example, newsprint, insecticidal soaps, and boric acid can all be used on organic land, even though they are synthetic; but arsenic and strychnine are prohibited, even though they are natural products. The USDA maintains a list of allowed synthetic substances and prohibited nat-ural substances. Prohibited substances cannot be used for at least three years prior to harvest of an organic crop. For example, a field with no prohibited sub-stances applied after August 31, 2014, could be ready for its first organic harvest on September 1, 2017. The 2015 and 2016 crops could not be sold as organic, but the 2017 crop could be sold as organic if it is harvested in September or later. Organic farmers maintain at least three years of management records to demonstrate that they have not used prohibited substances during that period.
The Organic Materials Review In-stitute (OMRI) is a useful resource for organic farmers who wish to know whether a particular product is allowed for inclusion in their organic farm plan. OMRI reviews ingredients of products marketed to organic producers, to ensure they contain no prohibited substances. OMRI-approved products can display the OMRI logo on their packaging and are added to a searchable database that can be accessed through OMRI’s website. Buffer zones are maintained around organic land to prevent contamination with prohibited substances applied to adjacent conventional land. This
con-tamination is a particular concern with corn, because most conventional corn is genetically modified, and its wind-blown pollen can travel long distances, so has great potential to contaminate organic corn through cross-pollination. Organic certifiers may require larger buffer zones between organic and conventional corn plantings than they would for other crops. They will likely take relative plant-ing dates and prevailplant-ing winds into con-sideration as they consider the size of the buffer needed to prevent contamination with genetically modified pollen. Annual crops such as corn must be rotated with other crops to maintain or improve soil quality. Long rotations that include cover crops, nitrogen-fixing crops, sod-forming crops, and green manure crops are encouraged to prevent erosion and build soil quality. A simple four-year organic corn rotation might in-clude a year of corn following three years of alfalfa. A more complex four-year rota-tion could have two years of alfalfa, then a year of corn followed by a winter cover crop mixture of rye and crimson clover, and, finally, summer soybeans followed by winter wheat. Either of these rota-tions could be certified organic, but most organic certifiers would not approve an organic farm plan calling for continuous corn, or a simple corn-soybean rotation. Organic farmers must plant organic seed if it is commercially available. Or-ganic seed is grown on certified orOr-ganic land and is not treated with synthetic fungicides or other prohibited substanc-es. Many varieties of organic corn seed are available, most of which are hybrids. An organic farmer can plant untreated conventional seed only if she/he can demonstrate to the certifier’s satisfaction that the particular variety needed is not commercially available as organic seed. An organic farm’s plan should be de-signed to maintain or improve soil
qual-ity without synthetic fertilizers. Regular soil testing and crop quality checks can help determine whether soils have suf-ficient nutrients to sustain healthy and high-yielding crops. Organic farmers often strive to maintain or increase soil organic matter content, which is an im-portant indicator of soil quality, and feeds soil-dwelling organisms.
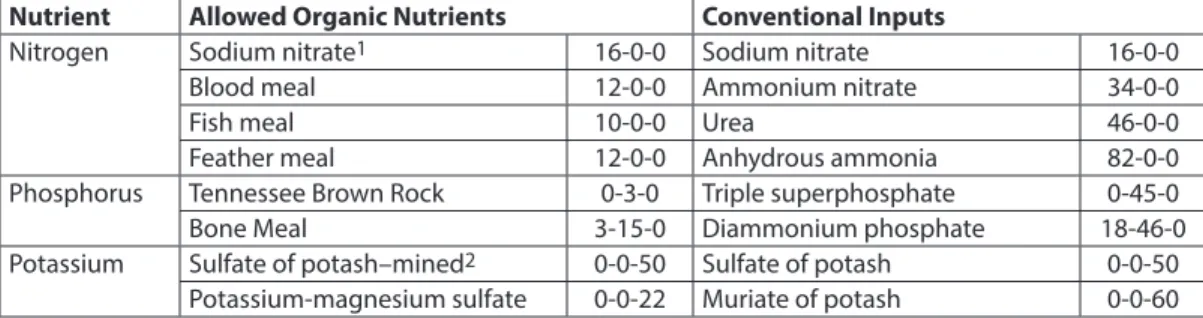
Sufficient nitrogen must be obtained from non-synthetic sources such as nitrogen-fixing crops, composts, animal manures (from organic or conventional livestock operations), or feather meal. If animal manure is used as a fertilizer, it must be applied more than 90 days before harvest of organic corn destined for human consumption. No pre-harvest interval applies if the corn is used for animal feed or if the manure has been properly composted according to organic requirements.
Mined materials are acceptable sources of phosphorus, potassium, sulfur, calcium, and other essential ele-ments, provided they undergo no further processing or purification after mining, except for crushing and sieving. Since these materials can be expensive, organic farmers often try to retain locally avail-able resources before supplementing with mineral sources. Cover cropping, composting, and manure incorporation are all useful tactics for nutrient retention and recycling on organic farms.
Understanding and following the USDA’s organic standards can seem cumbersome at first, but it gets easier with time. More than 120 Kentucky operations have already been certified under the USDA’s organic program, join-ing more than 17,000 certified organic operations nationwide. By producing organically, these farms fetch premium prices while conserving resources and promoting ecological balance and bio-diversity.
O
rganic food sales in the U.S. have seen a steady rise over the last 20 years. Between 2004 and 2012, food sales climbed from $11 billion to an estimated $27 billion. Organic meat and poultry represents the fastest growing segment within the fast-growing organic industry. Because organic livestock requires organic feed, this increasing demand is one of the driving forces in the organic corn market. While the organic grain production still remains very small when compared to conventional production, more land is being transitioned to organic production. In the three years from 2005 to 2008, certified organic production of corn, soy-beans, and wheat increased from roughly 200,000 acres to about 736,000 acres. In Kentucky, the largest potential market for organic grain is the growing dairy industry in and around the state. This market is still relatively small in Kentucky, but it is growing. And even though this market is small, their demand for feed grain is not being met locally. In fact, one of the reasons that many organic industries remain small in Kentucky is the difficulty they face in sourcing the required organic inputs (such as feed corn and soybeans).Prices
Among many possible motivating fac-tors, farmers consistently rank high price premiums as one of the most important reasons for transitioning to organic pro-duction. Throughout the organic industry the historical price of organic grains has approximately traded at twice that of conventional prices from 1995 to 2013. On the surface, this suggests that organic simply trades at a fixed premium over con-ventional. But this “premium” has varied significantly. For instance, the price ratio has ranged from as small as 1 to as a high as 4.5, with most of this price-spread volatility occurring in the years since 2007 (Figure 1). This variable price spread between organic and conventional crops is eco-nomically relevant not only to existing organic producers and processors but
for those conventional producers and processors considering a transition into organic agriculture. In addition, this price spread is of particular importance for the annually adjusted crop insurance plans for organic crop producers that are draft-ed by policymakers within the Unitdraft-ed States Department of Agriculture Risk Management Agency (USDA-RMA.) Several years ago, it was very dif-ficult for farmers to find accurate price reporting in the organic market. In the conventional market, you can look on your phone or computer or call your local elevator and get real cash prices. Most or-ganic sellers had little price information, and in the early years there existed a large amount of price variability between local contracts for organic commodities. Over the last decade, however, improved price reporting by Rodale and the USDA-Ag Marketing Service has resulted in prices being posted biweekly online, and all producers now have better information on prices. While better reporting has improved seller awareness of prices, there still remains a great deal of price variability in the organic industry, espe-cially when compared to conventional commodity prices (Figure 1).
Organic Crop Insurance
Current Status
Both certified and transitional organic farming practices have been insurable through the RMA Federal Crop Insur-ance Program since 2001. There were
major changes for crop year 2013, how-ever, including a premium surcharge removal for organic producers and the establishment of an organic transitional yield (T-yield) instead of being linked to a conventional T-yield.
Surcharge Removal
In March 2013, the RMA removed the longstanding 5 percent premium surcharge assessed against all organic farmers seeking federal crop insurance.
T-Yield Adjustment
Prior to 2013, organic producers insured their crops based on the con-ventional T-yields of their respective counties. Starting in crop year 2014, organic producers will have adjusted, organic-only T-yields that better reflect appropriate premium and expected in-demnity payout levels.
Result of 2013 Changes
Starting in crop year 2014, organic producers will automatically pay 5 percent less because of the removal of the insurance program participation surcharge, and since organic T-yields will be less than conventional T-yields, the premiums associated with the lower historical T-yields will also be reduced. The bottom line is that the typical or-ganic producer will pay approximately 15 percent less in insurance premiums and fees in future crop years.
The Organic Corn Marketplace
Thomas Sikora, UK Agricultural EconomicsFigure 1. Price of conventional (CME Futures) and organic corn (USDA), 2008-2014 18 16 14 12 10 8 6 4 2 0 Pric e/bu ($) 2008 2009 2010 2011 2012 2013
Nearby CME Corn Futures USDA Organic
Remaining Concerns
The biggest remaining problem exists with the RMA defining the insurance value of organic grain by linking it to its conventional counterpart. The current model simply uses a multiplier (currently 1.788 for organic corn) and derives the organic corn price by multiplying the conventional price of corn by a prede-termined value. (This is the 2011 pilot program ratio based on the minimum ratios of organic to conventional prices observed from January 2007 through September 2009.)
Implications of Multiplier
Basically, the multiplier is a form of price risk that cannot be managed. For instance, if you plant organic corn when the price of conventional corn is $5.00 and the price of organic corn is $8.94 (a price difference of 178.8%), you are satis-fied with a 1.788 multiplier. But during harvest, what if the price of conventional corn remained at $5.00 but the price of organic corn was now at $10.25? This
reflects an actual multiplier of 2.05, not the 1.788 your premiums for revenue pro-tection paid for. The revenue propro-tection offered to you in this situation (where the harvest price ratio of organic to conven-tional corn exceeds its planting multiplier ratio) would be much less than the fair market value of your crop. Conversely, if the price of your organic corn fell from $8.94 to $8.00 while conventional corn remained at $5.00, and you received an indemnity payout on your revenue pro-tection policy, you would actually benefit, since you would be facing an actual price multiplier of 1.6 yet would be receiving an indemnity based on a higher expected value for your crop.
Even more simply stated, at the 75 per-cent coverage level, an organic producer in 2012 faced an effective coverage range of 43 percent to 105 percent depending on the ratio of planting-time organic prices to conventional market prices. This multiplier risk is unmanageable through hedging and is often not seriously con-sidered by organic and transitioning producers.
Future Work on Insurance
The RMA is currently investigating new price election methodologies which take into account the shortcomings of the above fixed-price model. This model was developed during the 2008 Farm Bill prior to the RMA having accurate price data. However, the Agricultural Marketing Service (AMS) of the USDA now reports a biweekly organic corn price both regionally and nationally. The RMA has also begun a beta testing program to better aid in price discovery by taking price reports from organic producers via the internet. It is obvious that the fixed-price methodology used by the RMA to determine the insurance price of organic corn is on its way out, and it will inevitably be replaced by an independent price for organic corn based on AMS and organic producer price reporting. The OIG report critical of the RMA for using conven-tional T-yields and insurance participa-tion fees on organic producers resulted in an almost instantaneous change to those policies earlier in 2013. When the change from fixed-price to independent-price elections will occur is the unknown.
Profitability of Organic Corn Production
William Martin, UK Agricultural Economics
I
s organic corn production profitable? Depending on who is asking, this question can mean two different things. One way of looking at profitability is to compare the production of organic to conventional corn: Is organic corn more profitable than conventional corn? But perhaps there are producers less inter-ested in a comparison who would simply like to know if they can make enough profit to cover living expenses and build some savings. For the purpose of this publication we will attempt to address both of these questions.On the surface, the equation seems quite simple. If you can sell your crop at a huge premium (often as much as twice the price of conventional corn!), how could you lose? A back-of-the-envelope calculation would tell you that $6 per bushel corn would gross $900 per acre at
150 bushels per acre. If organic corn were selling for $14 per bushel, you would see an increase in gross returns for any yield over 65 bushels per acre. This sounds too good to be true because gross returns are often misleading. Chasing prices instead of profits is never a good idea. The rest of this section will be devoted to three other factors that determine the profitability of organic corn:
• How do the costs of production com-pare with conventional corn? • What are the effects of a longer rotation
with fewer cash crops?
• And how much of an impact does the transition period have on profitability? Answering these questions will help us get to the bottom of our original ques-tion: Is organic corn profitable? And how does it compare with conventional corn?
Previous Studies
Before getting into our analysis, it’s worth taking a look at what other organic corn profitability studies have found. • Iowa State University: Delate (2003)
found that costs were lower for organic production as long as fertilizer costs stayed below a certain threshold. More recently, Chase (2008) concluded that a four-year organic rotation increased returns to management substantially. • Purdue University: In 2009, Clark
found that even with a yield penalty, organic corn can be more profitable than conventional corn during a (seven-year) transition period. • Minnesota: Mahoney et al. (2001) used
field trial results to conclude that an organic grain system is significantly more profitable than conventional production.
• University of Wisconsin: In 2009, Cha-vas concluded that, based on their field trials, organic grain and forage system was the most profitable. The trial was conducted between 1993 and 2006. • USDA-ARS: In 2006, Archer used a
simulation model based on data from a research farm in Minnesota. He com-pared organic to conventional crop-ping systems with transition and risk effects. He concluded that, even when considering the transition period and risk, organic corn production can be more profitable. This result, however, was limited to a somewhat unrealis-tic two-year organic rotation. When compared with a four-year organic rotation, results were less conclusive. • USDA ERS: In a 2013 study that used
ARMS data to compare the profit-ability of organic and conventional corn production, McBride found that price premiums cause organic corn production to be more profitable than conventional production under certain scenarios.
As is evident from the summaries above, most studies that compare organic to conventional grain production find that organic systems are more profitable. Some conclude that the system’s profit-ability is due to lower costs and a higher premium. Others argue that costs are not significantly lower and that only a high price premium causes the organic system to be more profitable. The majority of these studies are based on university field trials. While useful, some would argue that field trial results are sometimes difficult to rep-licate outside of the experimental setting.
Costs
To analyze the impacts of farm costs on profitability we use empirical data from the FINBIN Farm Financial Data-base. The database summarizes actual farm data from thousands of agricultural producers who use FINPACK for farm business analysis. FINPACK is a com-prehensive farm financial planning and
analysis software system developed and supported by the Center for Farm Fi-nancial Management at the University of Minnesota. FINBIN contains farm man-agement data from Minnesota, North Dakota, Missouri, Ohio, Michigan, Wis-consin, South Dakota, and Nebraska with Minnesota representing the largest share of farms. An ideal analysis would use local farm data, but there simply is not a large enough sample of organic corn farms in Kentucky to get an accurate picture of the system’s cost structure. Nevertheless, we feel that the use of farm data gives a real-istic picture of the cost-related decisions that organic producers make.
Unless otherwise noted, cost data is an average from the years 2008 through 2012. Total costs refer to total direct and overhead costs. This estimate of costs not only includes the obvious elements such as fertilizer and fuel, it also includes items such as machinery depreciation and utili-ties. Land rent is subtracted so that it can remain constant in our comparisons. Table 1 shows a comparison of the average total costs for organic corn producers and con-ventional corn producers in the sample. Some of the difference in cost can be explained by differences in average yield. On a per-acre basis, costs such as storage, drying, and hauling are all more expen-sive with higher yields. Other differences,
however, are due to the production prac-tices of each enterprise. As you can see in Table 2, machinery and labor-related costs are significantly higher in organic corn production. This is not surprising since organic farms rely on mechanical cultivation to control weeds. In fact, the FINBIN data also shows that organic corn requires twice the labor hours per acre of conventional corn. More passes through the field and more labor hours will obviously drive costs higher. These cost differences, however, are outweighed by higher seed, fertilizer, and herbicide costs that a conventional corn farmer typically incurs.
To provide a better idea of how the costs of organic production can be bro-ken down, we modified the University of Kentucky’s conventional tillage corn budget. Machinery and labor estimates for organic production were adopted from the Iowa State University Organic Corn Enterprise Budget (see resources section). It is important to note that many of these expenses can vary dramatically among farms (see note about fertilizer costs). All farms are different, but this data should give an idea of how an or-ganic corn enterprise budget compares to a conventional one (Table 3). Check out the resources section for links to budgets online where you can input information specific to your farm.
Table 1. Total cost per acre comparison Organic Corn Conventional Corn
$345/ac $450/ac
Table 2. Where costs are higher ($/ac)
From Conventional to Organic From Organic to Conventional
Category Increase in Cost Category Increase in Cost
Fuel and Oil $7.34 Seed $22.47
Repairs $8.86 Fertilizer $60.55
Custom Hire $5.53 Crop Chemicals1 $18.61
Hired Labor (direct) $1.17 Hired Labor (overhead) $10.91
1 Compared to certified organic crop chemicals and “non-chemical crop protection”
O
rganic fertilizer costs
There are many reasons an organic farmer may have significantly lower fertil-izer costs. An increased use of cover crops and forage crops in the rotation reduces the need for external nitrogen fertilizers. In addition, many organic corn farmers are able to find a free or cheap source of manure as a fertilizer. It is important to note, however, that a farmer without these resources may find similar or even higher fertilizer costs, as organic soil amendments can often be more expensive than their conventional equivalents.
the conventional, two-year corn and soybean rotation?
Prices
To compare systems we need to know what prices to expect. For simplicity, we use round numbers that represent an average of spot prices from 2008 to 2012 (the same period from which the cost data was taken). For organic crops, we use low-range and high-range estimates as well that will be 20 percent below and 20 percent above the spot price, respectively (Table 4).
Alfalfa prices were determined from conversations with local farmers and industry experts. Prices for alfalfa (both
organic and conventional) can vary dramatically depending on quality. For example, organic dairies paid as much as $400 per ton for premium organic alfalfa in 2012. The prices we used are meant to be a conservative estimate for good quality alfalfa.
Yields
Our estimated yields are based on re-sults of a UK field trial as well as anecdotal evidence. They are also very close to aver-age yields from the FINBIN data. Many university field trials and the well-known Rodale Institute field trial show that or-ganic yields increase as the farmer gains experience and eventually will match Table 3. Total costs per acre on a sample organic farm
Total Costs per Acre
Machinery Costs Fixed Variable Total Costs
Plow (moldboard) $8.90 $10.00 $18.90 Tandem disk $3.50 $2.90 $6.40 Field cultivate $2.40 $2.70 $5.10 Plant $5.70 $4.90 $10.60 Rotary hoe (2x) $3.00 $2.20 $5.20 Row cultivate (2x) $3.80 $4.00 $7.80 Total Machinery $54.00
Quantity Unit Price
Seed 0.38 bags $200.00 $76.00 Fertilizer - manure + spread 1 ton $50.00 $50.00 Lime - Delivered and Spread 0.5 ton $20.00 $10.00 Drying: LP, Electric, Maint & Labor 1 gallon LP $2.00Pts Remove 3 $20.01 Crop Insurance 1 acre $30.00 $30.00 Other Variable Costs 1 acre $5.00 $5.00 Operating Interest $225.00 dollars $0.06# Months 8 $9.00
Harvest Fixed Variable Total Costs
Combine $17.60 $9.90 $27.50 Haul $4.60 $4.03 $8.63 Handle $1.73 $2.30 $4.03
Total Harvest $40.15
Labor Hours Rate Total
Labor variable costs $1.40 $12.50 $17.50 Hired Labor Overhead $15.00
Total Labor $32.50
Additional Overhead Expenses
Taxes and insurance $10.00 Miscellaneous Overhead $10.00
Additional Overhead $20.00
Total Operating Costs Per Acre $346.66
Cash Rent Per Acre $175.00
Costs + Land Rent $521.66
Rotations
If you could find a way to continu-ously grow organic corn on the same plot of land and do so successfully and sustainably, there is no doubt that the organic system would be more profit-able. Organic systems, however, require longer rotations (see production section for complete explanation). If we assume a four-year organic rotation of corn, soy-beans, wheat, and alfalfa, then we are no longer interested in just the profitability of organic corn production. The new question you have to ask is: Is this rotation profitable? The question can be extended to: Is this rotation more profitable than
conventional yields. While this could be the case, based on the results of the UK field trial, empirical evidence from the FINBIN data, and anecdotal evidence, we feel that this is overly optimistic. One possible reason for the difference is that organic farmers typically plant later in the season to avoid cross-contamination. Later planting reduces yield potential.
Results
To analyze the profitability of our sample rotation, we average returns to management across the rotation and then compare that to the returns to manage-ment for a traditional corn and soybean rotation. Returns to management do not include government payments in this analysis. For simplicity, we assume re-turns on one crop per year. We therefore assume that wheat would be harvested as grain, and the alfalfa would be estab-lished that fall.
You can see in the Tables 5 and 6 that average organic returns to management, even at the low range of prices, are higher than the conventional rotation. Organic corn carries the entire rotation with its high profit margins. One may be tempted to use these results as evidence that the shortest organic rotation possible would be the most profitable. While one may find success with many other rotations, it is important to consider the agronomic benefits that are not accounted for in a budget. Alfalfa, for instance, boosts soil fertility for the coming corn crop.
Transition Effect
One of the biggest hurdles to organic corn production is the transition process. Organic certification requires that fields do not receive any synthetic chemicals for at least three years prior to harvest. Since there is little high-quality agri-culture land that meets this description in Kentucky, our budget assumes that a farmer will have to transition their land to certified organic production. Develop-ing a comprehensive plan to manage this transition is crucial to making organic corn production a profitable enterprise. This section will provide some recom-mendations and a sample plan, but every farm will be different. In addition, we recommend involving your organic certi-fier in all stages of the planning process
Table 5. Organic rotation
Corn Soybeans Wheat/Alfalfa Alfalfa Rotation Avg.
Gross Sales low range $864 $456 $484 $560 $591
average $1,080 $570 $605 $700 $739
high range $1,296 $684 $726 $840 $887
Average Costs $345 $298 $190 $250
Land Rent $175 $175 $175 $175
Avg. Costs + Land Rent $520 $473 $365 $425
Returns to
Management low rangeaverage $344$560 -$17$97 $119$240 $135$275 $145$293
high range $776 $211 $361 $415 $441
Table 6. Conventional rotation
Corn Soybeans Rotation
Gross Sales 750.00 495.00 622.50
Average Costs 450.00 230.00
Land Rent 175.00 175.00
Avg. Costs + Land Rent 625.00 405.00
Returns to Management 125.00 90.00 107.50 Table 4. Budget price estimates
Low Range Average RangeHigh
Price/bu Organic Corn $7.20 $9.00 $10.80 Organic Soybeans $15.80 $19.00 $22.20 Organic Wheat $8.60 $11.00 $13.40 Price/ton Organic Alfalfa $160.00 $200.00 $240.00 Price/bu Corn $6.00 Soybeans $13.00 Wheat $8.00 Price/ton Alfalfa $140.00
(see organic certification section for more information). Make sure to talk to your certifier about buffer requirements between fields.
Many farmers assume that organic certification requires that they transition their entire business to organic produc-tion. Not only is this untrue, we find that a gradual transition is one of the best ways to maximize your profits. Another mis-conception is that a three-year transition period means that you will not have an organic crop until your fourth year. Three years refers to the harvest date and not the planting date. With a little planning it is possible to have a certified organic crop in the third year of the transition.
Example Transition
Starting year: Plant a crop of conven-tional corn. Last synthetic chemical applied in spring. Transitional wheat sown in fall, after the corn is har-vested.
First year: Transitional wheat is har-vested. Transitional alfalfa established. Second year: Transitional alfalfa harvested.
Third year: Corn planted. As long as it is harvested after the date of the last chemical application of the starting year, this crop can be certified organic.
For the transition period, we assume a decline in yield due to both biological factors and a learning curve effect. Many agronomic studies have found such a decline. A study at Purdue summarized previous research and found an average transitional yield penalty for corn (14.6%), soybeans (14.9%), wheat (18.1%), and al-falfa (12.6%). See Table 7 for a summary of yields used in the analysis. These are the same yields used in the rotation analysis above.
Improper planning of the transition can have a major impact on profitability. For our analysis, we use a transition plan developed by Iowa State University (Table 8). The plan assumes the ability to divide a farm into four equal size fields. As was mentioned previously, the plan finds it to be beneficial to transition one’s farm to certified organic production on a gradual basis. In this particular plan, year three is 25 percent organic, and the farm is not 100 percent organic until year six. In addition to maintaining some financial stability with some conventional crops, another advantage to this plan is that it avoids planting any corn or soybeans during the transition period. These crops would be more likely to suffer during the transition period, and the lack of an organic price premium makes them a poor choice to plant during the transition period. If the transition is properly managed, we find that an organic corn production system can be more profitable than a conven-tional two-year rotation with average prices (Table 9). The lower price model shows slightly lower returns over the six-year transition period (Table 10).
To make sure the results of our analysis weren’t anomalous because of the input prices used, we looked at the actual prices received by organic produc-ers over the last six years and tested the transitional plan. We also used the real cost data for each of those years instead of a running average. The only elements that stayed constant were land rent and yield. We found that if a farmer started the organic transition in 2007, their aver-age returns would have been significantly less than our predicted returns, but they would still be higher than average returns from a conventional two-year rotation over that same period.
Table 7. Yields during transition
Crop Yield Corn (bu/ac) 150 120 102 Soybeans (bu/ac) 45 30 25 Wheat (bu/ac) 65 55 44 Alfalfa, established (tons/ac) 4 3.5 Conventional crop
Organic crop Transitional crop
Table 8. Transition plan
Field Year 1 Year 2 Year 3 Year 4 Year 5 Year 6
1 Corn Soybeans Corn Wheat Alfalfa Corn
2 Soybeans Corn Wheat Alfalfa Corn Soybeans
3 Corn Wheat Alfalfa Corn Soybeans Wheat
4 Wheat Alfalfa Corn Soybeans Wheat Alfalfa
Conventional crop Transitional crop Organic crop
Table 9. Transition returns to management per acre (average prices)
Field Year 1 Year 2 Year 3 Year 4 Year 5 Year 6 Avg.
1 $125.00 $90.00 $125.00 -$97.37 $65.00 $560.00 $144.61 2 $90.00 $125.00 -$97.37 $65.00 $560.00 $156.16 $149.80 3 $125.00 -$97.37 $65.00 $560.00 $156.16 $240.00 $174.80 4 -$97.37 $65.00 $560.00 $97.00 $240.00 $275.00 $189.94 Avg. $60.66 $45.66 $163.16 $156.16 $255.29 $307.79 $164.78
Table 10. Transition returns to management per acre (low prices)
Field Year 1 Year 2 Year 3 Year 4 Year 5 Year 6 Avg.
1 $125.00 $90.00 $125.00 -$97.37 $65.00 $344 $108.61
2 $90.00 245 -$97.37 $65.00 $344 -$17 $104.94
3 $125.00 46.84 $65.00 $344 -$17 $119 $113.81
4 -$97.37 $65.00 $344 -$17 $119 $135.00 $91.44
Avg. $60.66 $111.71 $109.16 $73.66 $127.75 $145.25 $104.70 corn production, there is also a steep learning curve that must be accounted for. All that being said, the results show that this enterprise represents a potential opportunity to increase one’s profits. Farmers with limited access to land may find the results of this study particu-larly interesting. If you’re willing to com-mit to the extra labor hours, the higher returns would allow a much smaller farm to be profitable than is typically the case. In their analysis of organic corn produc-tion in Iowa, the authors point out the implications of their findings for begin-ning farmers:
The need for fewer acres would allow the producer to enter into farming with lower capital requirements. Fewer acres also translate into a smaller machinery invest-ment. Machinery for organic producers tends to be smaller, less expensive equip-ment compared to conventional produc-ers. The much lower machinery and land investment for the organic producer would allow farmers with limited resources to at-tain economic goals with minimum debt. Therefore organic rotations offer beginning farmers an opportunity to gain access to farming without a debt load and risks
Conclusion
This section started with a question: Is certified organic corn production profit-able? Based on our analysis, we find that it can be profitable and that it can be more profitable than conventional corn pro-duction. When it comes to choosing any new enterprise, one has to consider that all farms are different and that weather or financial markets can disrupt even the best laid plans. When it comes to organic
that can be overwhelming. Programs and funding that are available for beginning farmers can be stretched farther in organic production than conventional.
Kentucky has an abundance of small family farms, many of which are looking for more profitable enterprises. The
re-sults of this study show that organic corn production could be a great opportunity for some of these farms.
Marketing Organic Corn
Lee Meyer, UK Agricultural EconomicsM
arketing organic corn is totally dif-ferent from marketing convention-ally produced corn, primarily because of the different market structure. Conven-tional corn is produced in huge quanti-ties. U.S production was just under 14 billion bushels for the 2013 crop. While comparable production data for organic corn are not available, only 0.26 percent of the 91 million acres in corn production were certified organic in 2011. Another difference is that conventional corn is a “commodity,” which means it is a generic or standardized product produced in large volumes and which can be totally described by grades and measures. With commodities, buyers and sellers do not have to be present at the market. There is also a very extensive marketing in-frastructure for commodities such as corn. From a practical perspective, this infrastructure means that producers of conventional corn don’t have to look far for a place to deliver their product. There are probably grain elevators close to their farms. Pricing is always complicated, but at least with conventional corn, price in-formation is readily available from both private sources and USDA market news reports. Farmers also have extensive access to market analysis and forecasts. Finally, for conventional corn there are futures markets that enable growers to separate physical deliver from pricing. For example, producers can sell their conventional corn on the futures market at any time—even well before harvest. In contrast to conventional corn, organically grown corn is a specialized product. And while it can be sold by grade, moisture content, etc., there is not much of a market infrastructure because of the low level of production. The bot-tom line is that good marketing takes a lot more effort for organic corn than for conventional corn.It is important to understand that the market for organic corn is driven by the organic livestock products market. These are your customers. Dairy farms are the largest user of organic corn, followed by organic poultry productions (eggs and broilers). A small amount of organic corn may be used in beef production. Most commodity corn is sold to grain elevators, who in turn sell it to users (ethanol, food processing/HFCS, feeders) or exporters. While some organic corn is sold to elevators, most is sold either directly to users or to local feed mills who supply users. So, as an organic corn producer, you will have the option of sell-ing through one of these three outlets. Selling directly to a user (livestock producer) has the potential to provide the highest return since this is the ultimate destination of your product. Direct mar-keting eliminates the middle man but not the services that the middle man provides. The grain is not eaten at one time, so stor-age must be provided to make the grain available over the whole year. Quality must be assessed and guaranteed. And, both sides must be protected from default. An important strategy in direct sales is building a relationship with your cus-tomer. Strategic relationships can help both sides and increase total value. By honestly discussing factors such as stor-age, you can find solutions to potential problems. You may find that the buyer needs monthly deliveries and that you will need to provide storage but that the buyer has a truck and can provide transportation. Relationships need to be developed and proven. Both sides will look for characteristics such as reliability (which must be developed and proven over time) in addition to financial assur-ances that can be part of contracts. Pricing is always an issue in direct sales. A way to simplify pricing is to use
some type of formula pricing. A formula price calculates a pay price based on a publically reported price. For example, you could agree to sell your corn to a dairy farmer at $.50 less than the average USDA reported price for the past two weeks. Alternatively, you might want to agree on a price for the whole year, even though deliveries occur through the year. A longer term arrangement like this should involve some type of a contract. Contracts, or written agreements, can be a valuable component of a direct mar-keting relationship. A good contract can clarify communication, avoid problems and give assurance on both sides. Longer term (multi-year) contracts can reduce risks for both sides by giving the corn seller a long-term market and the buyer a longer term supply and help with cost management. Organic Valley, a leading processor of organic milk, is trying to develop contracts between corn produc-ers and their member milk producproduc-ers with prices somewhat below current spot market prices (around $10/bu.) but still at profitable prices for corn producers. Finding a potential buyer is not dif-ficult. The Kentucky Department of Agriculture has a list of certified organic producers, including dairy and poultry. Each of these is a potential customer. Some already have sources of organic corn, and you may be competing with your neighbor. But others are buying feed grain for out of state and welcome the opportunity to buy closer to home and at a lower “price in the feed bunk.” Another option is to register your farm and list your products for sale on one of several internet sites. Even tradi-tional farmers are using internet sites to help in their buying. Some examples are www.marketmaker.com (sponsored by the University of Kentucky) and www. localharvest.org. These sites are easy to
register with and will help buyers find your organic corn. And there are other ways to market your corn online. Organic Valley has a monthly trade newspaper where people can list feed for sale (http:// books.dairylandprint.com/MayAOrg-Trader/page2/index.html).
For farmers who would rather not deal with the issues of direct sales, selling to a feed processor might be a good option. A feed processor is similar to a grain eleva-tor; they usually have storage and are will-ing to buy large quantities at harvest. Most will pay higher prices after harvest, giving you to opportunity to store and then sell at a higher price as the season goes on. Kentucky Organic Farm and Feed, Inc. (KOFFI), located in Guthrie, Ken-tucky, is the one organic feed company in the state. They will bulk grain and complete dairy and poultry rations in bulk or bag. They can be reached at: (270) 265-5004 to discuss current buying op-tions.
In theory (depending on where you are located and trucking options), you can also sell your organic corn on the “spot” market, directly to an elevator. If that fits your marketing plan, you will want to compare prices, adjusting them for transportation costs and any other marketing expenses. It’s always a good idea to study the overall market. Start with the USDA Market News report. (The most current report is available online at: http://www.ams.usda.gov/ mnreports/lsbnof.pdf.). As of Decem-ber 2013, the price of organic feed corn ranged from $10 to $11.75. One of the problems is finding a feed mill close by and with competitive prices.
At this time, there are no known com-mercial grain elevators buying organic corn. There are buyers in Indiana and Illinois, but the hauling charge might be prohibitive. Still, selling to buyers in nearby states can be a back-up option in the marketing plan.
The bottom line is that while selling organic corn is different from selling conventional corn, there are numerous opportunities to enhance your returns and make a good financial return on your marketing efforts. The overall or-ganic sector is growing, and marketing institutions (including grain elevators, market news, etc.) are sure to develop and expand, making marketing easier. New organic grain producers and conventional farmers who are consider-ing addconsider-ing an organic corn enterprise will benefit from advanced planning. They should evaluate potential commercial (grain elevator and feed supplier) mar-kets. They should contact potential buy-ers (probably organic livestock product producers) and learn about their needs. Moreover, they need to understand their cost of production so that they can know what level of selling price they’ll need to be profitable.
Organic Corn Crop Management
Chad Lee, UK Plant and Soil Sciences, Grain CropsSite Selection and Soils
Corn will grow on about any soil type in Kentucky. But corn (including organically grown corn) grows best on well-drained soils.
Since tillage is normally part of an organic corn system, soils with very little slope (0 to 2%) are preferred. Generally, soils with little to no slope are at lower risk for erosion. However, soils with little to no slope in the Ohio River Valley are gener-ally soils near rivers and streams. These bottom fields are prone to flooding, and erosion can be a risk. Also, some of these bottom fields have higher clay content and are poorly drained. Corn can do well on poorly drained soils, but some of the crops in rotation, such as wheat or alfalfa, do not grow well on poorly drained soils. Fields with a history of animal manure typically are high in fertility and may be ideal for organic corn systems. If soils have excessive phosphorus levels from repeated use of animal manures, corn is an excellent crop to help remove phos-phorus from these fields.
Identity Preservation
Organic corn needs to be isolated from other corn fields in order to prevent stray pollen from entering the organic corn field. The farmer growing organic corn is responsible for isolation of the organic corn.
Thankfully, we have a successful ex-ample of corn isolation in the Ohio River Valley. For years, white corn has had to be isolated from yellow corn. Pollen from a yellow corn hybrid that pollinates a white corn ovary will produce a yellow corn kernel. Farmers raising white corn generally plant border rows. In general, twelve border rows are considered to be sufficient for blocking yellow corn pollen from reaching white corn plants. Farmers raising white corn will keep the harvested grain from the border rows separate from the remaining grain. Organic farmers should be able to follow a similar practice. If the organic corn maturity is dif-ferent from the neighboring corn, then the two fields may pollinate at different times and reduce the risk of
contamina-tion. Also, differences in planting date may change the pollination timings and reduce risk of contamination.
Once the organic corn crop is harvest-ed, those kernels must be kept separate from other kernels. The chapter on post-harvest handling provides more details on segregation.
Crop Rotations
Around 50 B.C., the author Varro observed that legumes grown before a cereal crop improved yields of the cereal crop. He also noted that the best method was to allow the legume to get to a full seed stage and then plow it under and im-mediately plant a cereal. This is one of the earliest references to using a “green ma-nure.” Cereal crops such as wheat, barley, oats and rye are grasses. Corn (or maize) is also a grass. Scientists and farmers now know that a legume fixes nitrogen. If a grass crop is grown immediately after the legume, then nitrogen from the legume crop will be available for the grass crop.
Studies over the past century have verified that crop rotations generally re-duce diseases, insects and weeds for each crop in the rotation. In addition, crop rotations typically improve the yields of each crop in the rotation. The proper crop rotations can improve soil organic matter and soil structure. Crop rotation is absolutely critical to the sustainability of an organic cropping system. There are several options for crop rotations. In general, a legume needs to be rotated between cereals and other grass crops.
Examples of Crop Rotation
Five-year rotation: In this example, year 1 is destruction of alfalfa followed by the planting and harvesting of corn. Year 2 is the planting and harvesting of soybean followed by planting of wheat or spelts. Year 3 is harvesting of wheat followed by seeding of alfalfa. Years 4 and 5 are alfalfa forage crop. Year 6 is destruction of alfalfa followed by planting corn (two grass crops in five years).
Four-year rotation: In this example, year 1 is the destruction of alfalfa followed by planting and harvesting of corn. Year 2 is planting of alfalfa, and years 3 and 4 are alfalfa forage crops. Year 5 is de-struction of alfalfa followed by planting and harvesting of corn (one grass crop in four years).
Three-year rotation: In this example, year 1 is planting and harvesting of corn. Year 2 is planting and harvesting of soybean followed by planting of wheat or spelts. Year 3 is harvesting of wheat followed by planting of a legume cover crop such as crimson clover. Year 4 is destruction of the cover crop and planting of corn (two grass crops in four years).
The crop rotation chosen also depends on the needs of the entire farming sys-tem. The five-year rotation in the example includes both corn and alfalfa, which may be very useful in dairy operations. The
three-year rotation example, which in-cludes corn, soybean and wheat or spelts may be better suited to a farm looking to sell mostly grain.
In each of these examples, a legume is grown before a grass or cereal. Over the long-term, the five-year rotation may be one of the most beneficial for soil structure. However, alfalfa requires a tremendous amount of potassium. Soil fertility in this rotation and any other rotation should be monitored to ensure adequate nutrients for each crop.
Corn Crop Management
Hybrids and Varieties
There are two basic types of corn grown in organic farming: varieties and hybrids. Corn varieties are often referred to as “open-pollinated” or as “lines”. The seed of an open-pollinated corn variety has the same genetic content as the par-ent plants. The offspring of an open-polli-nated variety generally has the same yield potential as the parents. Open-pollinated varieties are not necessarily isolated from neighboring fields of corn, so the genetic makeup of an open-pollinated seed lot may not be uniform.
Hybrids are developed by crossing the pollen from one line of corn with the silks of another line. The resulting seed is hybrid seed. Hybrid seed will produce a plant that will yield much more than either parent. A hybrid has a different genetic content than either parent, and the offspring of a hybrid plant will not produce as much yield as the hybrid seed. As a result, hybrid seed must be developed every year. A seed lot of hybrid seed should have uniform genetics. Corn hybrids have greater yield poten-tial and more stress tolerance than most open-pollinated varieties. As a result, open-pollinated varieties and hybrids are managed differently. If yield expectations are below 100 bushels per acre, then there
ies and hybrids. If yield expectations are greater than 100 bushels per acre, then hybrids should be used.
Maturity
Corn maturities ideal for Kentucky range from about 110 to 120 days. Varia-tions in weather and planting date can affect the actual number of days neces-sary for corn development, but hybrids and varieties in this range of maturities generally do best based on historical climatic conditions for this region.
Planting Date
Ideally, corn should be planted once soil temperatures are at least 50ºF (10ºC), there is a favorable weather forecast, and the calendar suggests early freeze risk is minimized. Most years, these conditions occur between April 1 and May 15. How-ever, yearly weather may allow corn to be planted as early as March 25 and as late as June 1 with little impact on yield. Generally, organically grown corn planted after June 1 will have lower yields. Later planted corn is at greater risk of damage from corn borer insects. In cases where a cover crop or green manure is allowed to grow into June before plant-ing corn, normally, corn yield loss from late planting is greater than yield gained from the nitrogen available from green manure.
Seeding Rate
Open-pollinated lines or varieties should be seeded at about 15,000 to 20,000 seeds per acre. Corn hybrids can be seeded at 22,000 to about 30,000 seeds per acre. Better soils are suited to the higher seeding rates, while poorer soils are suited to the lower seeding rate. Corn planted at higher populations generally does not compete better with weeds than corn planted at lower popu-lations, unless no other weed control Table 1. Examples of 3-, 4-, and 5-year organic crop rotations for Kentucky
Example Rotations
Year
1 2 3 4 5
Crop(s)
5-Year rotation 2 grass crops in 5 years Alfalfa/Corn Soybean/Wheat Wheat/Alfalfa Alfalfa Alfalfa 4-Year rotation 1 grass crop in 4 years Alfalfa/Corn Alfalfa Alfalfa Alfalfa
practices are implemented. The seeding rate is strictly chosen to try to maximize corn yield. Better soils (and better genet-ics) will allow for higher planting popula-tions.
Not all seeds in the bag will germinate. The seed tag should list a standard ger-mination value and the percent of pure seed in the bag. The seed tag also should list any other foreign material that may be in the bag.
The following equation can be used to determine the number of live plants that can be expected from corn seed at a specific seeding rate:
Expected population = seeding rate ÷ (% pure seed ÷ 100) _____________________________
(% germination ÷ 100)
For example, a seed tag may list 99 percent pure seed and 90 percent germination. If a target population is 25,000, then the calculation is: 25,000 plants/acre ÷ (99 ÷ 100) __________________________ (95 ÷ 100) = 26,580 seeds/acre
Seeding Depth
Corn should be seeded about 1.5 to 2 inches deep in most soils. If the soil is dry, then a deeper seed placement of 2.5 to 3 inches deep may be necessary. Deeper placement requires very good seed quality.
Planting corn less than 1 inch deep may cause the entire root structure to be too shallow and puts the resulting plants at greater risk for falling over (also called “lodging”). Corn seeding depth should not exceed 3 inches.
Row Width
To maximize yield, corn needs to capture at least 95 percent of the light by the time the plant tassels. Generally, corn will reach 95 percent light interception when grown in row widths of 30 inches or less. Row widths less than 30 inches will capture 95 percent light interception but would hinder inter-row cultivation when needed.
Open-pollinated lines should do well in row widths of 36 inches or less. Some of the open-pollinated varieties have larger leaves, which tend to lie more
horizon-tally than some hybrids. Open-pollinated lines are grown at lower target plant populations. Open-pollinated corn lines have lower yield potential than hybrids. All of these characteristics make 36-inch rows (or less) suitable for open-pollinated corn.
Weed Control Methods
Weeds compete with corn for water, nutrients and light, and can complicate harvest. Early season weed pressure can affect corn growth and development even after the weeds are removed. Effec-tive weed control is essential to achieve excellent corn yields, and effective weed control may be one of the more chal-lenging practices for organic farming in the Ohio River Valley. Organic weed control methods are most effective on small weeds with shallow roots. There are more options for small annual weeds than larger weeds or perennial weeds. Weeds that emerge with a corn crop and grow to about 4 inches in height will reduce corn yields. However, the density and species of weeds affect competition with corn and could change the removal timing of those weeds.
Johnsongrass (Sorghum halapense) is a perennial weed and may be the most problematic weed on organic farms in the Ohio River Valley. Removing it from fields requires multiple years and mul-tiple weed removal practices. Failure to control this weed effectively could ruin attempts to grow all grain crops organi-cally.
Johnsongrass can grow from seeds in the first season. The growing plant will develop roots and rhizomes. During the second season, new johnsongrass plants can grow from the rhizomes. The seed-ling johnsongrass is relatively easier to control than the rhizome johnsongrass. Control of this weed must be of high priority on organic farms.
While johnsongrass may pose the largest threat to organically grown crops, a plethora of weed species will attempt to compete with corn. Redroot pigweed, smooth pigweed, Palmer pigweed, com-mon lambsquarters, comcom-mon ragweed, cocklebur, and Pennsylvania smartweed are just a few of the broadleaf weeds that could be in Kentucky fields. Giant foxtail, green foxtail, barnyardgrass, fall
panicum, and broadleaf signalgrass are a few of the grass weeds. Each of these weeds has a slightly different growth habit, seed production, seed viability and competitiveness with the corn crop. There are several management tools available to help control these weeds.
Weed Removal Practices
In organic farming, the methods for controlling weeds include: rotation, cover crops or smother crops, mechanical removal, chemical removal, flaming, and hand-roguing.
Crop rotation is beneficial to the soils and can help with weed management. Different crops have different planting dates and growth habits. These differenc-es inherently help control some weeds. This practice alone does not control weeds, but when used with other weed management practices, crop rotation is beneficial. Crop rotation also generally reduces disease and insect pressure and generally improves yields of the rotated crops.
A common cover crop grown for weed control is annual rye (also known as cereal rye). The rye is allowed to grow to maximum height, and the crop is me-chanically crimped and flattened prior to planting. This method helps smother small weeds that germinate in the field. However, planting into a crimped and flattened matte of cereal rye increases chances for certain insects and slugs to be a problem early in the season. Almost any cover crop that has an acceptable stand will reduce early season weed pressure. The challenge with a cover crop is to control it early enough to keep it from competing with corn. Earlier removal of the cover crop reduces the risk of slugs but also reduces the smothering effect of the cover crop.
Mechanical control of weeds is prob-ably the most common method used in organic farming. Mechanical control includes using moldboard plows, disks, field cultivators, rotary hoes, tine har-rows, inter-row cultivators and other equipment that physically breaks, pulls or otherwise destroys weeds.
Several organic herbicides are available. Organic herbicides contain compounds such as citric acid, clove oil, cinnamon oil, and acetic acid. These herbicides will
damage any green plant material with which they contact. They generally work best on very small broadleaf weeds and do not work as well on grasses. Excellent spray coverage is necessary for excellent weed control.
Flaming puts direct heat on plants, rapidly removing water and causing the plants to wilt and die. Flaming is most cost-efficient on smaller weeds.
Hand-roguing is often the last resort in weed management. However, hand-rogu-ing is necessary in fields where weeds are in the planted row. Hand-rouging can be effective in fields with very low popula-tions of weeds. The old axiom of weed control is, “Never let a weed go to seed.” This goal normally can only be achieved with some hand-roguing.
Before Planting
Weeds can be controlled before plant-ing with smother crops and/or tillage. For fields that are extremely weedy, a moldboard plow may be necessary to bury seeds. Moldboard plowing can also reduce the risk of certain diseases. However, moldboard plowing increases the risk for erosion and quickly reduces
soil organic matter. So, a moldboard plow should be only be used when absolutely necessary.
If moldboard plowing is not necessary, then using a disk or a field cultivator can remove weeds prior to planting. Disking generally has greater risk for compaction than a field cultivator. But, disking may remove weeds more uniformly than a field cultivator. Soil finishing implements such as a spiked harrow or a rotary hoe can help remove shallow-rooted weeds.
After Planting
Weeds can be controlled after plant-ing and before emergence with organic herbicides, rotary hoes or tine harrows. Organic herbicides damage green plant material and do not have soil residual properties. Rotary hoes and tine harrows will remove small weeds. A rotary hoe will alleviate crusting problems. Tillage implements are more effective when the soil surface is slightly dry.
Once the crop emerges, weeds can be controlled with inter-row cultivation and flaming. Both methods generally work best on smaller weeds. Frequent, shallow passes with inter-row cultivation are pre-ferred over fewer, deeper passes. Flaming
for a single pass is more economical on smaller weeds.
After Harvest
Some weeds can be removed after corn is harvested. Fall is a great time to remove perennials such as johnson-grass from fields. Deeper tillage with a moldboard plow or disk is generally the most effective. However, fall tillage puts the soil at great risk for erosion. For this reason, fall tillage should be followed im-mediately with a cover crop to minimize erosion losses. Fall tillage is ideal when the soil is dry. If the soil is wet, fall tillage could result in compaction problems for the next crop.
The Weed Management System
Effective weed management is critical to maximizing yields in any corn system. Effective weed management requires the implementation of several strategies and tools. Weed management in organic corn requires multiple weed removal events throughout the year. The weed manage-ment achieved this season could have impacts for a couple of years ahead. Poor weed management this season could have impacts for several years ahead.
Fertility Management for Organic Corn Production
Edwin Ritchey, UK Plant and Soil Sciences
Introduction
Producers utilizing organic produc-tion practices face many of the same fertility concerns that conventional producers contend with in their farming operation. There are differences in the in-puts that are utilized between the organic and conventional production systems. Regardless of the system implemented, they both utilize the nutrients available in the soil. Those nutrients not provided by the soil must be supplemented to pro-vide the nutrients required by the plant to avoid limiting yield.
All farming operations should utilize a good soil fertility program to ensure that adequate levels of plant nutrients are available for plant uptake and yield. The soil fertility program should be based on
and amendment applications for corn production typically involve limestone, nitrogen (N), phosphorus (P), potassium (K), and to a lesser extent zinc (Zn), mag-nesium (Mg), and occasionally boron (B). All nutrient applications except N should be based on a quality soil sample.
Soil Sampling
The importance of a sound soil sam-pling program should not be underes-timated and will be discussed in detail. The basic principle of soil sampling is to provide an estimation of the nutrient availability for a particular field. Soil sample extractions are designed to es-timate the proportion of the nutrients that are or will become available within that crop year. The sample of soil that is analyzed in a soil testing lab represents
a large area of soil, so it is critical that the sample be as representative of the area as possible. Often fertilizer recom-mendations for several million pounds of soil (there are approximately 2 million pounds of soil in one acre to a depth of 6 inches) will be based on one or two teaspoons of the sampled soil. For this reason soil samples should represent uniform areas that are no more than 20 acres in size. If a field is not uniform, then a smaller sampling area should be used to make sure it adequately represents the field. Avoid the areas in a field that were subjected to different management prac-tices or anomalies within the sampled field. Some examples of areas to avoid include dead furrows and back furrows, old fencerows or homesteads that are now included in the field, areas used for