NBER WORKING PAPER SERIES
SHARE REPURCHASES AND ACQUISITIONS: AN ANALYSIS OF
WHICH FIRMS PARTICIPATE
John B. Shoven Laurie Blair Simon
Working Paper No. 2243
NATIONAL BUREAU OF ECONOMIC RESEARCH 1050 Massachusetts Avenue
Cambridge, MA 02138 May 1987
Paper presented at the NBER Conference on Mergers and Acquisitions, February 20-21, 1987. We would like to thank Clint Cummins and Bronwyn Hall for their generous econometric advice on this project. The research reported here is part of the NBERt5 research program in Taxation and project in Mergers and Acquisitions, supported by a grant from the Seaver Institute. Any opinions expressed are those of the authors and not those of the National Bureau of Economic Research.
NBER Working Paper #2243 May 1987
Share Repurchases and Acquisitions: An Analysis of Which Firms Participate
ABSTRACT
Firms can transmit cash to shareholders either by paying dividends or by purchasing shares. The share purchases can be either the firm's own securities
or those of another firm. Recent evidence suggests that there has been a dramatic increase in the use of these nondividend payments to shareholders. This paper reviews the theories which have been offered regarding the
motivation of nondividend payments. These include taxation advantages,
adjustment towards optimal debt-equity ratios, anti-takeover strategies, free cash flow (agency) considerations, signalling, and habit formation or learning. From these theories, we derive and investigate econometrically potential
characteristics which predict participation in the above actions for roughly 2.000 firms in 1976 and 1984. We find the variables suggested by the various hypotheses collectively have substantial power in predicting participation in share repurchase and acquisitions. The free cash flow and habit forming
arguments prove most consistent with our findings. Tests for structural change across time confirm an intercept shift consistent with dramatic increases in these activities, and fail to reject that the characteristic determinants of these actions are unchanged.
John B. Shoven Laurie Blair Simon
Department of Economics Department of Economics
I. Introduction
In a recent paper (Shoven, 1986), it was documented that dividends were surpassed by nondividend cash payments in the two most recent years for which data are available, 1984 and 1985. This finding is contrary to the conventional wisdom of dividends as the primary mechanism of transferring cash between the firm and its shareholders. It challenges the "trapped-equity" cost of capital models1 which equate the opportunity cost of retained earnings to the after tax yield of the alternative considered, namely dividends. If dividends are the only alternative to retaining earnings, the high taxation of dividends lowers the shadow cost of retaining earnings, and hence lowers the cost of capital. On the other hand, if cash can be and is paid out in nondividend form, with less taxation, the profession needs to alter how it computes the cost of equity capital.
In this paper we review the theoretical rationale for nondividend cash payments. These payments can take the form of either share repurchase programs or cash mergers. The primary new material of this paper is an econometric investigation into what types of firms engage in these two types of share acquisition programs (repurchasing own shares or acquiring the shares of other firms). We examine whether the probabilities of engaging in mergers and
acquisitions and share repurchases are determined by the same characteristics of the firm and whether the type of firm involved in these activities has changed relative to a decade ago, given that they are now so much more prominent.
II. Alternative Hypotheses Regarding Nondividend Cash Distributions
A large number of hypotheses have been developed regarding the motivations for a firm making nondividend cash payments. We discuss several in turn.
A. Tax Preference Relative to Dividends
In the absence of informational asymmetries between stockholders and management, and in the absence of taxes and transaction costs, dividends and
repurchasing shares in a company are equivalent. After the same amount of cash disbursement in either form, the total value of the firm will be the same. It will have the same debt-equity ratio, the same ownership claims, the same real assets, the same opportunities, and therefore the same value. It is possible to produce exactly the same consequences by either distributional form. After share repurchase, each shareholder can sell sufficient shares to match the cash flow he would have received in the dividend case. After dividend payment, the dividend proceeds can be used to buy additional shares in the company and therefore reproduce the percentage interest he would have had if he had declined to sell in a share repurchase program.
Taxes cause a major break in this equivalence, to the disadvantage of dividends and, therefore, to the relative advantage of share repurchase for
taxable households or individuals.2 It is still true that the total equity value of the firm should be the same after the payment of an equivalent amount of cash in either dividend or share repurchase form. This equivalence rests on the idea that the firm has the same assets, capital structure, and future
opportunities in either case, If the cash was paid out as a dividend, then it is fully taxable. However, if it was paid out as a repurchase, the payment results in a capital gain to shareholders of the amount of the purchase.3 However, most of this capital gain is accrued and not realized.
To make the share repurchase strategy absolutely clear, consider the simple example outlined in Table l. A company is originally financed by the issue of 100 shares at $10 each. The company uses the $1000 proceeds to purchase
Table 1
Example of Dividend Payment and Share Repurchase for Hypothetical Firm
Initial 100 shares $10/share $1,000
Financing
Profit $
1/share
$ 100Value at $11/share $1,100
End of Year
Strategy A Strategy B
$1 Dividend Payment/Share Repurchase $100 worth of Shares
Cash Received $100 $100
by Shareholders
Value of Firm 1,000 1,000
after Transaction
# of Shares 100 90.91
Price per Share $10 $11
Taxes Owed* $28 $2.55
Accrued Capital Cain** $
0.00
$90.91*
Assumes personal tax rate of 28%. **
Accrued
capital gains will generate a future tax obligation if realized. A recent estimate of the effective tax rate on accrued capital gains iscompetitive market value of the firm is now $1100 ($11 per share) as the company now consists of a fully restored $1000 machine and $100 cash.
Consider two strategies of returning the $100 earnings to the
shareholders. If the money is paid out as a dividend, then the personal tax bill will be $28, if the marginal tax rate of the equity holders is 28 percent. The net of tax receipts from the dividend are $72. The value of the company would return to $1000 or $10 per share after the dividend payment. On the other hand, if the firm used its $100 to buy 9.09 of its shares at a price of $11, then the total realized gain by those who sell their shares to the firm is $9.09, assuming that the sellers are among those who originally financed the
firm at a $10 per share price, and the tax on that $9.09 would be $2.55. Note that in this example the company's shares will remain at $11 after the repurchase and that thus the remaining 90.91 shares each have an accrued gain of one dollar. These accrued gains will generate some taxes for the government, although the present value of those tax collections depends on average holding periods, as well as the use of the escape of capital gains taxes on assets which pass through estates.
This example highlights the much lower personal taxes which result from share repurchases relative to dividends, under the above mentioned taxation assumptions. Even so, it still may exaggerate what would actually be paid with share repurchase. In the real world, investors have bought their shares at different times and at different prices, and those most likely to tender their shares back to the company will be those with the lowest reservation price on holding the shares.5 These would include shareholders who have actually
lost money on their investments. This indicates that the government may actually get no immediate revenue from those who receive the corporate cash. The example also illustrates that the advantage of share repurchase over
dividends exists even when realized capital gains are taxed at the same rate as dividends (as is the case both in the example and in the new tax law).
The tax advantage of share repurchase relative to dividends may be a powerful explanation of why share repurchases have grown. However, as it hinges on the fact that capital gains are taxed on a realization basis and escape taxation when passed through estates (rather than depending on characteristics of the
firm), it is not an argument which can be readily addressed with cross-section econometrics. However, it does suggest that dividend yield on the common stock and, perhaps, increases in the dividend rate may be predictors of participation in share repurchase activities. The tax advantage implies that share
repurchase may be a substitute means of transmitting cash to shareholders, and therefore firms with high dividend yields or which have increased dividends might be less likely to repurchase shares.
B. Transition Mechanism for Adjusting Debt-Equity Ratio
In the absence of transactions costs and taxes at both the personal and corporate level, and with fully informed investors, shareholders would be
indifferent regarding the price offered in a share repurchase plan. In a
fundamental way they are buying the shares from themselves, so the indifference comes from their being both the buyer and the seller. However, the existence of heterogeneity of shareholders creates a potential transfer between those who sell and those who do not. This effect is diminished if all shareholders have an equal right to participate, and if shares are purchased on a pro rata basis in the event the offer is oversubscribed (as is required by SEC rule 13e-4).
With no taxes, as Modigliani-Miller (1958) demonstrated, the value of the firm is also invariant to its financial structure. However, in the presence of both personal and corporate taxes, there appears to be a substantial tax
income tax, whereas dividends and other equity earnings are not. Miller (1977) however argues that while the aggregate amount of debt in the economy is determinant, the capital structure for any individual firm is irrelevant, as return on debt and equity incorporate taxes (the weak form of the Modigliani-Miller theorem). This result is empirically supported by Trzcinka (1982). In contrast, Ross (1985), allowing for uncertainty, shows firms with an interior optimal debt-equity ratio. The standard model of a firm's optimal debt-equity ratio involves first order conditions trading off the tax advantages of debt against the agency costs of debt, as well as its inflexibility in times of crisis. That is, higher debt ratios increase the likelihood of incurring the
real costs associated with bankruptcy.
An adequate model of optimal debt-equity ratios would, of necessity, be very complex and would depend on variables that are unobservable in publicly
available information about the firm, including uncertainty and restrictions on the creation of state-contingent claims. However, it is possible to predict some changes in the environment facing the firm that might cause it to want to adjust its leverage ratio. For instance, a change in the underlying riskiness of the firm (perhaps due to the maturing of a market or the resolution of some technological uncertainties) may allow the firm to operate with a higher
leverage ratio and enjoy more of the tax advantages of debt. This change in risk, or many other factors, may cause higher equity values. When the stock market valuations increase dramatically (as they certainly have in the past four years), the leverage ratios of fins are automatically lowered. In many cases, it will be optimal for the firm to at least partially offset this change in financial ratios by issuing debt and absorbing equity. When the tax rate applicable to bonds is decreased, the optimal aggregate debt level increases, even in a Miller analysis. Both dividends and share repurchases absorb equity. However, share repurchases may be a better mechanism for the transitional
purpose of changing the debt-equity ratio than an increased dividend (suggested by the work of Feldstein and Green (1983)) because of the penalty that the
market imposes on firms which subsequently cut their dividend.
Taxes and transaction costs alter investors near neutrality regarding the price offered in share repurchase programs. Higher prices mean that more of the cash paid out will be taxed as a realized capital gain and less as a return of capital. However, this effect is probably outweighed by the leverage
adjustment effect of higher equity prices just mentioned. Therefore, the underlying theory suggests that higher share prices will encourage share
repurchases rather than discourage them (which is the common wisdom). As well, there will be an economy wide increase in debt to equity expected given a
decline in taxation levels applicable to bonds.
One problem with the explanation of share repurchases as a transition instrument in adjusting debt-equity ratios is that it depends on the difference between actual leverage and optimal leverage, a variable which can neither be observed nor predicted. In the empirical analysis to follow, we include the actual debt-equity ratio as an explanatory variable. The theory does not, how-ever, predict even the sign of its influence on the share acquisition activities.
C. Share Repurchases As an Anti-Takeover Strategy
Another reason that one might expect to observe firms buying back their own shares in preference to paying dividends is that doing so could be part of an anti-takeover strategy (Simon (1986)). If a company pays cash out as a dividend, then the cash is given to all shareholders in proportion to their share holdings. However, if the cash is used to make a share repurchase tender offer, only those who tender their shares (or a pro rata proportion of those tendered) will receive cash from the firm. Due to heterogeneous inframarginal rents to holding across shareholders, there exists an upward sloping supply
curve representing the price at which shareholders are willing to sell. The cash dividend does not change the distribution of reservation values, while the share repurchase buys out those with the lowest reservation prices, leaving behind those who would sell only when offered a premium above the tender offer price. In addition, the position of the supply curve endogenizes the distribu-tional choice and its affect on the potential of takeover. If a successful raider must obtain a given fraction of the outstanding shares, it is shown that under varied conditions repurchase increases the cost of takeover vis a vis
dividends. This explanation is consistent with the recent spate of repurchases motivated solely as merger deterence. We therefore would predict an increase in restructurings, especially repurchase, in response to the threat of takeover.
D. Free Cash Flow and Share Repurchases
Jensen (1986) analyzes the principal-agent problem that exists when an organization generates substantial free cash flow. Managers have the incentive
to increase the resources under their control, and need to be motivated not to grow beyond wealth maximization. Given this incentive, managers with such substantial free cash flow may choose repurchase or dividends instead of investments. This choice allows control over future cash flow which would be lost if the resources were invested.
Issuance of debt to buy back stock creates an incentive for managers to overcome their inefficiencies. The fixed payment pattern of the debt permits them to commit to transferring resources to their financial claimants. Jensen focuses on the example of the oil industry in the late 1970s, with simultaneous free cash flow and necessary industry shrinkage. He documents that such firms were purchasing other companies, as well as restructuring, consistent with the agency costs of free cash flow. The theory suggests a positive effect of cash flow on the probability of repurchase and acquisition.
The free cash flow hypothesis also implies that firms with low levels of investment, or poor internal investment opportunities, are more likely to engage in share repurchase. A potentially useful but imperfect measure of internal investment opportunities is the ratio of price to book value. This ratio approximates Tobin's "q" ratio, in our attempt to capture the "q° theory of investment first developed in Tobin (1969).
An expectation of future cash flow is theorized to be signalled through cash disbursed to shareholders in a tender offer. Vermaelen (1981) finds the per share earnings of tendering firms are above pre-announcement time series model predictions, which he interprets as evidence of the tender offer as an announcement of favorable earnings prospects. Dann (1981) concludes as well that the information signalled by repurchase may be improvements in cash flows. Ofer and Thakor (1986) differentiate the repurchase signal from the signal
implied by dividend payments. This signalling of cash flow hypothesis reconfirms the free cash flow expectation of repurchase motivated by high cash flow.
E. Equivalence of Mergers and Acquisitions and Share Repurchase
In the absence of informational problems, taxes, and transactions costs, buying the shares in another company is nearly equivalent to buying back your
own. Rather than returning cash to the shareholders, the firm instead buys a financial investment. If the market value of the acquired asset is equal to what is paid for it,6 then in the absence of transaction costs the
acquisition is as good as cash to the holders of the stock in the acquiring firm. If there are transaction costs, they would have to be taken into
account since some investors might now prefer cash, and some investors may want to rebalance their portfolio after the acquisition.
While it is certainly true that if we relax the above assumptions, share repurchases and acquisition may serve different purposes, both convey similar
tax advantages relative to dividends in transfering value to shareholders in a manner which results in capital gains (both realized and accrued) rather than ordinary income. However, the actions are not similar in that a merger or acquisition does not absorb equity, while repurchase does not a priori increase debt. These policies, therefore, are not perfect substitutes in attaining optimal debt-equity ratios. This implies that previous appreciation in the firm's stock price may positively predict acquisitions (if the acquisition is done to increase leverage), and similarly. may encourage share repurchases
(if done to absorb equity).
The equivalence of the two share acquistion policies requires strong sets of assumptions. It is an interesting empirical issue, however. We separate regressions of the phenomena, unwilling to cx ante accept the hypothesis that the two actions are perfect substitutes. We desire to investigate whether the hypothesis appears credible.
F. Quality Management and Clientele Effects
For many economists, the payment of dividends, appearing to be tax disadvantaged, remains a puzzle despite the multitude of theories offered to explain them.7 Share acquisition seems to offer too much tax saving not to be preferred to dividends. But, the tax argument is only true for some classes of investors. Nontaxable institutions are indifferent to the taxed-based arguments, and such institutions are very large market participants. With transaction costs, it can be argued that such organizations as pension funds and private university endowments might find dividends the preferred form of return.
The implications of this argument are the existence of clienteles, to which firms may specialize. Those firms which pay returns as dividends may be held disproportionately by tax-exempt organizations, while those who retain earnings, repurchase shares, or engage in mergers will be predominantly held by
taxable owners. While the necessary taxation information is not included in our data source, we do know a firm's previous participation history. If the clientele theory is valid, certain firms would be expected to have a propensity to perform these actions year after year.
There are other poorly understood aspects of corporate accounting and financial behavior. One is the choice of inventory accounting techniques, particularly in times of inflation. Firms can choose between FIFO and LIFO. With inflation FIFO generally leads to larger reported and taxable profits than LIFO. FIFO seems to be a non-optimizing choice, as if investors cannot "see through" the accounts to ascertain real earnings. We can examine whether some managements are more likely to take advantage of tax saving opportunities, if they exist, by seeing whether the firms which use the tax efficient LIFO policy are those who also use nondividend means of transferring value to their
shareholders.
III. Measurement Model and the Specific Hypotheses
We are interested in modeling the binary choice of whether to do an action of repurchase or acquisition, to study how various explanatory variables affect the probability of participation in such action.
This model is motivated by the definition of an unobserved random variable, the value of the contemplated action, as a linear function of some observed characteristics of the firm and an unknown disturbance,
(1) value (action) — XE
+
£such
that the firm chooses the action if its value exceeds some criticalconstant (which can be zero). This value is not directly observable, however. Given this limitation, binary probit analyzes the explanatory variables of the choice between the discreet alternatives of whether or not to do the action,
representing the choice with a dummy variable. If the disturbance c is normally distributed, the probability that the action will be performed is given by the cumulative normal function of XE, and a maximum likelihood estimator of the coefficients B is available which yields consistent and
asymptotically normal estimates. (See, for example, Amemiya (1985), Chapter 9.)
Data
The data were collected from the 1984 Compustat Industrial, Over the Counter (hereafter OTC), and Industrial Research files. They allowed 2399, 853, and 1289 original observations, respectively. 29 observations were immediately removed, as they lacked all data and firm identification information.
While we are interested in predicting participation in share repurchase
activities, we want to exclude those small repurchases motivated by the elimination of odd lot holders. Therefore, we classify a firm as participating only if they acquire at least one-half of one percent of their outstanding share equity value.
Use of a computerized data source increased our sample, but it also limited our data selection. While we would like to test the hypotheses of tax advantages of repurchase, the data source lacks information on the distribution of basis values and the percentage of holders who escape taxation through death. We
thus attempted instead to calculate a marginal tax rate of the firm, although this proved impossible due to missing data in our source file.
We have argued various relationships between the leverage ratio and cash acquisition. We therefore created the variable DBEQXY, the previous year's debt-equity ratio (of book values). (Hence, XY — 75 for the 1976 regression, and XY — 83 for the 1984 regressions.) We have created DIVINC, the percentage increase in dividends, to test the substitutability of dividends and acquisitions.
While we would like to test whether repurchase is a response to the threat of takeover, financial statement data does not include whether a threat of
takeover, either overt or covert, exists. Therefore, for the large sample we sacrificed such manually gathered information.
To represent the free cash flow and signalling of cash flow hypotheses, we created a cash flow ratio, CASHRAT, which is operating income before depreciation as
scaled by total assets.8 The cash flow hypothesis also implies the relevance of levels of investment and the potential importance of a measure of internal invest-ment opportunity. We therefore created INVRAT, a ratio of the increase in
investment to the value of total assets. We created PRICEEK, the ratio of closing price to book value, as an indicator of internal investment
opportunities.
If firms are using acquisition and repurchase to achieve an optimal debt-equity ratio, price appreciation should encourage repurchase. We therefore create PRICE, an average of the ratios of this year's to previous year's high, low, and close stock prices.
Clientele arguments suggest repurchase is done by firms with low dividend yield. We include the previous year's ratio of dividends to share equity value, DIVRATXY, to examine this hypothesis. To test the clientele theory, we are also interested in previous participation history. We therefore include dummies for previous years participation in repurchase and acquisition,
REPXYO1, ACQXYOI, as a statistic for such habit-formation.9
The hypothesis that managers smart about taxes should use nondividend payments is tested by the inclusion of a dummy, IVADUM, whether the firm used LIFO or not.
The remaining data sample of 4512 fins were purged of missing data relevant for respective 1976 or 1984 regressions. This resulted in corresponding samples of 2366 and 1820 fins. In Appendix One the data and the resultant samples are analyzed in detail.
Hypotheses
If the hypotheses of the previous sections are correct, we have expectations about directions and (in)significance of the coefficients.
The increase in general equity levels due to the stock market growth is hypothesized to result in finns desiring to increase their relative leverage by absorbing equity. Such absorption can be accomplished through repurchase. In addition, the optimal economy-wide level of debt is increased by the decline in the marginal tax rate applicable to bonds. Acquisition of a firm with higher leverage can assume increased debt in a controlled way. This may suggest a negative relationship between the debt-equity ratio and these actions in 1984, with insignificance in 1976.
The free cash flow hypothesis implies a positive relationship between the cash flow ratio and the probability of both repurchase and acquisition. That repurchase is believed to signal future cash flow may strengthen the implied relationship in the repurchase probit.
The free cash flow hypothesis also suggests that these actions are the result of low levels of investment or poor internal investment opportunities. This would be consistent with negative effects of the investment ratio and our q approximation for both regressions.
If firms use acquisition and repurchase to obtain an optimal debt-equity ratio, we would expect price appreciation consistent with the action, implying a positive effect on the probability of the action of price.
To test clientele and habit formation hypotheses would predict significant positive coefficients as previous action participation dummies. One indication of relative substitutability between actions is whether previous repurchase is correlated with acquisition and vice versa. The clientele effect also predicts a negative relationship between the dividend ratio and repurchase.
We expect a negative relationship between the percentage dividend change and both actions if they are substitutes to dividends. We would also expect low divi-dend yield firms to repurchase as an alternative to dividivi-dend payment. We there-fore expect a negative relationship between the dividend ratio and repurchase.
Our test for smart tax managers implies a positive relationship between the use of LIFO and repurchase. Similarly, the tax advantage of acquisitions relative to dividends would imply a positive relation between LIFO and
acquisitions.
We are also interested in the "importance" of the explanatory variables, specifically, in what magnitude they alter the probability of the event (a l realization). As well, certain relationships across equations are suggested above. We test between regressions to determine whether a specific action is stable over time. A finding of functional change across periods would
reject the null hypothesis that the model has no structural change across time.
IV.
Empirical
ResultsEstimation of the Model
1976 Probits
The results of estimating the parameters in the 1976 repurchase model are reported in Table 2. The table reports the estimated intercept and
coefficients, (Newton-Raphson) standard errors, and the associated t-statistics. The coefficients on the cash flow ratio and the 1975 repurchase dummy are
positive and significant (at the .01 level). The coefficient on the 1975
dividend ratio is significant and negative (at the .01 level). The coefficient on the dividend increase is significant (at the .05 level). The q coefficient is negative and significant (at the .10 level). The results of estimating the parameters in the 1976 acquisition model are reported in Table 3. Price, the
Table 2
Probit Results: 1976 Repurchase
Parameter Estimate Standard Error t-statistic
C -1.4944 0.13292 -11.243 DBEQ7S • -0.020791 0.018974 -1.0958 IVADUM 0.045305 0.084147 0.5384 PRICE 0.093848 0.077867 1.2052 DIVRAT75 -2.8016 1.3843 -2.0238 DIVINC 0.015698 0.0093417 1.6805 PRICEEK -0.16917 0.12481 -1.3555 CASHRAT 1.2997 0.41114 3.1612 INVRAT -2.1806 1.3688 -1.5931 ACQ7SO1 0.095025 0.095518 0.99483 REP7SO1 1.2879 0.076755 16.779
Table 3
Probit Results: 1976 Acquisitions
Parameter Estimate Standard Error t-statistic
C -1.6359 0.13386 -12.221 DBEQ7S -0.0087033 0.01529 -0.56922 IVADUM -0.042665 0.08894 -0.47971 PRICE 0.17752 0.080086 2.2166 DIVRAT7S 0.68498 1.2701 0.53931 DIVINC -0.011283 0.023986 -0.47039 PRICEEK -0.33940 0.13608 -2.4941 CASHRAT 0.47754 0.41487 1.1510 INVRAT -1.4709 1.0590 -1.3889 ACQ75OI 1.4180 0.082344 17.220 REP75O1 0.2502 0.089383 2.7992
1975 acquisition and the 1975 repurchase dummies are significant (at the .01 level). The coefficient on our q approximation and the LIFO dummy are
significant and negative (at the .01 level), as is the coefficient on the investment ratio (at the .10 level).
1984 Probits
The results of estimating the parameters in the 1984 repurchase model are reported in Table 4. The cash flow ratio and repurchase dummy are significant (at the .01 level). Our estimate of q is significant and negative (at the .01 level). Our estimate of previous debt equity ratio and dividend ratios are neg-ative and significant (at the .05 level). The results of estimating the par-ameters in the 1984 acquisition model are reported in Table 5. The 1983 acqui-sition dummy is significant (at the .01 level), as is 1983 repurchase (at
the .025 level) and price (at the .05 level). Our estimate of q is significant and negative (at the .01 level), as is the 1983 debt-equity ratio (at the .05 level).
Importance of Variables
We are interested in a notion, beyond significance, of the importance of variables. Estimations of coefficients are not sufficiently informative as to
the increase in the probability of the event occuring given a unit increase in the independent variable. Specifically, we look at how the probability of an action changes given a one standard deviation movement in each independent
variable, to normalize their impact on the change in probability. Table 6 gives the mean probability derivatives from each probit equation and the corresponding standard deviation of each explanatory variable. We create a local
approximation of the change in probability of the event given a one standard deviation change in an explanatory variable. We look specifically at those variables found significant in the probit analysis.
Table 4
Probit Results: 1984 Repurchase
Parameter Estimate Standard Error t-statistjc
C -0.86760 0.11660 -7.4408 D3EQ83 -0.041099 0.018833 -2.1823 IVADUM 0.0039503 0.075612 0.052244 PRICE -0.066828 0.11204 -0.59646 DIVRAT83 -0.26751 0.14577 -1.8351 DIVINC 0.025752 0.020095 1.2815 PRICEBK -0.40250 0.10352 -3.8881 CASHRAT 1.2656 0.34522 3.6660 INVRAT 0.32775 0.39551 0.82867 ACQ83O1 , 0.013805 0.08801 0.15686 REP83OI 1.2116 0.080552
Table S
Probit Results: 1984 Acquisitions
Parameter Estimate Standard Error t-statistic
c
-1.0912 0.10729 -10.171 DBEQ83 -0.033963 0.017968 -1.8902 IVADUM -0.074560 0.079762 -0.93477 PRICE 0.15823 0.092566 1.7094 DIVRAT83 -0.038568 0.16559 -0.23292 DIVINC 0.023759 0.020565 1.1553 PRICEBK -0.50669 0.13278 -3.8159 CASHRAT 0.35187 0.32602 1.0793 INVRAT 0.021597 0.40756 0.05299 ACQ83O1 1.1762 0.082768 14.211 REPB3O1 0.19808 0.087585 2.2615Table 6
Importance of Explanatory Variables
Parameters dp/dx (1) Standard Deviation (2)
A
Probability (1) x (2) Standard dp/dx Deviation (1) (2) A Probability (1) x (2) 1976 Repurchases 1976 Acquisitions 1976 DEEQ7S -0.00428 3.25688 - .0139394 -0.00163 3.25688 - .0053087 IVADTJM 0.00933 0.39778 .0037112 -0.00798 0.39778 - .0031742 PRICE 0.01933 0.43843 .0084748 0.03320 0.43843 .0145558 DIVRAT7S -0.57718 0.03149 - .0181753 0.12811 0.03149 .0040341 DIVINC 0.00323 4.05034 .0130825 -0.00211 4.05034 - .0085462 PRICERK -0.03485 0.41987 - .0146324 -0.06347 0.41987 - .0266491 CASHRAT 0.26775 0.10373 .0277737 0.08931 0.10373 .0092641 INVRAT -0.44924 0.06235 - .0280101 -0.27509 0.06235 - .0171518 ACQ75O1 0.01958 0.33796 .0066172 0.26519 0.33796 .0896236 REP7SO1 0.26532 0.36128 .0958548 0.04679 0.36128 .0169042 1984 Repurchases 1984 Acquisitions 1984 DBEQ83 -0.01150 3.41099 - .0392263 -0.00856 3.41099 - .0291980 IVADUN 0.00111 0.45003 .0004995 -0.01880 0.45003 - .0084605 PRICE -0.01869 0.36276 - .0067799 0.03989 0.36276 .0144704 DIVRAT83 -0.07483 0.45437 - .0340005 -0.00972 0.45437 - .0044164 DIVING 0.00720 1.45608 .0104837 0.00599 1.45608 .0087219 PRICESK -0.11259 0.57582 - .0648315 -0.12774 0.57582 - .0735552 CASHRAT 0.35403 0.17869 .0632616 0.08871 0.17869 .0158515 INVRAT 0.09168 0.08341 .0076470 0.00544 0.08341 .0004537 ACQ83O1 0.00386 0.37984 .0014661 0.29655 0.37984 .1126415 REP83O1 0.33893 0.38720 .1312336 0.04994 0.38720 .0193367We find the dummy predicting habit formation most drastically affects the probability of all of the outcomes. For instance, in the 1984 repurchase equation, a one standard deviation move in the dummy variable for 1983
repurchase changes the probability of repurchase by .131. This is an enormous change, particularly relative to the overall sample mean probability of 1984 repurchase of .2632. The derivative figure indicates that having repurchased last year (the dummy variable equals unity) versus not having done so changes the 1984 repurchase probability by .339 holding other factors constant.
Our estimate of q is also important in all equations. A one standard deviation increase in the price-to-book ratio in 1984 would have decreased the probability of a firm participating in repurchase by 6.5 percentage points. This suggests that firms with low internal investment opportunities seek to spend their money elsewhere.
Analysis of the importance of explanatory variables indicates that certain factors are more important for particular actions or at particular times. The cash flow and previous dividend ratio variables are important in both
repurchase equations, consistent with the free cash flow hypotheses. The debt to equity and dividend ratios are also important in both repurchase equations. Conversely, price appreciation is influential in changing the probability of acquisitions in both 1976 and 1984. Both the price-to-book ratio and the habit variables are consistently important, though more so in 1984.
Model Specification Predictions
The percentage correct of the model prediction is the sum of correctly predicted outcomes scaled by the total number of observations. The percentage correct of the 1976 repurchase, 1976 acquisition, 1984 repurchase, and 1984 acquisition models are .849, .866, .783, and .813 respectively. These imply that the model allows predictive capability. However, we desire further
interpretation of the predictability. Thus, we explicitly compare our models to a "naive" model. As the naive model we have chosen knowledge of the
aggregate ratios of actual one dummies to nonoccurences, and predict accordingly. Complete aggregate information is itself a demanding standard of comparison.
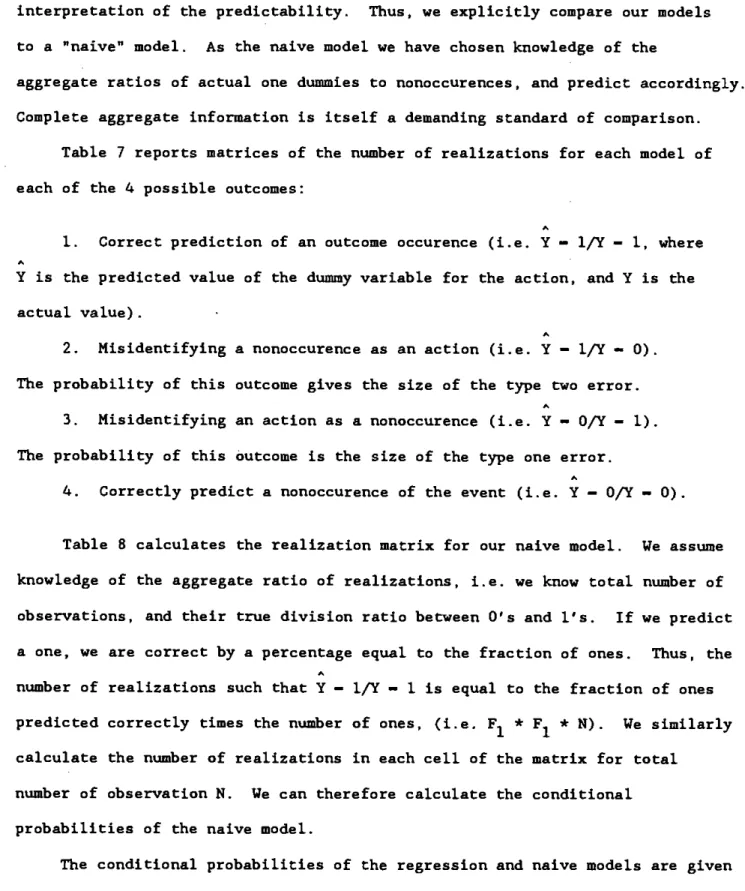
Table 7 reports matrices of the number of realizations for each model of each of the 4 possible outcomes:
A
1. Correct prediction of an outcome occurence (i.e. Y —
1/?
—I,
where AY is the predicted value of the dummy variable for the action, and Y is the actual value).
A
2.
Misidentifying a nonoccurence as an action (i.e. Y —l/Y
a
0).
The probability of this outcome gives the size of the type two error.A
3. Misidentifying an action as a nonoccurence (i.e. Y —
Oft
—1).
The probability of this outcome is the size of the type one error.A
4.
Correctly predict a nonoccurence of the event (i.e. Y — O/Y —0).
Table B calculates the realization matrix for our naive model. We assume knowledge of the aggregate ratio of realizations, i.e. we know total number of observations, and their true division ratio between 0's and l's. If we predict a one, we are correct by a percentage equal to the fraction of ones. Thus, the
A
number of realizations such that Y —
lfY
— 1 is equal to the fraction of ones predicted correctly times the number of ones, (i.e. F1 *F1
*
N).
We similarlycalculate the number of realizations in each cell of the matrix for total number of observation N. We can therefore calculate the conditional probabilities of the naive model.
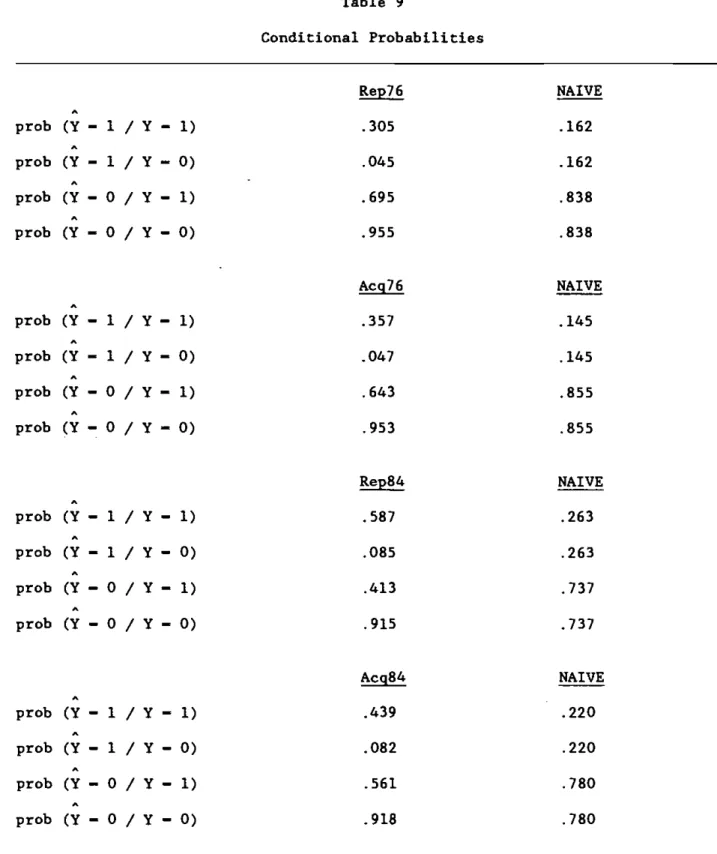
The conditional probabilities of the regression and naive models are given in Table 9. Our model excels in improving the size of type I error, as well as increasing the power of our predictions.
Table 7 Prediction Realizations Table 8 Naive Predictions A
1
F1F0N____FN
—
F1 —fraction
of ones F0 —fraction
of zeros — N —total
number number of ones total number number of zeros total number Repurchase 1976 A Y <.5 Acquisition 1976 A Y <.5 0Y
1 0Y
1 Repurchase 1984 A Y <.5 1982 384Y
0 1 2024 342N—2366
N—2366
1341 479Y
0 1 1421 399N—1820
N—1820
Acquisition 1984 A Y.
5 <.5Y
0 1 <.5FN
F1F0NTable 9 Conditional Probabilities Rep76 NAIVE A
prob
(Y—
1/Y —1)
.305 .162 Aprob
(Y — 1/
1—
0)
.045 .162 Aprob
(Y — 0/
Y—
1) .695 .838prob (Y—0/Y—0)
.955 .838 Acg76 NAIVE Aprob
(Y—1/Y—l)
.357 .145 Aprob
(Y—1/Y—0)
.047 .145 Aprob
(Y—0/Y—l)
.643 .855 Aprob
(Y—O/Y—O)
.953 .855 Rep84 NAIVE Aprob(Y—1/Y—l)
.587 .263 Aprob
(Y — 1 / Y —0)
.085 .263 Aprob
(Y—0/Y—l)
.413 .737 Aprob
(Y — 0 /Y
—
0) .915 .737 Acg84 NAIVE Aprob
('11 — 1 / Y—
1) .439 .220 Aprob
(Y — 1 / Y—
0) .082 .220 Aprob
(Y—0/Y—1)
.561 .780 Aprob
(Y — 0 / Y—
0) .918 .780Structural Change Across Time
Initial observation of the results may suggest structural change across
time.1° Given repurchase, the inventory ratio is significant and negative in 1976 and insignificant (and of opposite sign) in 1984. While the previous dividend ratio is significant and negative in 1976, it lacks such significance in 1984.
Similarly, while the 1975 repurchase dummy is significant in the 1976 acqui-sition model, it is not as significant in 1984. The LIFO dummy is significant and negative in 1976, but insignificant in 1984. Conversely, the previous year's debt-equity ratio is significant and negative in 1984, though insignificant in 1976.
We can also expect some structural change across time given how the relative importance of the parameters change over time. The investment ratio alters the probability of repurchase far more in 1976 than in 1984. Our
approximation of q alters the probability of acquisition far more in 1984 than 1976. In both, habit formation is more important in 1984. In addition to the possibility of changes in the Probit coefficients, the increased occurrence of both repurchases and acquisitions suggests that an intercept shift may also have occurred over time.
We test for structural change within action across time with the likelihood ratio test. The test is computed as
11 —
2(L2
-L1)
where L2 is the value of the likelihood function for the maximum of the unconstrained model and L1 is the value with imposed constraints. This
statistic is assymptotically distributed as a chi-squared variable with degrees of freedom equalling the difference in the number of constraints.
We are interested in testing for the homogeneity of the vector of slope, allowing for the possibility of an intercept shift. We therefore create a time-specific dummy so that the intercept may take on different values in the two
subperiods.
Thus, we compute likelihood ratio statistic (LR) in Table 10 for tests of structural change across time. The statistic is compared to a chi-squared with ten degrees of freedom (23.209 at P —
.01).
We fail to reject the nullhypothesis of no structural change of slope for both repurchase and acquisition (as neither 13.96 nor 9.89 exceeds 23.209). Thus, despite the apparent
changes in individual coefficients, we cannot statistically reject a constant structure of the determinants of participation.
V. Conclusions
The variables suggested by the various hypotheses regarding nondividend cash payments collectively have substantial power in predicting participation in share repurchase and acquisitions. For instance1 relative to a naive model based on correct aggregate ratios, our probit estimators reduce the occurrence
of type two error (misidentifying a nonoccurrence of the event) by roughly a factor of three.
Among the hypotheses surveyed, perhaps the free cash flow theory is most consistent with our findings, particularly the share repurchase ones. The cash flow variable and the price-to-book ratio (our 'q" approximation) had the
correct sign, were statistically significant, and were quantitatively important both in 1976 and 1984. The coefficient on the price-to-book ratio is
consistently negative, significant, and important in both the repurchase and the acquisition probits. This suggests, consistent with Tobin's "q" theory and Jensen's free cash flow hypothesis, that finns which sell at a discount
Table 10
Tests of Structural Change
I. ACROSS TIME
Repurchase
Unconstrained Constrained
LOG
L
(repl6) LOG L (all repurchase)-886.125 -1799.90
LOG L (rep84) -906.792
2(-886.l25 -
906.792
+ 1799.90)
—(at
P—.0l, critical level—23.209) LR —13.96
Acquisition
Unconstrained Constrained
LOG
L
(acql6) LOG L (all acquisition)-809.508 -1636.90
LOG
L
(acq84)-82 2.448
2(-809.508 -
822.448 + 1636.90)
—4 (at
P—.0l, critical level—23.209) LR —9.89
acquisitions, presumably as an alternative to the uprofitable further
investments in their primary activity. The investment ratio was marginally significant and consistent with the free cash flow theory for repurchases in 1976, but its coefficient was insignificant in 1984.
Consistently, the variable with the largest t statistic and the one which most greatly affects the probability of an action is participation the
preceeding year. Thus, these activities seem to be "habit forming." This trait is consistent with the clientele hypothesis which asserts that fins specialize in how they transmit cash to their owners.
The tests for structural change across time fail to reject the hypothesis that the determinants of these actions are unchanged. This may be somewhat surprising, given that their aggregate levels have increased so dramatically. We do demonstrate that the intercept has time dependence. The failure to find structural change in the determinants of participation suggests that the above mentioned theories were consistently operative in bothyears examined.
In further work, we plan to examine how these phenomena are affected by the 1986 tax change just enacted. The major realignment of the tax environment may dramatically affect these aspects of corporate financial, behavior.
Appendix I The Data
We began with 2399 Industrial, 853 OTC, and 1289 Research observations. 29 lacked all information including cusip. Thus, we manipulated from 4512 original observations, to the resultant 2366 and 1820 points for 1976 and 1984, respectively.
Table Al lists the Compustat definitions of our dependent variables. It should be noted that included are both cash and stock-swap acquisitions.
Analysis of Mergers and Acquisitions data indicates the vast majority of 1984 acquisitions were cash deals, suggesting that the inclusion of stock-swaps should not strongly affect our analysis for that year.
The 1984 research file consists of companies deleted from other Compustat files due to acquisition/merger, bankruptcy, liquidation, delisting, or
inconsistent reporting. Thus, many of these may have had observations for 1976 (if it were pre-delisting) though not for 1984. This is one explanation of the disparity between the number of 1976 and 1984 data samples.
We then created dummy variables for repurchasing and acquisitions, giving missing values a 0. We did this as Compustat counts insignificant figures as not available. Thus, as missing data are potentially in actuality
insignificant, we set them equal to 0 to maximize the information obtainable from the dependent variables. (Note, however, that given that often a firm has many, or all, points missing, many of these firms were subsequently "relost" by missing another variable.) The repurchase dummy was assigned a one only if the firm acquired more than one-half of one percent of its oustanding share equity value. We also created the inventory dummy to be I if either the firm chose solely LIFO, or else LIFO was the primary choice of two inventory valuation methods, else 0.
TSP Probit executes only for complete observations, so firms with any of the necessary variables missing were eliminated. We then eliminatedany debt-equity ratios which were either negative or exceeded 100, as we found ratios outside these parameters implausible, and suggestive of erred data. This therefore resulted in samples of 2366 and 1820.
Table Al
Acquisitions
"The funds for, or the costs relatirg to, the acquisition of a company in a current or prior year as reported on the statement of changes."
Includes:
1. Cost of net assets of business acquired
2. Acquisition of additional ownership (decrease in minority interest) 3. Additional interest in company (if company is consolidated)
4. Retail assets in business acquired
S. Property, plants and equipment of acquired company
6. Long term debt assumed in acquisition
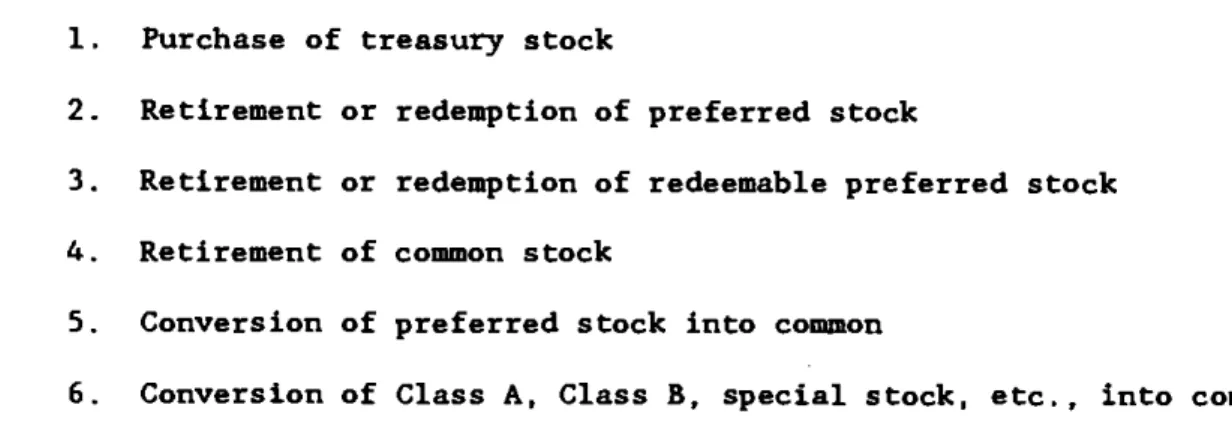
Repurchases
"Use of funds which decreases common and/or preferred stock."
Includes:
I. Purchase of treasury stock
2. Retirement or redemption of preferred stock
3. Retirement or redemption of redeemable preferred stock 4. Retirement of common stock
S. Conversion of preferred stock into common
Footnotes
1. See, for example, Auerbach (1983).
2. Cordon and Bradford (1980) argue that the implications of tax rules for the preference of capital gains is not so unambiguously in favor of capital gains. The importance of the differentials between ordinary income and capital gains taxation in dividend policy is still an unsettled issue. See, in addition, Miller and Scholes (1982).
3. The repurchase is treated as capital gains if, according to Section 302 of the U.S. IRS code, •the redemption is "substantially disproportionate." The Vermaelen (1981) sample has only 3 out of 105 tender offers subject to ordinary income taxes.
4. This example is found in Shoven (1986).
5. Recent studies have demonstrated how differing basis values
given capital gains taxation result in such choices. The Balcer and Judd (1985) life cycle model shows the optimal decision rule to be the selling of those with the highest basis values first. Simon (1986) also demonstrates how
heterogeneous basis values of shareholders results in selling by those with the lowest basis last.
6. There is no evidence that the rate of return on the common stock of the acquiring firm
is
abnormal, whereas there is an excess return enjoyed by the holders of the securities of the acquired firm (Dennis and Mcconnell (1986)).7. See, for example, Black (1976).
8. At the suggestion of Jerry Green, we examined an alternative measure of cash flow. It approximated the free cash flow available after replacement investment scaled by total assets. In general, the qualitative results were unchanged.
9. A problem with the one-year lagged participation variables is that some repurchase and share acquisition programs span more than one calendar year. To consider whether this overlap biased the lagged participation
coefficient, we ran the Probits with a two year lagged repurchase dummy. Its significance and importance remained.
10. We chose 1976, instead of the decade preceeding 1984, 1974, given the Nathan and O'Keefe (1986) finding of a structural change event in 1974. We therefore want to separate out this finding from other structural change and chose two periods on the same side of their shift.
11. We do note, however, that the dummy variable coefficient is significant in both constrained probits (with t-statistics of 7.801 and 6.290,
References
Ainemiya, Takeshi. 1985. Advanced Econometrics, Harvard University Press, Cambridge, Massachusetts.
Auerbach, Alan J. 1983. "Taxation Corporate Financial Policy and the Cost of Capital," Journal of Economic Literature 21 (September):905-940. Balcer, Yves and Kenneth L. Judd. 1985. "Optimal Consumption Plans and
Portfolio Management with Duration-Dependent Returns," CMSEMS Discussion Paper No. 662, (September).
Black, F. 1976. "The Dividend Puzzle," Journal of Portfolio Management, pp.5-8.
Copeland, Thomas E. and J. Fred Weston. 1983. Financial Theory and Corporate Policy, Addison-Wesley Publishing Co., Reading.
Dann, Larry Y. 1981. "Common Stock Repurchases," Journal of Financial Economics 9:113-138.
Dennis, Debra K. and John J. McConnell. 1986. "Corporate Mergers and Security Returns," Journal of Financial Economics 16,2 (June):l43-187.
Elton, E. J. and M. J. Gruber. 1970. "Marginal Stockholders' Tax Rates and the Clientele Effect," Review of Economics and Statistics (February):68-74. Fama, E., L. Fisher, M. Jensen, and R. Roll. 1969. "The Adjustment of Stock
Prices to New Information," International Economic Review (February):1-21. Feldstein, Martin and Jerry Green. 1983. "Why do Companies Pay Dividends?"
American Economic Review 73,1 (March):17-30.
Cordon, Roger H. 1982. "Interest Rates, Inflation, and Corporate Financial Policy," Brookings Papers on Economic Activity 2:461-491.
Cordon Roger H. and David F. Bradford. 1980. "Taxation and the Stock Market Valuation of Capital Gains and Dividends," Journal of Public Economics
Jensen, Michael C. 1986. "The Takeover Controversy: Analysis and Evidence," Working Paper MERC
#86-01,
University of Rochester (July)._____________ 1986. "Agency Costs of Free Cash Flow, Corporate Finance and Takeovers," American Economic Review 76,2 (May, Papers/Proceedings):323-329. Jensen, Michael C. and William Meckling. 1976. "Theory of the Firm: Managerial
Behavior, Agency Costs, and Ownership Structures," Journal of Financial Economics 3:305-360.
Johnston, J. 1984. Econometric Methods, McGraw-Hill Book Co., NY.
Judge, George C., W. E. Griffiths, R. C. Hill, H. Lutkepohl and T. C. Lee. 1985. The Theory and Practice of Econometrics, John Wiley & Sons, NY. Kraus, A. and R. Litzenberger. 1973. "A State-Preference Model of Optimal
Financial Leverage," Journal of Finance (September):91l-922.
Long, J. C., Jr. 1978. "The Market Valuation of Cash Dividends: A Case to Consider," Journal of Financial Economics 6,2/3 (June/September):235-264. Masulis, Ronald W. 1980. "Stock Purchase by Tender Offer: An Analysis of the
Causes of Common Stock Price Changes," Journal of Finance 35,2 (May):305-321. Miller, Merton H. 1917. "Debt and Taxes," Journal of Finance 32,2 (May):
261-275.
Miller, Merton H. and Myron S. Scholes. 1978. "Dividends and Taxes," Journal of Financial Economics, 6:333-364.
_____________ 1982. "Dividends and Taxes, Some Empirical Evidence," Journal of Political Economic, 90:1118-1141.
Miller, Merton H. and Kevin Rock. 1984. "Dividend Policy Under Asymmetric Information," Unpublished manuscript. University of Chicago.
Modigliani, F. and M. H. Miller. 1958. "The Cost of Capital, Corporation Finance and the Theory of Investment," American Economic Review
Modigliani, F. and M. H. Miller. 1963. "Corporate Income Taxes and the Cost of Capital," American Economic Review, (June):433-443.
Nathan, Kevin S. and Terrance B. O'Keefe. 1986. "The Rise in Takeover Premiums: An Explanatory Study," Unpublished manuscript, Oakland University and University of Oregon (July).
Ofer, Aharon R. and Anjan V. Thakor. 1986. "A Theory of Stock Price
Responses to Alternative Corporate Cash Disbursement Methods: Stock Repurchases and Dividends," Unpublished manuscript, KCSM Northwestern and Indiana Business
(August).
Pettit, R. R. 1977. "Taxes, Transactions Costs and Clientele Effects of Dividends," Journal of Financial Economics (December):419-436.
Ross, Stephen A. 1985. "Debt and Taxes and Uncertainty," The Journal of Finance, 40,3 (July):637-658.
Schaeffer, S. 1982. "Tax-Induced Clientele Effects in the Market for British Government Securities," Journal of Financial Economics, 121-159.
Schipper, K. and R. Thompson. 1983. "The Impact of Merger-Related Regulations on the Shareholders of Acquiring Firms," Journal of Accounting Research, 184-221. Shoven, John B. 1986. "The Tax Consequences of Share Repurchases and Other
Nondividend Cash Payments to Equity Owners," Presented at the "Economics of Tax
Policy"
Conference of the National Bureau of Economic Research,Washington, D.C. (November 17).
Simon, Laurie B. 1986. "Share Repurchase and the Deterrence of Merger," Unpublished manuscript, Stanford University (September).
Summers, Lawrence H. 1981. "Taxation and Corporate Investment: A q-Theory Approach," Brookings Papers on Economic Activity 1:67-140.
Tobin, James. 1969. "A General Equilibrium Approach to Monetary
Theory," Journal of Money, Credit and Banking, 15-29.
Trzcinka, Charles. 1982. "The Pricing of Tax-Exempt Bonds and the Miller Hypothesis," Journal of Finance 37,4 (September):907-923.
Vermaelen, Theo. 1981. "Common Stock Itepurchases and Market Signalling: An Empirical Study," Journal of Financial Economics (June):139-183.