Initial Returns of Shariah versus Non-Shariah IPOs: Are There Any Differences?
(Pulangan Awal Saham TAA Patuh Shariah dan Tidak Patuh Shariah: Adakah Wujud Perbezaan?)Ruzita Abdul-Rahim
(Faculty of Economics and Management, Universiti Kebangsaan Malaysia) Nor Azizan Che-Embi
(Kulliyyah of Economics and Management Sciences, International Islamic University of Malaysia)
ABSTRACT
This study examines a sample of 384 initial public offerings (IPOs) issued and listed on Bursa Malaysia from January 1999 to December 2008. The objectives of this study are to examine the difference in initial returns of Shariah versus non-Shariah IPOs and the factors that explain the initial returns of these IPOs. A matched sample of Shariah IPOs, which contains the same number of IPOs and share similar characteristics with the non-Shariah IPOs, is created to ensure a more compatible comparison. The results of the difference tests consistently show that the initial returns of non-Shariah IPOs are not statistically different from those of all and matched sample of Shariah IPOs. The cross-sectional multiple regressions yield results demonstrating that Shariah and non-Shariah IPOs share only one common factor: allocation rate. Other than the sole common factor, the initial returns of non-Shariah IPOs are determined by external factors, namely the reputation of the underwriter and the condition of the market. On the contrary, the initial returns of the Shariah IPOs (all) depend on internal factors, namely the size of the offer; the age of the firm; and the ownership of the
top five shareholders. As far as the result of the matched Shariah sample is concerned, none of the other variables are significant in explaining the initial returns.
Keywords: IPO initial return; Shariah IPOs; non-Shariah IPOs; allocation rate; growth motive ABSTRAK
Kajian ini menguji satu sampel 384 saham tawaran awam awal (TAA) yang diterbitkan dan disenaraikan di Bursa Malaysia dari Januari 1999 hingga Disember 2008. Objektif kajian ini adalah untuk mengkaji pulangan awal saham TAA patuh Shariah berbanding yang tidak patuh Shariah dan juga faktor-faktor yang menjelaskan pulangan awal saham-saham TAA tersebut. Satu sampel padanan bagi saham TAA patuh Shariah yang mengandungi bilangan saham TAA yang sama dan mempunyai ciri-ciri yang sama dengan saham TAA tidak patuh Shariah dibentuk untuk memastikan perbandingan adalah lebih setara. Hasil ujian perbezaan secara konsisten menunjukkan pulangan awal saham tidak patuh Shariah secara statistik tidak berbeza dengan semua dan sampel padanan saham TAA patuh Shariah. Regresi berganda keratan rentas memperoleh hasil yang menunjukkan saham TAA patuh Shariah dan tidak patuh Shariah hanya mempunyai satu faktor lazim, iaitu kadar agihan. Selain faktor lazim tersebut, pulangan awal saham TAA tidak patuh Shariah ditentukan oleh faktor-faktor luaran iaitu reputasi penajajamin dan keadaan pasaran. Sebaliknya, pulangan awal saham TAA patuh Shariah (semua) bergantung kepada faktor-faktor dalaman iaitu saiz tawaran, umur syarikat, dan pemilikan lima pemegang saham terbesar. Manakala bagi sampel padanan saham TAA patuh Shariah pula, pulangan awalnya tidak dipengaruhi oleh mana-mana faktor tersebut.
Kata kunci: Pulangan awal saham TAA; saham TAA patuh Shariah; saham TAA tidak patuh Shariah; kadar agihan; motif pertumbuhan
INTRODUCTION
An initial public offering (IPO) is a major event for
companies because it provides access to new external equity capital necessary for future growth; creates a secondary market to improve the liquidity of the shares;improves the visibility of the company in the market; allows firms to restructure to achieve the target capital structure; and creates an effective exit strategy for venture capitalists and/or original owners. Most studies (e.g., Loughran et al. 1994; Reilly & Hatfield 1969; McDonald & Fisher 1972; Ibbotson & Jaffe 1975; Chowdhry& Sherman 1996) that
examine IPOs focus on the puzzlingly abnormal initial
returns that are realized by investors at the initial stage of the new shares listing. Also known as underpricing, the significantly abnormal initial return of IPOs occurs when
the offer price is set much lower than the price on the first trading day or when the price on the first day of listing increases much higher than the offer price.
Malaysian IPOs have received considerable attention
from contemporary researchers (e.g., Dawson 1987; Yong 1991; Wu 1993; Ariff & Shamsher 1999; Jelic et al. 2001; Abdullah & Mohd 2004; Yong 1991, 1997, 2007). Nevertheless, studies focusing on the Islamic segment of
IPO markets are still limited (Abdul-Rahim & Yong 2008,
2010). The limited attention given to the Islamic segment of the IPO market continues despite the fact that worldwide,
investors, regardless of religion or other beliefs, are increasingly concerned and demand investments that are Islamic, ethical, and/or socially responsible. In the context of the Malaysian equity market, Shariah-compliant status appears to be a major concern for the Securities Commission (SC) even though, in reality, Malaysian stock
market players and public listed companies (PLC) owners
are predominantly non-Muslim entities. In 2004, the SC
introduced pre-IPO Shariah-compliant status, a policy that
allows IPO issuers to leverage on Shariah-compliant status
because their client base can be easily widened to include foreign Muslim investors, particularly from the rich Middle-East countries. In brief, this policy is consistent with the Malaysian vision tobe the international hub of theIslamic capital market.
The focus on Shariah-compliant status is also motivated by Moshirian et al. (2009), who, upon finding evidence of varying degree of abnormal performance of
IPOs across countries in pan-Asian markets, attribute the
variation to unique country-specific features. In the context of the Malaysian IPO market, one of its uniqueness is the
Shariah status that some of its IPOs carry. The proposition
that Shariah status possesses a certain degree of influence on the initial performance of an IPO initial performance is
based upon the fact that in order to be awarded the Shariah compliance status, IPO issuers are required to undergo
an additional screening process certifying whether the core business activities of the companies are permissible (halal) and ethical, while the portion of income that stems from prohibited activities and investments is kept within a reasonably tolerable level.
As shown in Figure 1, the majority of public listed companies (PLCs) in Bursa Malaysia are Shariah-compliant
and the percentage continues to grow. The significance of Shariah-compliant status is that the status functions as a certification by the market regulator (i.e., the SC in the
case of Malaysia)1 that companies that have undergone and passed the Shariah-compliant screening process generate their incomes from businesses that are free from prohibited (haram), unethical or socially irresponsible elements. The screening criteria of Shariah-compliant companies are comprehensive in the sense that the criteria examine companies forelements of certainty, integrity, justice and accountability in addition to the basic halal or haram rules. Details of the Shariah screening criteria are provided in the Appendix. Throughout the course of the present study, Shariah-compliant IPOs will be interchangeably referred
to as Shariah IPOs, whereas IPOs that do not comply with
the Shariah screening criteria are interchangeably referred to as non-Shariah or conventional IPOs.
FIGURE 1. Growth in the Islamic segment of the Malaysian equity market
1200 No. of Counters 90 Shariah/All (%) 1000 85 800 80 600 75 400 70 200 65 0 Shariah Counters 1999 544 745 73 604 789 77 638 807 79 684 868 79 722 889 81 787 947 83 857 1011 85 886 1029 86 853 991 86 855 980 87 2000 2001 2002 2003 2004 2005 2006 2007 2008 All Counters Shariah/All (%)
In a nutshell, the process of obtaining the Shariah-compliant status creates a product differentiation between
IPOs with Shariah-compliant status and those IPOs without
the status. Accordingly, Shariah status is expected to create additional demand because, like other products or services, real or financial investments in entities with Shariah-compliant status are not only meant for the Muslim investors, but for all investors generally. Based upon this argument, the present study proposes that IPOs
that carry Shariah-compliant status perform differently from those IPOs that without the status.
In explaining the anomalous initial return of IPOs,
many studies forward arguments that revolve around information asymmetry and adverse selection between the issuers (insiders) and investors (outsiders). The present study also proposes that the initial returns of Shariah IPOs are influenced by factors that differ from
those that influence the initial returns of their non-Shariah counterparts. In short, the present study expands upon the work pioneered by Abdul-Rahim and Yong (2008, 2010) by imposing a stricter rule for the comparison of the initial returns of Shariah and non-Shariah IPOs.
The remainder of this paper is organized as follows. The next section reviews previous studies on IPO initial
performance; the determinant factors of IPO initial
performance; and the underlying theories of abnormal behavior in IPO markets. This is followed by a section
describing the research methodology employed to test the hypotheses. The last two sections discuss the results; and conclude and explain the implications of the results.
LITERATURE REVIEW
The anomalous initial return of IPOs is widely accepted
as a universal phenomenon. One of the most cited studies concerning IPO initial returns is the constantly updated
study by Loughran et al. (1994)2, which finds that abnormal
IPO initial returns exist in all 25 countries selected in the
continuous study. The results are consistent with several other pioneer studies that investigate the initial returns of IPOs, including the examination of IPOs in the US by
Ibbotson and Jaffe (1975); in the UK by Chowdhry and
Sherman (1996); in Singapore by Lee et al. (1999); in Malaysia by Dawson (1987) and Yong (1991, 1997); and in Australia by Finn and Hingham (1988).
Despite the widely accepted anomaly of IPO
initial returns, the causes and varying degrees of such anomaliescontinues to be the substance of debate around the world. One of the most widely cited theoretical explanations for the anomalous initial return phenomenon is the winner’s curse hypothesis (Rock 1986), which posits that adverse selection is the main problem that restrains uninformed investors from entering the IPO market. To
ensure their IPOs are successful, issuers and underwriters
must underprice the new issues to regain or attract the interest of uninformed investors in the IPOs. Other
widely accepted theoretical explanations concerning the anomalous initial returns of IPOs include signaling models3 (Leland & Pyle 1977); the faddish behavior of investors4 (Aggarwal & Rivoli 1990); and cascades or bandwagon effects in the IPO market5 (Welch 1992).
Moshirian et al. (2009) attribute the varying degree of initial returns across countries to the country-specific features. Documenting evidence on the performance of IPOs
in pan-Asian markets between 1991 and 2004, the study finds that the initial returns of Malaysian IPOs (61.81%)
exceeds those in developed Asian markets,including Hong Kong (21.43%), Japan (34.04%) and Singapore (33.10%). The Malaysian IPO market is known for its uniqueness,
which includes the characteristics relating to Shariah status and ownership distribution of IPOs to Bumiputra6. Abdul-Rahim and Yong (2008, 2010) examine the role of Shariah status and find that the status does not have a significant influence on the initial returns of IPOs in Malaysia. The
results imply that, despite the emphasis and advantages offered by Shariah-compliant status, the status does not appear to contribute to a significant differential between the initial returns of IPOs issued by Shariah-compliant
PLCs and the initial returns of IPOs issued by non-Shariah PLCs.
The findings by Abdul-Rahim and Yong (2008, 2010) are paradoxical because, as explained in the earlier section, carrying a Shariah-compliant status means that the activities of company should be free from any form of prohibited elements, including riba or interest-based transactions; unethical elements; and doubtful transactions. In other words, passing the screening process should create a competitive advantage for the issuing companies, which, in turn, should create additional demand for Shariah IPOs.
However, a flaw exists in the studies by Abdul-Rahim and Yong (2008, 2010) because comparisons between Shariah and non-Shariah IPOs are made without taking
into consideration the difference in sample size and, more importantly, the differences in the characteristics of the two samples being compared.
EXPLANATORY VARIABLES OF IPO INITIAL PERFORMANCE
In examining the initial performance of Shariah versus non-Shariah IPOs and the factors that explain the performance,
the present study focuses on three factors that have been neglected or have not received enough attention in previous studies, despite the fact that information on most of these factors is disclosed in the prospectus. Recognizing the significance of such information may help investors to make informed decisions about IPOs. The three factors are
allocation rate, operating risk and growth motive. Allocation Rate Allocation rate provides an estimate of the probability that the investors’ subscription is successful based on the rate of IPOs allocated to them. Allocation rate
is expected to have a negative relationship with initial returns because, when the probability for investors to win (get the allocation) is high, it demonstrates that the IPOs
are not adequately subscribed (demanded) by informed investors. In other words, a low subscription due especially to reluctant participation from informed investors should be taken as a reliable indication that the IPOs are not likely
to be of high quality, and, therefore, not likely to generate a high initial return. Amihud et al. (2003) argue that the relationship between the allocation rate to subscribers and the level of IPO initial returns reflects the existence of
winner’s curse or adverse selection in the IPO market.
Growth Motive The present study also examines the motivation behind the issuers’decisions to issue IPOs by
calculating the percentageof the proceeds from IPOs that is
allocated for growth. The percentage of proceeds utilized for growth, or growth motive, is expected to send a signal about the future prospect of the companies. The importance of growth motive is documented in various studies that explore the issues of growth in IPOs (e.g., Chung et al.
2005; Leone et al. 2007; Chahine et al. 2007). Chung et al. (2005) test the relationship between initial returns and growth opportunities and find that the relationship is consistently positive. Chahine et al. (2007) discover that
growth opportunities have a positive relationship with investment in R&D activities. This finding implies that if
an insufficient amount of the IPO proceeds are allocated to
finance growth, company growth will slow down which eventually results in decreases in the firms’ value. Leone et al. (2007) find that the relationships between R&D and
growth opportunities vary due to differences in the national systems of corporate governance; and firm size.
Operating Risk One of the listing requirements of Bursa Malaysia mandates issuing firms to demonstrate a good track record of profitability. Zheng and Stangeland (2005) find that initial returns have a positive relationship with growth rates in sales and EBITDA (earnings before
interest, taxes and depreciation). Meanwhile, Shen et al. (2008) discover the price of IPOs increases tremendously
due to misperceptions concerning earnings and find that a positive relationship exists between initial returns and discretionary earnings. The present study uses the standard deviation of EBITDA prior to IPO to measure the operating
risk of the issuing firms. Based upon the risk-return trade-off theory, the higher the operating risk, the higher the initial returns.
Control Variables In addition to the three factors, the present study recognizes other factors that are found to be significant in explaining the initial returns of IPOs: the
reputation of underwriters (Jelic et al. 2001; Abdullah & Mohd 2004); firm size (Abdul-Rahim & Yong 2008; Abdullah &Mohd 2004; Yong 1996, 2008); firm age (McDonald & Fisher 1972); offer size (Abdul-Rahim & Yong 2008, 2010);ownership of top 5 shareholders (Abdullah & Mohd 2004); and market conditions (Afirudin 2004; Ritter 1984).
RESEARCH METHODOLOGY
The present study employs a data set of fixed-priced
IPOs issued from January 1999 until December 2008 and
listed on either the Main Board, the Second Board or the
MESDAQ of Bursa Malaysia (previously known as the
Kuala Lumpur Stock Exchange). On 25 March 2008, the Main and Second Boards were merged to form the Main Market, while the MESDAQ was converted to the ACE
market. The year 1999 is selected as the starting point to minimize the adverse effects of the 1997/98 Asian financial crisis on the analysis. Although similar effects are expected to be found during the 2007/08 US sub-prime
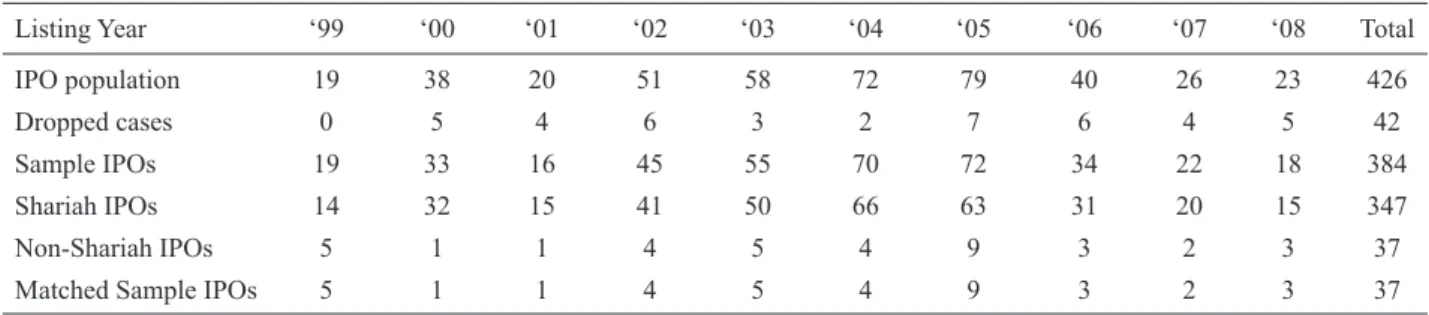
crisis, the Malaysian market was not adversely affected to the extent that it was affected by the 1997/98 Asian financial crisis. As reported in Table 1, a total of 426 new issues are found during the 10-year study period.
SAMPLE AND MATCHED SAMPLE
Similar to Abdul-Rahim and Yong (2008, 2010) and Yong (2007), the present study selects a sample of IPOs that are
offered as public issue; offer for sale; private placement; and hybrid of the aforementioned forms. The selection criteria essentially exclude special purpose IPOs, such as
restricted offers for sale; restricted public issues; restricted offers for sale to eligible employees; restricted offers for sale to Bumiputra investors; special and restricted issues to Bumiputra investors; tender offers; and special issues. Special purposes IPOs are rare and including them may
lead to a less meaningful outcome (Abdul-Rahim & Yong 2008; Yong 2007). IPOs issued under REITS category are
also excluded due to the differing format of financial statement presentation. Based upon these selection criteria, the present study examines a final sample384 IPOs.
TABLE 1. Distribution of IPOs population and sample by year of listing, 1999 to 2008
Listing Year ‘99 ‘00 ‘01 ‘02 ‘03 ‘04 ‘05 ‘06 ‘07 ‘08 Total
IPO population 19 38 20 51 58 72 79 40 26 23 426
Dropped cases 0 5 4 6 3 2 7 6 4 5 42
Sample IPOs 19 33 16 45 55 70 72 34 22 18 384
Shariah IPOs 14 32 15 41 50 66 63 31 20 15 347
Non-Shariah IPOs 5 1 1 4 5 4 9 3 2 3 37
Matched Sample IPOs 5 1 1 4 5 4 9 3 2 3 37
Note: The percentage of IPOs that are Shariah-compliant is consistent with the percentage of PLCs with Shariah-compliant status (Figure 1).
The main objective of the present study is to test whether the performance of Shariah IPOs differs from
that of the non-Shariah IPOs. As noted above, similar
studies by Abdul-Rahim and Yong (2008, 2010) find no difference between Shariah and non-Shariah IPOs. The
present study expands upon the works of Abdul-Rahim & Yong (2008, 2010) by examining whether or not the lack of difference is due to the incompatibility of the groups being compared. Table 1 demonstrates that the total number of Shariah IPOs is nearly 10 times greater than
non-Shariah IPOs. Therefore, the present study proposes
that the difference between Shariah and non-Shariah
IPOs can be examined more appropriately by creating a
matched sample of Shariah IPOs that is of equal size and
shares similar characteristics with those of non-Shariah
IPOs. The characteristics used to select and construct the
matched sample of 37 Shariah IPOs are as follows: (i) the
year of the IPO issuance; (ii) the board on which the IPOs
are seeking listing; (iii) the sector of the issuing firm’s core business; (iv) the offer size of the IPOs; and (v) the
Data for this study are gathered from various sources, including OSIRIS; Investors Digest (one of Bursa Malaysia
publications terminated in mid-2004); the websites of Bursa Malaysia and the Malaysian Issuing House (MIH);
the prospectuses of the IPOs; and the annual reports of the
issuing firms.
INITIAL PERFORMANCE
The initial performance of IPOs, which is the variable to
be explained in this study, is measured using the initial returns of the IPOs. The two methods most commonly used
for calculating initial returns are based upon the opening price on the first day of trading; and the closing price on the first day of trading (e.g., Agarwal et al. 2008; Ritter 1998; Dawson 1987; Yong 1991). To conserve space, the present study employs only the formulation based upon opening price. The preference for opening price over closing price is based upon the argument that the price that prevails at the opening of the listing day is subject toless trading noises than the price that prevails at the closing of the listing day. The formulation for the initial return (IPORTN) is as follows: 1 100 OPEN i i OFFER i P IPORTN P = − × (1) where POPEN
i is the opening price on the listing day and POFFER
i is the offer price of the ith IPO.
EXPLANATORY VARIABLES
When examining the factors that explain the initial returns of Shariah versus non-Shariah IPOs, the present study
focuses on eight explanatory factors:allocation rate; operating risk; growth motive; firm size; firm age; offer size; underwriter reputation; and market condition.
Allocation rate (ALLOCT), which is adopted from Amihud et al. (2003), is calculated as follows:
1 1 1 i i i OSR OSR ALLOCT + = − + a a log (2)
where α is 0.5/N; Nis the sample size; and OSR is the oversubscription ratio, which represents the ratio of units subscribed to units offered. ALLOCT represents the allocation rate that the subscribers are likely to receive of their order on an IPO. Item α is added in Equation (2) so
that ALLOCT must be positive, but is, at most, equal to 1 (0 < ALLOCT ≤ 1.0). Note that if ALLOCT equals 1, the investors are allocated with all the IPOs for which they subscribe. As
explained by Amihud et al. (2003), undersubscribed IPOs
will be absorbed by underwriters or else the IPO fails. In
the sample of IPOs examined in the present, 6 such cases of IPOs that fail to get full subscription exist and the ALLOCT values for these IPOs are accordingly equal to 1.0.
The growth motive (GROWTH) of the IPOs is measured
as the percentage of proceeds utilized for growth activities, including allocation for working capital; R&D expenditure;
and capital expenditure.Operating risk (OPERISK) is measured using the standard deviation of EBITDA over the
three years prior to the IPO, as represented in the following
formulation:
(
)
1 1 2 2 3 1 2 t tOPERISK − EBITDA EBITDA
− = −
∑
= Ln(
)
1 1 2 2 3 1 2 t tOPERISK − EBITDA EBITDA
− = −
∑
= Ln (3)The firm’s size (COSIZE) is measured based upon total assets, which is transformed into the natural log to standardize the data. Meanwhile, the offer size (OFSIZE) is measured by multiplying the number of shares offered by the offer price (NOSIxPOFFER) and then transformed using the natural log. The firm’s age (AGE) is defined as the number of years that the issuing companies have been in business (i.e., from the incorporation of the firm through the listing year of the firm’s IPOs). Ownership structure,
specifically concentrated ownership,is defined as the total ownership of the top five shareholders of the issuing companies (OWNER5), which is calculated as follows:
5 1 s i s i i shares NOSH OWNER5 =
∑
= , (4) where sharess,i = number of shares of major shareholder s = 1,…, 5 of the ith firm; and NOSHi = total number of shares outstanding.
The reputation of underwriter (DUNDWTR) takes a
value of 1 if the main underwriter of the IPO is one of
the five ‘reputable’ underwriters and 0 if otherwise. The present study uses Bursa Malaysia’s list of reputable investment bankers in 2007 and 2008 to identify reputable underwriters, which includes CIMB Investment
Bank Berhad; HWANGDBS Investment Bank Berhad; AMINVESTMENT Bank Berhad; KENANGA Investment Bank
Berhad; and OSK Investment Bank Berhad.
Market condition is also represented by a dummy variable (DMKT),which takes a value of 1 if the market is
in “hot” condition and 0 if otherwise. The present study follows Afirudin (2004) in defining a hot market as one when the volume of offering and number of new listings are high. For this study period, the market condition during a 4-year period(i.e., from 2002 to 2005) is considered hot, while the market is cold during the remaining 6 years (1999 to 2001; and 2006 to 2008).
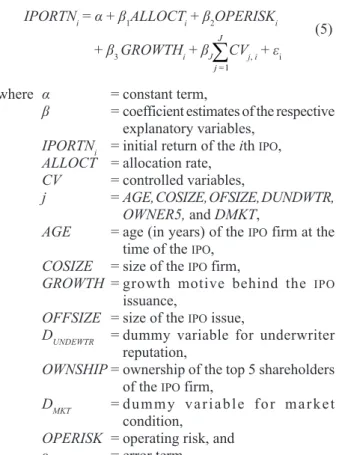
MODEL SPECIFICATION
The econometric equation that represents the regression ofinitial returns on allocation rate, growth motive, operating risk and the six control variables defined in the earlier section is represented as follows:
IPORTNi = α + β1ALLOCTi + β2OPERISKi + β3 GROWTHi + βJ 1 J j
∑
= CVj, i + εi (5)where α = constant term,
β = coefficient estimates of the respective explanatory variables,
IPORTNi = initial return of the ith IPO,
ALLOCT = allocation rate, CV = controlled variables,
j = AGE, COSIZE, OFSIZE, DUNDWTR, OWNER5, and DMKT,
AGE = age (in years) of the IPO firm at the
time of the IPO,
COSIZE = size of the IPO firm,
GROWTH = growth motive behind the IPO
issuance,
OFFSIZE = size of the IPO issue,
DUNDEWTR = dummy variable for underwriter reputation,
OWNSHIP = ownership of the top 5 shareholders of the IPO firm,
DMKT = dummy variable for market condition,
OPERISK = operating risk, and
ε = error term.
Equation (5) is run using cross-sectional multiple regressions. Before reporting the regression results, econometric issues, such as multicollinearity, autocorrelation, and heteroskedasticity, are tested and corrected (if any) to ensure the estimated coefficients are reliable to provide a basis for meaningful interpretation.
RESULTS OF THE STUDY
Table 2 summarizes the profiles of the 384 selected IPOs
that are issued and listed between January 1999 and
December 2008. The Shariah IPOs are offered at a price that
is approximately 20 percent lower than the non-Shariah
IPOs. Relative to the non-Shariah IPOs, the Shariah IPOs
are also trading at lower opening and closing prices on the day of listing. Furthermore, the gaps between the opening and closing prices for Shariah IPOs are found to be greater
than for non-Shariah IPOs, indicating that investors have
more divergent opinions concerning the value of Shariah
IPOs than the value of non-Shariah IPOs.
A higher oversubscription ratio (OSR) for the Shariah IPOs indicates that these IPOs are more demanded relative
to the non-Shariah IPOs. This finding is consistent with
the argument that Shariah IPOs are gaining popularity
compared to their non-Shariah counterparts. Muslim investors may contribute to the higher demand for Shariah
IPOs since such investors are typically more attracted to
investments that comply with Shariah rules. The higher
OSR could also be attributed to the smaller supply of
Shariah IPOs. Note that the offer size of the Shariah IPOs
(RM49,087,003) is, on average, much smaller than that of
the non-Shariah IPOs (RM130,559,047). In other words, the
demand for IPOs is similar in both Shariah and non-Shariah IPOs (constant numerator), but the OSR of Shariah IPOs is
higher due to the smaller supply of such IPOs (smaller
denominator).
Of the total proceeds that are raised from the IPOs,
only slightly more than half (57%) are allocated for growth purposes. This finding is consistent with Jelic et al. (2001), who find that only 56 percent of companies allocate proceeds from IPOs to growth or expansion activities. Jelic
et al. (2001) use a sample of 182 Malaysian IPOs listed
on the Main Board of Bursa Malaysia between 1980 and 1995. Shariah IPO issuers, especially the matched Shariah IPO issuers respectively allocate 62 percent and 73 percent
for growth purposes. The aforementioned percentages are high in relation to the non-Shariah IPO issuers, which
only allocate 42 percent of IPO proceeds for the growth
purposes. TABLE 2. Profiles of Malaysian IPOs, 1999-2008
Items Whole Shariah Non-Shariah Matched Shariah
Offer Price (RM) 1.11 1.08 1.34 1.37
Opening Price (RM) 1.44 1.41 1.70 1.65
Closing Price (RM) 1.42 1.40 1.66 1.65
Over-Subscription Ratio (times) 31.40 32.50 21.16 25.32
IPOs with Reputable Underwriter 52.34% 51.87% 56.76% 48.65%
Offer Size (RM’000) 56,937.17 49,087.00 130,559.05 159557.38
Total Proceeds (RM’000) 39,360.35 32,617.36 102,598.63 76402.07
Proceeds For Growth (RM]000) 22,428.05 20,208.76 43,241.43 56095.34
Proceeds to Offer Size (%) 69.13 66.45 78.58 47.88
Growth to Proceeds (%) 56.98 61.96 42.15 73.42
Total Asset (RM’000) 218,378.55 194,576.46 441,603.61 496,180.03
Average EBITDA (RM’000)a 19,184.39 18,256.59 27,885.69 31,800.12
Standard Deviation of EBITDA 18,604.19 19,409.65 7,825.73 10,382.09
Firm’s Age (Year) 4.70 4.57 5.92 5.81
Top 5 Ownership (%) 59.21 59.21 59.29 64.72
Number of IPOs, N 384 37 347 37
Non-Shariah IPOs are larger than Shariah IPOs
in regards to total assets and offer size by 2.27 times and 2.66 times, respectively. The differences reduce significantly when Shariah IPOs are represented by the
matched Shariah sample. Nonetheless, investors of Shariah IPOs should probably be concerned with the
lower profitability (EBITDA) and more so with the nearly
3 times greater variability of EBITDA compared to those
reported by non-Shariah firms. Again, the differences between Shariah and non-Shariah IPOs reduce substantially
once the comparison is performed in a more compatible manner (i.e., by comparison against the matched Shariah sample).Little difference is found between the IPO firms in
relation to age and ownership concentration, although the results concerning the latter indicates that the ownerships of Malaysian firms are highly concentrated (OWNER5 ∼
60%) to five major shareholders.
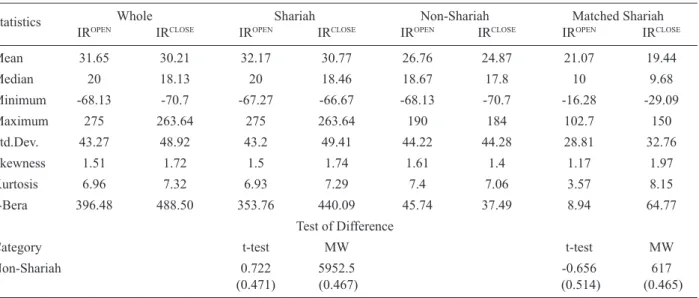
INITIAL RETURNS OF SHARIAH VERSUS NON-SHARIAH IPOS
Table 4 reports the descriptive statistics of the IPO initial
returns over the 10-year study period for the whole sample, which includes Shariah IPOs; non-Shariah IPOs; and
matched Shariah of IPOs. The initial returns,based upon
closing price, are also reported for reference purposes. On average, the initial return for the whole sample of 384 IPOs
is 31.65 percent. Previous studies (e.g., Dawson 1987; Yong 1991; Ku Ismail et al. 1993) on Malaysian IPOs report
initial returns that are consistently higher than 100 percent for earlier periods, which span from 1978 until 1989. In later periods, from 1990 to 1995, Yong et al. (2001) report an average initial return of 81 percent. The declining trend of initial returns of Malaysian IPOs continues in more
recent years. For instance, for the period from 1999 to 2007, initial returns decline to 32 percent (Abdul-Rahim & Yong 2008), which is also consistent with the findings reported concerning IPOs in the present study.
TABLE 3. Descriptive statistics of IPO initial returns
Statistics Whole Shariah Non-Shariah Matched Shariah
IROPEN IRCLOSE IROPEN IRCLOSE IROPEN IRCLOSE IROPEN IRCLOSE
Mean 31.65 30.21 32.17 30.77 26.76 24.87 21.07 19.44 Median 20 18.13 20 18.46 18.67 17.8 10 9.68 Minimum -68.13 -70.7 -67.27 -66.67 -68.13 -70.7 -16.28 -29.09 Maximum 275 263.64 275 263.64 190 184 102.7 150 Std.Dev. 43.27 48.92 43.2 49.41 44.22 44.28 28.81 32.76 Skewness 1.51 1.72 1.5 1.74 1.61 1.4 1.17 1.97 Kurtosis 6.96 7.32 6.93 7.29 7.4 7.06 3.57 8.15 J-Bera 396.48 488.50 353.76 440.09 45.74 37.49 8.94 64.77 Test of Difference
Category t-test MW t-test MW
Non-Shariah 0.722 5952.5 -0.656 617
(0.471) (0.467) (0.514) (0.465)
Notes: Jarque-Bera statistics are all significant at the 1% level, indicating that the initial returns of the sample IPOs are not normally distributed. Non-normal distribution is, however, considered a stylized fact for financial data (Bali & Cakici 2004). MW refers to non-parametric Mann-Whitney U test. In tests of differences, figures in parenthesis represent the p-value. Tests of differences are done on IROPEN only.
The Shariah IPOs report initial returns (32.2%) that
are very similar to the whole sample. This finding is somewhat expected because most (about 90%) of the
IPOs carry Shariah status. The results concerningthe initial
returns of Shariah IPOs in the present study is consistent
with that documented in Abdul-Rahim and Yong (2008, 2010). The initial returns of Shariah IPOs are higher than
that of the non-Shariah group (26.8%), although the standard deviations of these initial returns are similar. However, when the characteristics of the sub-samples are considered by comparing the non-Shariah IPOs with
the Shariah matched IPOs, the non-Shariah IPOs appear
to perform better. However, the standard deviation of the initial returns is much smaller for the matched Shariah than non-Shariah IPOs. Overall, the results indicate that
although the initial returns for matched Shariah IPOs are
slightly lower, the variations among IPOs are smaller,
which allows the performances of these IPOs to be more
easily predicted. However, despite the seemingly different initial returns between Shariah (all and matched sample) and non-Shariah IPOs, the results of the independent
t-test and Mann-Whitney U test in Table 4 consistently demonstrate that no statistical differences exist between the two IPO groups.
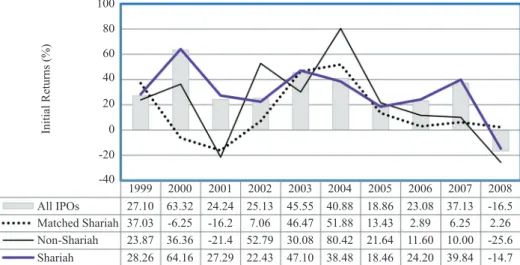
The pattern of yearly initial returns, which are based upon offer-to-open prices, is illustrated in Figure 2. For the whole sample, the highest average initial returns are reported in 2000 (63.3 percent). Good performance is also reported in 2003 and 2004, with reported initial returns of 45.6 percent and 40.9 percent, respectively. Shariah IPOs
also report the highest average initial returns during these periods: 64.2 percent in 2000; 47.1 percent in 2003; and 38.5 percent in 2004. This similarity can also be linked to the composition of Malaysian IPOs, where most firms are
Shariah compliant. Non-Shariah IPOs are slightly different
are reported in 2004 (80.42%), followed by 52.78 percent in 2002. The matched Shariah IPOs show a hybrid feature
between the non-Shariah and the Shariah IPOs in general.
Like non-Shariah IPOs, the matched Shariah IPOs report
the highest initial return reported in 2004, but report the second highest initial returns in 2003 in a fashion similar
to Shariah IPOs generally. Interestingly, the results for the
matched sample suggest that Shariah IPOs that have similar
characteristics to non-Shariah IPOs do not appear to offer
initial returns which are similar to either their non-Shariah counterparts or the remaining Shariah IPOs.
DOES SHARIAH STATUS INFLUENCE IPO INITIAL RETURNS?
Before proceeding to the analysis concerning determinants of initial returns, the present study performs a cross-sectional multiple regression analysis, which adds a dummy variable (DSHARIAH) representing IPOs with
Shariah status in Equation (5). The results are expected to strengthen those of the difference tests, which may not be powerful enough to address such an important issue because the tests do not consider the influence of other variables. This additional analysis is also important because it allows the present study to re-examine a question that remains unanswered by the examinations
performed by Abdul-Rahim and Yong (2008, 2010), who claim Shariah status plays no particular role in the Malaysian IPO market because it does not alter the patterns
in the initial returns of new shares despite the emphasis on the Shariah investment. The results of the present analysis, as reported in Table 4, show that the DSHARIAH is positive,
but insignificant, in influencing initial returns.Results concerning other determinants, which will be discussed in later section, are also not influenced by the incorporation of DSHARIAH in the model. These results lend strong
support to the aforementioned claim by Abdul-Rahim and Yong (2008, 2010). 100 Initial Returns (%) 80 60 40 20 0 -20 -40 1999 27.10 37.03 23.87 28.26 All IPOs Matched Shariah Non-Shariah Shariah 2001 24.24 -16.2 -21.4 27.29 2003 45.55 46.47 30.08 47.10 2005 18.86 13.43 21.64 18.46 2007 37.13 6.25 10.00 39.84 2000 63.32 -6.25 36.36 64.16 2002 25.13 7.06 52.79 22.43 2004 40.88 51.88 80.42 38.48 2006 23.08 2.89 11.60 24.20 2008 -16.5 2.26 -25.6 -14.7
FIGURE 2. Trend of IPO initial returns, 1999-2008
TABLE 4. Results of regression on the whole IPO sample with and without the Shariah dummy variable
Variables Without DSHARIAH With DSHARIAH
Coefficient t-statistics Coefficient t-statistics
ALLOCTj -26.3144 -4.4790*** -26.2991 -4.4858***
GROWTH 2.9402 0.4150 2.8626 0.3974
OPERISK -0.8168 -0.4614 -0.8413 -0.4706
DSHARIAH 1.2816 0.17133
Control Variables (CV) OFERSIZE -7.6350 -2.3183** -7.6034 -2.3071**
AGE 4.5770 2.1189** 4.5970 2.1182** COSIZE 2.8512 0.7471 2.8934 0.7519 OWNER5 -0.3081 -1.9173* -0.3086 -1.9065* DWRITER -4.4301 -1.0720 -4.3994 -1.0549 DMKT -0.5699 -0.0856 -0.6121 -0.0915 INTERCEPT 116.7600 3.1543*** 114.8650 2.9765*** Adjusted R-Squared 0.1491 0.1469 F-Statistics 8.4555*** 7.5936*** Probability 0.000 0.000 Durbin-Watson stat. 1.4465 1.4464 VIF range 1.033-3.699 1.033-3.715
Notes: Autocorrelation and heteroskedasticity are determined through the Breusch-Godfrey Langrange multiplier test and corrected with a Newey-West Covariance estimator. The adjusted values are highlighted by symbol #. *, ** and *** denote significance at the 10 percent, 5 percent, and 1 percent levels, respectively.
RESULTS OF CORRELATION ANALYSIS
The correlations in Table 5 provide the pairwise relationships between initial returns and each of the explanatory variables. The relationships between independent variables, in the meantime, can be used to detect multicollinearity problems that may affect the regression results, but the results are not reported here to conserve space. As later confirmed with the variance inflation factor (VIF) values, none of the independent
variables are correlated at levels that indicate the existence of multicollinearity problems in the regression models. The correlations indicated by the results presented in Table 5suggest that the initial returns of non-Shariah, Shariah and matched Shariah IPOs are each related to a different
set of variables. The variables that are significantly related to the initial returns of the whole sample and Shariah IPOs are allocation rate (ALLOCT); operating
risk (OPERISK); the size of the IPO offer (OFSIZE); firm
age (AGE); firm size (COSIZE); and ownership structure
(OWNER5). The similarities between the relationships in
the whole sample and Shariah IPOs are more likely due
to the fact that the majority of newly listed companies hold Shariah status (∼90%). This set of variables is almost completely different from the set of variables for non-Shariah compliant IPOs. The initial returns of
non-Shariah IPOs are significantly correlated to allocation rate
(ALLOCT) and market condition (DMKT). Meanwhile, the
initial returns of the matched Shariah IPOs are significantly
correlated to allocation rate (ALLOCT) and the size of the IPO offer (OFSIZE). Overall, regardless of categorizations,
only allocation rate (ALLOCT) is consistently significantly
correlated to initial returns. The negative correlation between ALLOCT and initial returns can be taken as
preliminary support for the winner’s curse hypothesis. The hypothesis suggests that when the allocation rate is high, IPOs are typically overpriced and allocation is high
because institutional investors are more likely to avoid these IPOs. Not having the same information as informed
investors, uninformed investors place their subscriptions and win the allocations. When the new issues start trading, the fair price is revealed and turns out to be lower than the offer price. To summarize, the higher the allocation rate, the lower the initial returns.
TABLE 5. Correlations between initial returns and explanatory variables
Variables Whole Initial Returns Non-Shariah (IPORTNShariah OPEN) Matched Sample
IPORTNCLOSE 0.8149** 0.9016** 0.8070** 0.7574** ALLOCT -0.3563** -0.4618** -0.3437** -0.5635** GROWTH 0.027 -0.0078 0.0293 0.0453 OPERISK -0.1197** -0.004 -0.1314* -0.1232 OFSIZE -0.1888** -0.0864 -0.2016** -0.3657* AGE 0.0973* 0.0481 0.1069* 0.0097 COSIZE -0.1285** -0.0104 -0.1394** -0.2946 OWNER5 -0.1289** 0.036 -0.1466** -0.0229 DWRITER -0.0621 -0.0174 -0.0658 0.2098 DMKT 0.0069 0.3651* -0.0137 0.174
Notes: Asterisks ** and * denote correlations that aresignificant at the 0.01 level and 0.05 level (2-tailed), respectively.
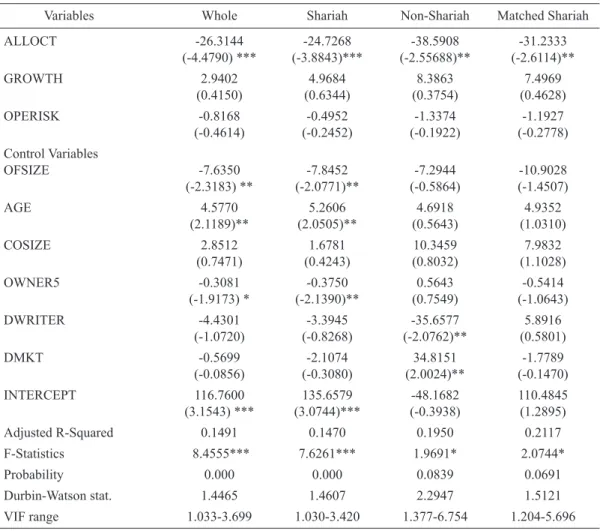
DETERMINANTS OF IPO INITIAL RETURNS
The second part of the present study focuses on the determinants of the initial returns of the Shariah IPOs,
which are analyzed by running the cross-sectional multiple regression analyses of Equation (5). Before the regression results are discussed, it is important to report that the variance inflation factors (VIF) of each variable in
the regression analyses are always lower than 10, which indicates that the results can be considered free from multicollinearity problems (Kleinbaum et al. 1998). The results of the Breusch-Godfrey Lagrange Multiplier tests for identifying autocorrelation and heteroskedasticity problems in each model are also reported. Whenever the standard regression analyses detect the presence of autocorrelation and heteroskedasticity issues, the problems are treated with the Newey–West covariance estimator so
that the regression results are more precise in estimating the coefficients.
Within the scope of determinants examined in this study, the results in Table 6 may be summarized as follows. The initial returns of non-Shariah IPOs are significantly
explained by ALLOCT, DWRITER and DMKT. The initial
returns of Shariah IPOs are also explained by ALLOCT, but
that is the only similarity between the two groups.Unlike the initial returns of non-Shariah IPOs, the initial returns
of the Shariah IPOs are also explained by OFSIZE, AGE
and OWNER5. Based upon the results thus far, this study
finds evidence that supports the findings of Abdul-Rahim and Yong (2008, 2010) that the initial returns of IPOs are
not influenced by Shariah status. However, the findings of present study go further and determine that the initial returns of Shariah and non-Shariah IPOs are apparently
common variable (ALLOCT). A possible explanation for
the difference is that the previous studies (Abdul-Rahim & Yong 2008, 2010) do not incorporate some of the variables considered in the present study. Next, in confirming whether or not the difference in the determinant factors ofinitial returns between the two groups are influenced by the differences in the characteristics of the issuing firms, the results for the matched sample of Shariah IPOs are
examined. The results confirm earlier findings regarding the role of ALLOCT as the sole common factor in the two
groups of IPOs. ALLOCT is the only determinant of initial
returns among the matched Shariah IPOs.
CONCLUSION AND IMPLICATIONS
The present study examines a sample of 384 IPOs that
are issued and listed on Bursa Malaysia during a period spanning from January 1999 to December 2008. The sample IPOs are segregated according to their Shariah
compliance status. Since Shariah IPOs constitute the
majority of the IPOs in the Malaysian market, a comparison
with the non-Shariah IPOs might not be compatible.
Accordingly, a matched sample of Shariah IPOs that
contains the same number of IPOs and share similar
characteristics with the non-Shariah IPOs is created. The
comparison between non-Shariah IPOs and Shariah IPOs
(all or matched sample) yield results that demonstrate these groups share only one common factor (i.e., ALLOCT).
Therefore, it may be surmised that the two groups are determined by different factors. The results suggest that the initial returns of non-Shariah IPOs are also determined
by the reputation of the underwriter and the condition of the market. On the contrary, the initial returns of the Shariah IPOs (all) depends on the size of the offer; the
age of the issuer; and the total ownership of the top five shareholders. As far as the result of the matched Shariah sample is concerned, none of the other variables are significant in explaining the initial returns.
Overall, allocation rate (ALLOCT) is the only factor
that consistently matters in predicting initial returns of
IPOs. The negative impact of ALLOCT on the initial returns
of IPOs, regardless of Shariah status, suggests that IPOs
that are lowly demanded, and fully award investors’ subscriptions as a result, have a greater tendency to offer lower initial returns. As suggested by Amihud et al. (2003), the negative ALLOCT-initial returns relationship
indicates the existence of winner’s curse in the Malaysian TABLE 6. Results of multiple regression analyses on whole sample and sub-samples of IPOs
Variables Whole Shariah Non-Shariah Matched Shariah
ALLOCT -26.3144 -24.7268 -38.5908 -31.2333 (-4.4790) *** (-3.8843)*** (-2.55688)** (-2.6114)** GROWTH 2.9402 4.9684 8.3863 7.4969 (0.4150) (0.6344) (0.3754) (0.4628) OPERISK -0.8168 -0.4952 -1.3374 -1.1927 (-0.4614) (-0.2452) (-0.1922) (-0.2778) Control Variables OFSIZE -7.6350 -7.8452 -7.2944 -10.9028 (-2.3183) ** (-2.0771)** (-0.5864) (-1.4507) AGE 4.5770 5.2606 4.6918 4.9352 (2.1189)** (2.0505)** (0.5643) (1.0310) COSIZE 2.8512 1.6781 10.3459 7.9832 (0.7471) (0.4243) (0.8032) (1.1028) OWNER5 -0.3081 -0.3750 0.5643 -0.5414 (-1.9173) * (-2.1390)** (0.7549) (-1.0643) DWRITER -4.4301 -3.3945 -35.6577 5.8916 (-1.0720) (-0.8268) (-2.0762)** (0.5801) DMKT -0.5699 -2.1074 34.8151 -1.7789 (-0.0856) (-0.3080) (2.0024)** (-0.1470) INTERCEPT 116.7600 135.6579 -48.1682 110.4845 (3.1543) *** (3.0744)*** (-0.3938) (1.2895) Adjusted R-Squared 0.1491 0.1470 0.1950 0.2117 F-Statistics 8.4555*** 7.6261*** 1.9691* 2.0744* Probability 0.000 0.000 0.0839 0.0691 Durbin-Watson stat. 1.4465 1.4607 2.2947 1.5121 VIF range 1.033-3.699 1.030-3.420 1.377-6.754 1.204-5.696
Notes: Autocorrelation and heteroskedasticity in the analysis are identified through the Breusch-Godfrey Langrange multiplier test and corrected with a Newey-West covariance estimator. The adjusted values are highlighted by symbol #. ***, ** and * denote significance at the 1%, 5% and 10% levels, respectively.
IPO market, which is consistent with the findings of Yong
(2009). The higher the allocation rate of the IPOs that the
investors (especially uninformed investors) win, the more likely that they win cursed IPOs (i.e., IPOs that provide
lower initial returns). In other words, the uninformed investors are cursed because they win IPOs that are
overpriced.
The results of the present study are expected to guide investors and market regulators in formulating their respective strategies. Once the distinctive features of Shariah versus non-Shariah IPOs are established,
investors and fund managers should be more confident and receptive to factors that are statistically proven to exert significant influence over the initial returns of the IPOs. The results of the present study reveal that the
initial returns of Shariah IPOs are influenced by different
factors than those that influence the initial returns of non-Shariah IPOs. Muslim investors should pay more attention
to internal factors, particularly the size of the offer; the age of the company; and the ownership concentration of the company. Meanwhile, investors of non-Shariah IPOs
should pay closer attention to external factors, such as the reputation of the lead underwriter and the condition of the market.
Regardless of the Shariah status of the IPOs, investors
must be wary of the allocation rate of the IPOs. The higher
the allocation that one receives, the greater the chance of receiving an overpriced IPO. The findings provide evidence
of winner’s curse, which implies that the Malaysian
IPO market continues to experience high information
asymmetry.The winner’s curse phenomenon is somewhat alarming because it appears to be driven by the speculative behavior of investors who enter the IPO market and exit at
the first available opportunity. This behavior is reflected by the fact that investors are not paying attention to company fundamentals that are disclosed in the prospectus (Daily et al. 2005). Investors are neither influenced by the manner in which companies use IPO proceeds, nor are they influenced
by how the companies have performed in the past. The market regulator might interpret the indifference in the initial performances of Shariah versus non-Shariah
IPOs as implying a lacking in the Shariah screening criteria
adopted by the SAC. As detailed in the Appendix, the SAC places great emphasis on the permissibility (halal
or haram) of the businesses of the companies, while somewhat neglecting the other elements of Islamic investment, such as gharar (uncertainty) and maisir (gambling). International Shariah equity screening standards, particularly those of the Council of Islamic Fiqhi Association, evaluate the companies’ financial management. Two of the prudent financial management measurements are debt ratio and accounts receivable over total asset ratio (ARTA ratio). In capital structure literature,
the gearing ratio is commonly associated with the riskiness of the companies, while the ARTA ratio measures the extent
to which the assets owned by companies actually exist and are available to investors.
The present study also proposes that the indifference in the initial returns of the Shariah versus non-Shariah
IPOs is due to the manner the SAC publishes the
Shariah-compliant status under a blanket (i.e., without awarding any specific rating based upon how well the companies comply with the screening criteria). The blanket labeling is less informative because nearly all Malaysian listed companies (Figure 1) have attained Shariah-compliant status. As an analogy, without any specific rating (AAA, BB and etc.) given to bond instruments, investors have
difficulty in differentiating the riskiness and credibility of one bond in relation to another. Therefore, the present study proposes that the specific characteristics of Shariah-compliant stocks need to be examined to determine the rating of the stocks based upon the degree of compliance with Shariah rules. A similar proposition has been forwarded by Mohamad Akram (2006), the former Executive Director of International Shariah Research Academy for Islamic Finance (ISRA), who stresses the
need to examine the Shariah-compliant companies not only based upon their income, but also based upon their total debt; cash and interest bearing securities; and account receivables.
ACKNOWLEDGEMENT
The authors wish to acknowledge that this study is part of a larger research project on Shariah IPOs funded by
the Ministry of Higher Education under the Fundamental Research Grant Scheme (UKMTOPDOWN-EP-05-FRGS
0002-2011).
ENDNOTES
1 The development of the Malaysian Islamic equity market
began with the establishment of an informal group called the Islamic Instruments Study Group (IISG) by the SC in 1994, whose main function is to advise market participants on matters pertaining to issues in the Islamic capital market. On 16 May 1996, the SC established the Shariah Advisory Council (SAC), which is comprised of panels consisting of muftis, Islamic finance experts, Islamic scholars and scholars of various disciplines. One of the functions of the SAC is to formulate the screening criteria for assessing and awarding Shariah compliance status to financial instruments that are registered with the SC.
2 The paper is last updated on December 22, 2011.
3 The signaling model applies when asymmetric information
exists between investors (outsiders) and the issuers (insiders). Any action taken by the issuers, including financial decisions, will be translated into a certain signal which the investors rely upon to predict the company’s performance.
4 Faddish behavior refers to an overreaction by investors that
leads to an overvaluation in early aftermarket trading.
5 A cascade in the IPO market is a situation where potential
investors ignore their private information, but instead imitate earlier investors in making purchasing decisions. The cascade effect is also known as the bandwagon effect.
6 In 1976, the government of Malaysia implemented a public
policy requiring at least 30 percent of IPO share ownership distribution to be reserved for Bumiputra (the indigenous population). The minimum Bumiputra ownership requirement can be fulfilled via ownership of companies; mutual funds; or on an individual investor basis. Abdullah and Mohd (2004) examine the Bumiputra ownership policy as a potential factor that influences the performance of Malaysian IPOs. In contrast to the argument put forth by Moshirian et al. (2009) and the empirical evidence by Ariff and Shamser (1999), the findings of Abdullah and Mohd (2004) reveal that Bumiputra ownership allocation reduces underpricing.
REFERENCES
Abdullah, N.A.H. & Mohd, K.N.T. 2004. Factors influencing the under-pricing of initial public offerings in an emerging market: Malaysian evidence. IIUM Journal of Economics and Management 12(2):194-212.
Abdul-Rahim, R. & Yong, O. 2008. Initial returns of shariah-compliant IPOs in Malaysia. Capital Markets Review 16(2): 270-279.
Abdul-Rahim, R. & Yong, O. 2010. Initial returns of Malaysian IPOs and shariah-compliant status. Journal of Islamic Accounting and Business Research 1(1): 60-74.
Afirudin Tapa. 2004. The short run and long run performance of IPOs in different economic periods: 1990-1999. MFA 6th. Annual Conference Proceedings: Revitalising the Financial Market: The Tasks Ahead 29-38.
Agarwal S., Liu, C. & Ghon Rhee, S. 2008. Investor demand for IPOs and aftermarket performance: Evidence from the Hong Kong stock market. Journal of International Financial Markets, Institutions and Money 18: 176-190. Aggarwal, R. & Rivoli, P. 1990. Fads in the initial public offering
market.Financial Management 19: 45-57.
Amihud, Y., Hauser, S. & Kirsh, A. 2003. Allocations, adverse selection, and cascades in IPOs: Evidence from the Tel Aviv stock exchange. Journal of Financial Economics 68: 137-158.
Ariff, M. & Shamsher, M. 1999. Regulatory effect as an explanation for the excessive underpricing in an emerging market. Paper presented at the Graduate School, Universiti Utara Malaysia.
Bali, T.G. & Cakici, N. 2004. Value at risk and expected stock returns. Financial Analyst Journal: 57-73.
Bursa Malaysia. Available at http://www.bursamalaysia.com. my.
Chahine, S., Filatotchev, I. & Piesse, J. 2007. The effects of R&D investment and firm size on growth opportunities of newly listed firms: European evidence. Available at http:// ssrn.com/abstract=959155.
Chowdhry, B. & Sherman, A. 1996.The winner’s curse and international methods of allocating initial public offerings. Pacific-Basin Finance Journal 4: 15-30.
Chung, K.H., Li, M. & Yu, L.Q. 2005. Assets in place, growth opportunities, and IPO returns. Available at http://ssrn.com/ abstract=765884
Daily, C.M., Certo, S. T. & Dalton, D.R. 2005. Investment bankers and IPO pricing: Does prospectus information matter? Journal of Business Venturing 20: 93-111. Dawson, S.M. 1987. Secondary stock market performance of
initial public offers, Hong Kong, Singapore and Malaysia:
1978-1984. Journal of Business Finance Account 14: 65-76.
Finn, F.J. & Higham, R. 1988. The performance of unseasoned new equity issues-cum-stock exchange listings in Australia. Journal of Banking and Finance 12: 333-351.
Ibbotson, R. & Jaffe, J. 1975. Hot issue markets. Journal of Finance 30: 1027-1042.
Jelic, R., Saadouni, B. & Briston, R. 2001. Performance of Malaysian IPOs: Underwriters reputation and management earnings forecasts. Pacific-Basin Finance Journal 9: 457-486.
Kleinbaum, D.G., Kupper, L.L., Muller, K.E. & Nizam, A. 1998. Applied Regression Analysis and Other Multivariable Methods. 3rd edition. Pacific Grove: Duxbury Press. Ku Ismail, N.I., Abidin, F.Z. & Zainudin, N. 1993. Performance
of new stock issues on the KLSE. Capital Markets Review 1(1): 81-95.
Lee, P.J., Taylor, S.L. & Walter, T.S. 1999. IPO under-pricing explanations: Implications from investor application and allocation schedules. Journal of Financial & Quantitative Analysis 34: 425-444.
Leland, H.E. & Pyle, D.H. 1977. Information asymmetries, financial structure, and financial intermediation. Journal of Finance 32: 371-387.
Leone, A.J., Rock, S.K. & Willenborg, M. 2007. Disclosure of intended use of proceeds and underpricing in initial public offerings. Available at http://ssrn.com/abstract=384620 Loughran, T., Ritter, J. & Rydqvist, K. 1994. Initial public
offerings: international insights. Pacific-Basin Finance Journal 2: 165-199.
McDonald, J.G. & Fisher, A.K. 1972. New issue stock price behaviour. Journal of Finance 27: 97-102.
Mohamad Akram, L. 2006. Shariah approved securities screening process in Malaysia. Available at http:www. ISRA.com.my.
Moshirian, F., Ng, D. & Wu, E. 2009. Model specification and IPO performance: New insights from Asia. Research in International Business and Finance. doi:10.1016/j. ribaf.2009.01.003.
Reilly, F.K. & Hatfield, K. 1969. Investor experience with new stock issues. Financial Analyst Journal 25: 73-80. Ritter, J.R. 1984. The hot issue market of 1980. Journal of
Business 57: 215-240.
Ritter, J.R. 1998. Initial public offerings.Contemporary Finance Digest 2(1): 5-30
Rock, K. 1986. Why new issues are underpriced? Journal of Financial Economics 15: 187-212.
Securities Commission. Available at http://www.sc.com.my. Shen, Z., Coakley, J. & Instefjord, N. 2008. Earnings
management, underpricing and underperformance of Chinese IPOs. Papers presented at EFMA “Merton H Miller” doctoral seminar. 2-56.
Welch, I. 1992. Sequential sales, learning, and cascades. Journal of Finance 47: 695-732.
Wu, T.S. 1993. The long run performance of initial public offerings in Malaysia. Capital Market Review1(1): 61-80. Yong, O. 1991. Performance of new issue securities in Malaysia.
Malaysian Accountant (June): 3-6.
Yong, O. 1996. Size of the firm, over-subscription ratio and performance of IPOs. Malaysian Management Review 31(2): 28-39.
Yong, O. 1997. Initial public offerings: The Malaysian experience 1990-1994. In Advances in Pacific-Basin
Capital Markets, edited by T. Boss & T. Fetheston, Vol. 3 177-188. Connecticut : JAI Press.
Yong, O. 2007. Investor demand, size effect and performance of Malaysian initial public offerings: Evidence from post-1997 financial crisis. Jurnal Pengurusan 26: 25-47.
Yong. O. 2008. Initial performance of IPOs listed on MESDAQ. Capital Markets Review 16(1): 27-43.
Yong, O. 2009. Winner’s curse, bandwagon effect and size effect in IPOs: Evidence from private placement IPOs in Malaysia. Discussion Paper Series. Faculty of Economic and Business. 4: 2-23.
Zheng, S.X. & Stangeland, D.A. 2005. IPO characteristics and analyst forecasts. Available at http://ssrn.com/ abstract=869248.
Ruzita Abdul-Rahim (corresponding author) Faculty of Economics and Management Universiti Kebangsaan Malaysia 43600 UKM Bangi, Selangor, MALAYSIA E-Mail: [email protected]
Nor Azizan Che-Embi
Kulliyyah of Economics and Management Sciences International Islamic University of Malaysia 53100, Jalan Gombak, Selangor, MALAYSIA E-Mail: [email protected]
APPENDIX
SCREENING CRITERIA OF THE SHARIAH ADVISORY COUNCIL
The Shariah screening process of the ShariahAdvisory Council (SAC) of the Securities Commission (SC) places
emphasis on the main activities and the sources of income of the listed companies. The SC collects information on the
position of the companies from various sources, such as the companies’ annual financial reports and their responses to the SC’s standard survey forms. The SC can also
request additional information and data directly from the respective companies. The SAC applies standard criteria,
which focus upon the activities of the companies applying for the Shariah-compliant status. The SAC will not grant the
Shariah-compliant status to companies that are involved in the following prohibited (haram) activities1:
a. Financial services based on interest (riba); b. Gambling;
c. Manufacture or sale of non-halal products or related products;
d. Conventional insurance;
e. Entertainment activities which are not permissible according to the Shariah;
f. Manufacture or sale of tobacco-based products or related products;
g. Stock broking or share trading in non-Shariah compliant securities; and
h. Other activities considered non-permissible according to Shariah.
However, as reported in the Resolutions of the Shariah Advisory Council (SAC) of the Securities Commission on
21 August 1996, the SAC agreed to also consider mixed
business companies (i.e., companies whose business activities include both permissible and prohibited elements) to be eligible for the Shariah-compliant status. As finally outlined in the SAC guidelines on 27 August
1997, the additional criteria for screening mixed business companies require the following pre-requisites:
a. The core activities of the company must not be against Shariah principles concerning the benevolent public perception or image of the company.
b. The core activities of the company must provide benefit to the Muslim ummah (community), while the non-permissible elements of business must constitute a small portion of the company’s overall activities; and involve transactions that are difficult to avoid (ummumbalwa) or involve custom (uruf) and the rights of the non-Muslim community that are accepted by Islam.
Later on, on 22 July 2002, the SAC outlined the
specific quantitative criteria, which are more definite and objective for determining the extent of impure activities and the resulting incomes that are considered tolerable for awarding Shariah-compliant status to mixed business companies. As depicted in Figure A, the additional criteria are specified in four benchmarks that applicant companies must adhere with in accounting for the non-permissible (non-approved) elements in their businesses.
1 Securities Commission website http://www.sc.com.
Turnover (TO) and profit before tax (PBT) of non-approved activities
Statement of Position (SOP) of non approved activities Interest income Dividend received from investment in non-approved securities
TO and PBT of non-permissible activities vs group’s TO and PBT SOP of non-permissible activities vs group’s PBT
Interest income vs group’s TO Dividend received from investment in non-approved securities vs group’s PBT
5 percent - contribution from clearly prohibited activities such as interest, pork, gambling and even manufacturing of condoms.
10 percent - contribution from activities of umum balwa like interest from conventional banks or revenue from tabacco-related products.
20 percent - contribution from rental payment from premise for gambling and liqour selling.
25 percent - contribution from activties that are generally halal and umum balwa but tainted with other prohibited elements such as in hoteling, brokerage houses and airlines. CONSOLIDATED
INFORMATION ON TO AND PBT CONTRIBUTION COMPARISONAGAINST BENCHMARK
Notes: Non-approved securities are securities that do not comply with Shariah rules.
Sources: Resolutions of the Securities Commission Shariah Advisory Council (http://www.mifc.com/sift_09/content/othpub/8ICMbook2(6).pdf) Mohamad Akram (2006)
FIGURE A. SAC’s quantitative screening criteria for mixed business companies It is also important to note that the SAC reserves the
right to evaluate the mixed companies based on their image (i.e., how these companies are perceived by others) in a separate qualitative evaluation in cases that involve companies that are notorious for engaging in the following
activities: (i) serving alcoholic drinks in public transport; (ii) running a pork-based business; (iii) selling alcoholic drinks in restaurants; (iv) takeovers of casino companies; (v) advertising alcoholic drinks; and (vi) holding equity interest in other listed companies that are notShariah-compliant.